Scientific Papers Series Management, Economic Engineering in Agriculture and Rural Development Vol. 14, Issue 4, 2014
PRINT ISSN 2284-7995, E-ISSN 2285-3952
153
ANALYSIS ON THE EVOLUTION OF SURFACES UNDER VINE IN
ROMANIA (2003-2013)
Georgiana-RalucaăL DARU1
, Silviu BECIU2, IonelaăMi ukoăVLAD3
1
The Bucharest University of Economic Studies, 6 Romana Square, Bucharest, Romania, Email: [email protected]
2,3
University of Agricultural Sciences and Veterinary Medicine, Bucharest, 59 Marasti, District 1, 011464, Bucharest, Romania, E-mail: [email protected], [email protected]
Corresponding author: [email protected]
Abstract
The paper aimed to make an analysis on the evolution of the areas under vines in Romania for the period 2003-2013 related with the factors that contributed to this evolution. The research method is related with dynamic analyze of time data series, using absolute and relative indicators. The discussions are focused on evolution of total vineyards, underlining the evolution tendencies of grafted vines areas. In Romania, the areas decreased with 23,5 % during the period 2003-2013. The share of grafted vines in the total areas increased from 49,62 % in 2003 to 50,03 % in 2013, but in absolute term the areas with grafted vines decreased with 26.042 ha in the selected period.
Key words: analysis, Romania, vineyards
INTRODUCTION
The wine sector is considered to be an economic and strategic sector with major importance [4] in the countries with important areas under vines. Romania is considered a tradition wine producing country being member of the International Office of Wine and Vine since 1928. The evolution of the surfaces under vines in Romania followed the EU trends where the production surplus conducted to difficulties in sales on internal and international markets, which also led to measures for ban on planting. As new
member state of the EU, Romania
beneficiated of the CMO for wine reform adopted by the EU in 2008. [3] The wine sector in Romania will face new challenges from 2016 when EU restrictions on planting vines will be removed, allowing competitive producers to increase the areas under vines and develop their grapes and wine production. Elimination of restriction in the EU countries will probably change the decreasing trend of
world’s total vineyard surface area, estimated
in 2014 at 7519 million ha. [2] For this paper authors chose to make the analysis of dynamics time series, which is considered to be an efficient method for the macro-economic studies [1].
MATERIALS AND METHODS
For this paper, we processed time series from national statistic related with the inputs from the wine sector, in order to obtain indicators that helped us in elaborating of a point of view concerning evolution of areas under vines in Romania. The indicators were calculated in absolute, relative and average terms. It was calculated: the absolute change of the areas under vines in Romania for the period 2003-2013, using fixed basis index and variable basis index the dynamic index of the areas under vines; the growth rate of this areas, calculated with fixed basis index and the growth rate calculated with the variable basis index.
RESULTS AND DISCUSSIONS
Scientific Papers Series Management, Economic Engineering in Agriculture and Rural Development Vol. 14, Issue 4, 2014
PRINT ISSN 2284-7995, E-ISSN 2285-3952
154
Romania, the area cultivated with vines is dived between areas cultivated with grafted vines in bearing and hybrid vines in bearing. The share of grafted vines in the total areas increased from 49.62 % in 2003 to 50.03 % in 2013, but in absolute term the areas with grafted vines decreased with 26.042 ha from 2003 to 2013. The promulgation of the Land Law (Law 18/1991) leads to increase of areas under vine in the private sector. In 2004, Romania cultivated 131,325 ha with grafted vines, representing the largest grafted vines bearing area from the analysed period. In this interval of time the largest area with hybrid bearing vines was cultivated in 2003. Until 2014, Romania had to cut down 30,000 ha of hybrid varieties, forbidden for cultivation in the European Union.
Table 1. Evolution of areas under vines in Romania (in absolute terms)
Year
Total Vineyards
(ha)
Grafted vineyards
(ha)
Hybrid Vineyards
(ha)
2003 233,316 115,777 117,539
2004 205,381 131,325 74,056
2005 190,606 98,559 92,047
2006 190,542 96,710 93,832
2007 187,629 92,356 95,273
2008 183,971 92,707 91,264
2009 184,439 93,926 90,513
2010 176,991 90,049 86,942
2011 176,616 88,047 88,569
2012 178,654 89,735 88,919
2013 178,378 89,735 88,643
Source: Tempo Online – National Institute of Statistic -Romania
The national measures for conversion of vineyards had the greatest impact on the wine sector within this period of time. Accessing of this measure, producers in Romania have managed to restructure and modernize important surfaces.
Compared with 2003, the absolute change of grafted vines area had positive value only in 2004. The absolute change of the vines area, calculated with fixed base indicates that in 2011 was recorded the smallest area with total vineyards from Romania in this interval of time (Table 2).In the last years Romania
didn’t recorded important changes for the total areas under vines.
Table 2. Evolution of areas under vines in Romania (absolute change calculated with fixed basis – year 2003)
Year
Total vineyards
(ha) (+/-)
Grafted Vineyards
(ha) (+/-)
Hybrid Vineyards
(ha) (+/-)
2003 233,316 115,777 117,539
2004 -27,935 +15,548 -43,483
2005 -42,710 -17,218 -25,492
2006 -42,774 -19,067 -23,707
2007 -45,687 -23,421 -22,266
2008 -49,345 -23,070 -26,275
2009 -48,877 -21,851 -27,026
2010 -56,325 -25,728 -30,597
2011 -56,700 -27,730 -28,970
2012 -54,662 -26,042 -28,620
2013 -54,938 -26,042 -28,896
Source: Own calculation based on Tempo Online series- National Institute of Statistic – Romania
If we calculate the evolution of the absolute change of the areas under vines in Romania (Table 3), using base chained method we can conclude that in 2004 was recorded the highest negative value for total vineyards, comparative with 2003, while in 2012 was recorded the first positive trend, compared to 2011.
Table 3. Evolution of areas under vines in Romania (absolute change calculated with the base chained)
Year
Total vineyards
(ha) (+/-)
Grafted Vineyards
(ha) (+/-)
Hybrid Vineyards
(ha) (+/-)
2003 233,316 115,777 117,539
2004 -27,935 +15,548 -43,483
2005 -14,775 -32,766 +17,991
2006 -64 -1,849 +1,785
2007 -2,913 -4,354 +1,441
2008 -3,658 +351 -4,009
2009 +468 +1,219 -751
2010 -7,448 -3,877 -3,571
2011 -375 -2,002 +1,627
2012 +2,038 +1,688 +350
2013 -276 0 -276
Scientific Papers Series Management, Economic Engineering in Agriculture and Rural Development Vol. 14, Issue 4, 2014
PRINT ISSN 2284-7995, E-ISSN 2285-3952
155 The grafted bearing areas had the biggest
positive change in 2004 comparative with 2003, followed by the highest negative change in 2005 compared to 2004. Calculating the dynamic index for the areas under vines (Table 4), using the fixed base, we can notice that in 2011 the total areas under vines represented only 75.7 % from the 2003 total vine areas.
Table 4. Dynamic index calculated with fixed base for the areas under vines in Romania
Year
Total vineyards
(%)
Grafted Vineyards
(%)
Hybrid Vineyards
(%)
2003 100 100 100
2004 88.03 113.43 63.01
2005 81.69 85.13 78.31
2006 81.67 83.53 79.83
2007 80.42 79.77 81.06
2008 78.85 80.07 77.65
2009 79.05 81.13 95
2010 75.86 77.78 96.05
2011 75.70 76.05 97.85
2012 76.57 77.51 100.4
2013 76.45 77.51 100.08
Source: Own calculation based on Tempo Online series- National Institute of Statistic - Romania
In 2004, the areas with grafted vines were higher with 13.43 % compared with 2003, while in 2011 represented only 77.51 % from the total grafted areas from 2003.
Table 5. Dynamic index calculated with the base chained for the areas under vine in Romania
Year
Total vineyards
(%)
Grafted Vineyards
(%)
Hybrid Vineyards
(%)
2003 100 100 100
2004 88.03 113.43 63.01
2005 92.81 75.05 124.29
2006 99.97 98.12 101.94
2007 98.47 95.50 101.54
2008 98.05 100.38 95.79
2009 100.25 101.31 99.18
2010 95.96 95.87 96.05
2011 99.79 97.78 101.87
2012 101.15 101.92 100.40
2013 99.85 100.00 99.69
Source: Own calculation based on Tempo Online series- National Institute of Statistic - Romania
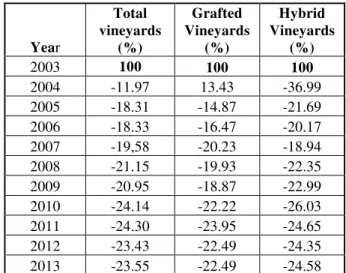
The dynamic index calculated with the base chained (Table 5) had the lowest value in 2004 (88.03 %) for the total areas under vines and the highest value in 2012 (101.15%). The rate of increase, calculate with fixed base (year 2003) had only negative values for the total areas under vine. This indicator was positive only in 2004 for grafted areas under vine (13.43 %). The highest negative rate, corresponding with a negative growth was recorded in 2004 for hybrid vines areas (-36.99%).
Table 6. Rate of increase calculated with fixed base for the areas under vines in Romania
Year
Total vineyards
(%)
Grafted Vineyards
(%)
Hybrid Vineyards
(%)
2003 100 100 100
2004 -11.97 13.43 -36.99
2005 -18.31 -14.87 -21.69
2006 -18.33 -16.47 -20.17
2007 -19,58 -20.23 -18.94
2008 -21.15 -19.93 -22.35
2009 -20.95 -18.87 -22.99
2010 -24.14 -22.22 -26.03
2011 -24.30 -23.95 -24.65
2012 -23.43 -22.49 -24.35
2013 -23.55 -22.49 -24.58
Source: Tempo Online – National Institute of Statistic -Romania
Table 7. Rate of increase calculated with the base chained for the areas under vine in Romania
Year
Total vineyards
(%)
Grafted Vineyards
(%)
Hybrid Vineyards
(%)
2003 100 100 100
2004 -11.97 13.43 -36.99
2005 -7.19 -24.95 24.29
2006 -0.03 -1.88 1.94
2007 -1.53 -4.50 1.54
2008 -1.95 0.38 -4.21
2009 0.25 1.31 -0.82
2010 -4.04 -4.13 -3.95
2011 -0.21 -2.22 1.87
2012 1.15 1.92 0.40
2013 -0.15 0.00 -0.31
Source: Tempo Online – National Institute of Statistic -Romania
Scientific Papers Series Management, Economic Engineering in Agriculture and Rural Development Vol. 14, Issue 4, 2014
PRINT ISSN 2284-7995, E-ISSN 2285-3952
156
vineyards. (Table 7).
The average area under vines in Romania for this period was 189,683 ha. In the case of grafted vines areas the average surface in Romania for the period 2003-2011 was 98,084 ha, while for the hybrid vines areas, the average value was 91,599 ha.
CONCLUSIONS
Romania has important surfaces under vines, which requires a special attention due to sector contribution to the GDP and its social importance for the rural areas population located in the wine traditional regions. In a period when vine cultivators faced important economic difficulties, Romania continued to hold large areas of wine, ranking 11 in terms of area cultivated with vines at world level, respective 5th place in the European Union. The areas under vine from Romania suffered important changes due to new Romanian and EU regulations. Also the orientation for quality, of Romanian producers influenced the structure of the vines surfaces in the last decade.
ACKNOWLEDGMENTS
This work was cofinanced from the European Social Fund through Sectorial Operational Programme Human Resources Development 2007-2013, project number POSDRU/159 /1.5/S/134197 „Performance and excellence in doctoral and postdoctoral research in
Romanian economics science domain”
REFERENCES
[1]Anghelache, C., Manole, A., 2012,
Dynamic/Chronological (Time) Series, Romanian Statistical Review, 10, 78-87
[2]Aurand J., 2014, State of Vitiviniculture World Market, International Organization of Vine and Wine [3]European Commission – Directorate General for Agriculture and Rural Development, 2007, A sustainable legal framework for the European Wine Sector
[4]Ia işin Tatiana, Colesnicova, Tatiana, Şuşu- urcan Aurelia, 2014, Modernization of wine sector in the context of Innovative economy, Scientific Papers