www.biogeosciences.net/14/163/2017/ doi:10.5194/bg-14-163-2017
© Author(s) 2017. CC Attribution 3.0 License.
Uncertainties in the national inventory of methane emissions from
rice cultivation: field measurements and modeling approaches
Wen Zhang1, Wenjuan Sun2, and Tingting Li1
1LAPC, Institute of Atmospheric Physics, Chinese Academy of Sciences, Beijing, China 2LVEC, Institute of Botany, Chinese Academy of Sciences, Beijing, China
Correspondence to:Wenjuan Sun (sunwj@ibcas.ac.cn)
Received: 10 June 2016 – Published in Biogeosciences Discuss.: 27 July 2016
Revised: 8 December 2016 – Accepted: 16 December 2016 – Published: 12 January 2017
Abstract. Uncertainties in national inventories originate from a variety of sources, including methodological fail-ures, errors, and insufficiency of supporting data. In this study, we analyzed these sources and their contribution to uncertainty in the national inventory of rice paddy methane emissions in China and compared the differences in the approaches used (e.g., direct measurements, simple regres-sions, and more complicated models). For the 495 field measurements we collected from the scientific literature, the area-weighted 95 % CI (confidence interval) ranged from 13.7 to 1115.4 kg CH4ha−1, and the histogram distribution
of the measurements agreed well with parameterized gamma distributions. For the models, we compared the performance of methods of different complexity (i.e., the CH4MOD model, representing a complicated method, and two less complex statistical regression models taken from literature) to evaluate the uncertainties associated with model perfor-mance as well as the quality and accessibility of the regional datasets. Comparisons revealed that the CH4MOD model may perform worse than the comparatively simple regres-sion models when no sufficient input data for the model is available. As simulated by CH4MOD with data of irriga-tion, organic matter incorporairriga-tion, and soil properties of rice paddies, the modeling methane fluxes varied from 17.2 to 708.3 kg CH4ha−1, covering 63 % of the range of the field
measurements. When applying the modeling approach to the 10 km×10 km gridded dataset of the model input vari-ables, the within-grid variations, made via the Monte Carlo method, were found to be 81.2–95.5 % of the grid means. Upscaling the grid estimates to the national inventory, the to-tal methane emission from the rice paddies was 6.43 (3.79– 9.77) Tg. The fallacy of CH4MOD contributed 56.6 % of the
total uncertainty, with the remaining 43.4 % being attributed to errors and the scarcity of the spatial datasets of the model inputs. Our analysis reveals the dilemma between model per-formance and data availability when using a modeling ap-proach: a model with better performance may help in reduc-ing uncertainty caused by model fallacy but increases the un-certainty caused by data scarcity since greater levels of in-put are needed to improve performance. Reducing the total uncertainty in the national methane inventory depends on a better understanding of both the complexity of the mecha-nisms of methane emission and the spatial correlations of the factors that influence methane emissions from rice paddies.
1 Introduction
Rice cultivation is a major source of anthropogenic methane and a prime target of greenhouse gas mitigation efforts (Tian et al., 2016; Smith et al., 2008). Globally, the methane emis-sion from rice cultivation was about 18.3 Tg CH4yr−1
un-der intermittent irrigation and 38.8 Tg CH4yr−1 under
con-tinuous flooding in the 2000s (Zhang et al., 2016). Methane fluxes in rice paddies varied extensively with environmental and agronomic factors. Certain factors, such as rice biomass (Bachelet and Neue, 1993), organic matter input (Kern et al., 1995), water management (Khosa et al., 2011; Mishra et al., 1997), paddy soil properties (Yao et al., 1999; Gaunt et al., 1997), climate (Sass et al., 1991), and rice varieties (Su et al., 2015; Ding et al., 1999), have been recognized as hav-ing significant impacts on methane emissions. Other factors, such as atmospheric CO2and ozone contents (Dijkstra et al.,
sions, including metanalysis of direct measurements, pro-cess models, and empirically based statistical models. How-ever, the range of national and/or global source estimates remains large (Cao et al., 1996; Sass et al., 1999; Chen et al., 2013). The major factors that are known to regulate rice paddy methane emissions include agricultural management practices (Khosa et al., 2011; Sanchis et al., 2012; Sass et al., 1992; Bodelier and Laanbroek, 2006) and environmen-tal conditions, such as climate and soil properties (Conrad et al., 2007; Inubushi et al., 2011; Sass et al., 1991). Cur-rently, techniques for calculating methane emissions differ substantially and usually consist of scenario simulations (Ito and Inatomi, 2012; Van Bodegom et al., 2002a, b; Verburg et al., 2006), without integrated consideration of methodologi-cal fallacy and data insufficiency.
By extrapolating field measurements obtained from exper-iments, methane emissions from the 30 million ha of land under rice cultivation in China were estimated to range from 21.6 to 30 Tg CH4yr−1(Matthews et al., 1991; Taylor et al.,
1991), much larger than the result of a recent study (Zhang et al., 2016). The extrapolation of methane emission rates from site measurements to larger regions is unlikely to yield reli-able results because of the tremendous spatial heterogeneity in environmental conditions and agronomic activities (Ogle et al., 2010). Other studies have described the relationships between methane emissions and rice NPP (net primary pro-ductivity) (Bachelet and Neue, 1993) and organic matter in-puts (Bachelet et al., 1995). Ambient temperature and the use of nitrogen (N) fertilizer have also been identified as deter-minants of methane emissions (Kern et al., 1995; Bachelet et al., 1995). Until the significant reduction in methane emis-sions caused by mid-season drainage was confirmed (Sass and Fisher, 1997; Yagi et al., 1997; Li et al., 2002; Yan et al., 2005), all previous regional and national estimates (ob-tained using extrapolation or regression equations) were de-rived from continuously flooded rice fields. More factors, such as the (Watanabe et al., 1995; Butterbach-Bahl et al., 1997; Ding et al., 1999; Inubushi et al., 2011) soil properties (Sass et al., 1994; Yao et al., 1999), atmospheric CO2
(Dijk-stra et al., 2012; Xie et al., 2010b), and ozone (Bhatia et al., 2011) concentrations involved in rice cultivation, have also been incorporated into models designed to estimate methane emissions from rice paddies. Complex interactions among these factors have spurred model development (Cao et al., 1995; Li, 2000; Matthews et al., 2001; Huang et al., 1998, 2004; Van Bodegom et al., 2001). To delineate variations in
sions requires the development of an effective and reli-able model that incorporates various paddy environments and agronomic activities. However, our understanding of the complex biogeochemical processes that occur in paddy soils is poor. When estimating methane emissions from rice agri-culture, only factors that are thought to be key determinants of methane emissions have been incorporated into the mod-els. Excluding other factors introduces errors into the model output (Eqs. S6 and S7 in the Supplement). Improving our knowledge of methane processes in the future will increase the number of factors that are integrated into models and potentially delineate details related to spatiotemporal varia-tions.
Uncertainties in regional estimates of methane emissions from rice paddies stem not only from fallacy in the applied models but also from errors and inadequate data, which we discussed in a previous study (Zhang et al., 2014; Sect. S4 in the Supplement). A model with more factors generally per-forms better than a model with fewer factors but requires a larger amount of data to facilitate model application. A model with good performance (less fallacy) can still result in large uncertainties when the available input data (e.g., soil properties, rice irrigation, types and amount of organic mat-ter) are insufficient (Zhang et al., 2014; Ito et al., 2012).
In the present study, we analyzed the uncertainties in experimental measurements of methane fluxes in different rice paddies. We also evaluated the performance of different methods involving a diversity of input variables and the in-fluence of data availability on the performance of these meth-ods. Finally, the uncertainty in the national emissions inven-tory as a consequence of variable model performance and according to the quality and availability of input data was discussed.
2 Materials and methods
2.1 Field measurements of methane emissions from rice paddies in China
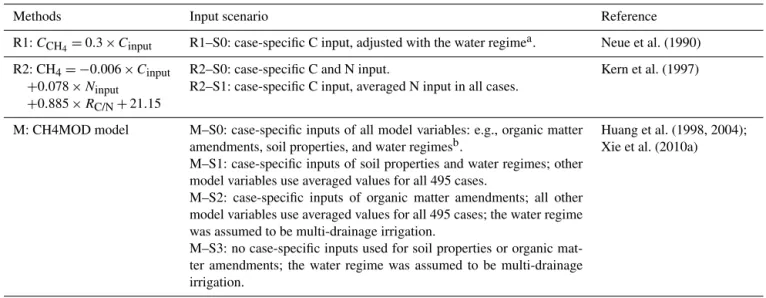
mea-Table 1.Methods and their input scenarios.
Methods Input scenario Reference
R1:CCH4=0.3×Cinput R1–S0: case-specific C input, adjusted with the water regime
a. Neue et al. (1990)
R2: CH4= −0.006×Cinput R2–S0: case-specific C and N input. Kern et al. (1997)
+0.078×Ninput R2–S1: case-specific C input, averaged N input in all cases. +0.885×RC/N+21.15
M: CH4MOD model M–S0: case-specific inputs of all model variables: e.g., organic matter amendments, soil properties, and water regimesb.
Huang et al. (1998, 2004); Xie et al. (2010a) M–S1: case-specific inputs of soil properties and water regimes; other
model variables use averaged values for all 495 cases.
M–S2: case-specific inputs of organic matter amendments; all other model variables use averaged values for all 495 cases; the water regime was assumed to be multi-drainage irrigation.
M–S3: no case-specific inputs used for soil properties or organic mat-ter amendments; the wamat-ter regime was assumed to be multi-drainage irrigation.
aRegression equation R1 was developed according to measurements conducted in continuously flooded fields, and the calculated flux was therefore adjusted by a scaling factor of 1.00, 0.65, or 0.56 for continuous flooding, single drainage, or multi-drainage irrigation, respectively (IPCC, 2006).bThe water regimes in the CH4MOD model (Huang et al., 2004) are more specifically defined and differ from those of the IPCC (2006).
surements were taken at the 33 sites, after excluding those that had been used for the model calibration (Neue et al., 1990; Kern et al., 1997; Huang et al., 2004). The amount of organic matter added to the rice paddies ranged from 0 to 15.3 t C ha−1and included animal manure, green manure, crop straw, biogas residuals, and their various components. The applied water regimes consisted of continuous flooding, single mid-season drainage, and multi-drainage irrigations.
Model performance was assessed by comparing the model estimates with the measurements. To drive the models, data pertaining to rice yields, soil properties, and crop phenolo-gies were collected from the relevant literature (Sect. S2 in the Supplement).
2.2 Performance of the methods used to estimate methane emissions
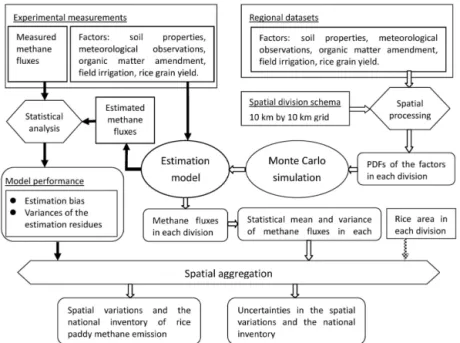
The uncertainties produced by the models derive from model fallacy (Kennedy and O’Hagan, 2001; Sect. S3 in the Sup-plement) as well as from the quality and availability of data (Fig. 2). Model performance was assessed by comparing model outputs with the direct measurements (left part in Fig. 2). Errors in the input data of the model can be propa-gated in the obtained estimates (right side of Fig. 2, Sect. S4 in the Supplement).
Many techniques are available for calculating estimates of rice paddy methane emissions, such as extrapolation of mea-sured emission rates (Khalil et al., 1991, 1993), statistical regression equations (Bachelet et al., 1995; Kern et al., 1995, 1997), and the application of models of varying complex-ity (Cao et al., 1995; Matthews et al., 2001; Van Bodegom et al., 2001; Huang et al., 1998; Li, 2000). Here we chose two regression models (Neue et al., 1990; Kern et al., 1997)
Figure 1.Locations of the experimental sites (red stars). The back-ground map represents the spatial distribution of rice paddies in China. The size of the red stars is proportional to the number of measured methane fluxes at the site. The polygons show zones of different crop rotation systems involving rice: I – double rice rota-tion, II – mixed zone of rice and rice rotation and rice and upland crop rotation, III & IV – rice and upland crop rotation or rice and fallow rotation, V & VI – rice and fallow rotation, and VII – no rice.
Figure 2.Flowchart for estimating regional and national methane emissions and the uncertainties associated with field measurements and modeling.
the sole predictor (Neue et al., 1990). Regression equation R2 is slightly more complicated in that it uses organic C and fertilizer N application as inputs (Kern et al., 1997). We as-sumed two data availability scenarios for R2. In R2–S0, both the C and N inputs are available; in R2–S1, only the C input is available (Table 1).
The third approach consists of a semiempirical model, CH4MOD. This model was developed to simulate methane emissions from rice paddies under diverse environmental conditions and various agricultural practices (Huang et al., 1998, 2004). The input variables of the model include the climate, soil conditions, water management type, organic matter application, and crop rotations. The model consists of two modules: the derivation of methanogenic substrates from added organic matter and rice root exudates and the production and emission of methane. Rice biomass is a key variable used to calculate the root exudates and the frac-tion of the methane emitted by rice plants and bubbles. The daily changes in the soil redox potential (Eh) were calcu-lated according to various water manipulations conducted in the rice paddies (Xie et al., 2010b). The influences of other environmental factors, such as soil temperature and texture, on the decomposition of organic matter and the production of methane were expressed as specific coefficient functions (Huang et al., 1998). The input variables of the CH4MOD model (Sect. S2 in the Supplement) include the daily air temperature, soil sand percentage (SAND), organic matter amendment (OM), rice grain yield (GY), water management pattern (Wptn), and rice cultivar index (VI).
Four model input scenarios (Table 1) were scheduled to evaluate the performance of CH4MOD under different levels
of data availability. In M–S0, all of the model variables were assigned specific values. In M–S1, the application of organic matter was assigned the average value for all experiments, thus assuming a situation where no detailed information on organic matter application was available. In M–S2, detailed information on the water regime and soil properties was as-sumed to be unavailable. In M–S3, detailed information on all three major factors (organic matter application, soil prop-erties, and water regime) was assumed to be unavailable.
The estimation residuals (1y, Eq. 1), relative bias (rb,
Eq. 2), and coefficient of variations (rv, Eq. 3) were thus
eval-uated as follows:
1yk= ˆyk−yk, i=1,2, . . ., n (1) rb=
E(1y)
E(y) ×100 % (2)
rv=
p
E((1y)2)−(E(1y))2
E(y) ×100 %, (3)
whereyrepresents the measured methane fluxes,yˆis the es-timate ofy, andnis the total number of measurements.E(·) indicates the statistical mean. The mean of the squared errors (MSE) of the estimation is calculated as follows:
MSE=E((1y)2)=(E((1y)2)−(E(1y))2)+(E(1y))2
=(F×rv)2+(F×rb)2, (4)
2.3 Uncertainties in estimating rice paddy methane emissions on national scales: data error and availability
In addition to model fallacy, the difficulties in estimating na-tional rice paddy methane emissions also stem from errors in, and limited availability of, input data. To measure the un-certainties in model outputs due to insufficient data quality and availability, we applied Monte Carlo simulations (Pen-man, 2000) to the CH4MOD model. Statistical characteris-tics were derived from the available datasets to develop prob-ability distribution functions (PDFs) for each model input variable (Tables S1 and S2 of Sect. S2 in the Supplement). We performed Monte Carlo simulations by randomly draw-ing values of the model input variables from their PDFs and then running the model. This process was iterated 1000 times and at the last step the mean and 95 % CI (confidence inter-val) of the calculated methane fluxes were derived from the iterations.
The factors involved in the uncertainty analysis in-cluded organic matter application, soil properties, and wa-ter regimes; these variables (OM, SAND, and Wptn) were
parameterized as input variables in the CH4MOD model (Huang et al., 2006; Zhang et al., 2011). The other two model input variables were the rice grain yield and daily ambient air temperature. These two variables were not used in the un-certainty analysis because sufficient relevant data were avail-able, which were characterized by less errors compared with the other variables (Zhang et al., 2014).
The SAND data were obtained from a 10 km×10 km grid dataset interpolated from soil survey data (Oberthür et al., 1999; Shi et al., 2004; Liu et al., 2006). It is possible that approximately half (Van Bodegom et al., 2002b) of the im-mense spatial variation in soil properties can be lost after spatial interpolation (Goovaerts, 2001); as a result, the miss-ing spatial variation was attributed to the PDF of the gridded SAND data (Sect. S2 in the Supplement).
The organic matter inputs in the rice fields consisted of various types of farm manure (green manure and animal fe-ces), crop straw, and dead roots and stubble leftover from pre-vious harvests. Root and straw biomass were calculated using the root / shoot ratio and harvest indices (Huang et al., 2007; Gao et al., 2002; Xie et al., 2010c). Stubble was assumed to represent 1/10 of the straw biomass (Huang et al., 2004). The proportions of incorporated straw and applied farm ma-nure were derived from data obtained from two large-scale investigations, the First National Census of Pollution Sources conducted by China’s Ministry of Environmental Protection (CFPC, 2011) and a census conducted by the Institute of At-mospheric Physics, Chinese Academy of Sciences. The pro-portion of straw and the amount of manure incorporated into the crop fields were summarized by province. Table S1 shows the statistical parameters of the PDF of organic matter incor-poration in each province.
The irrigation in rice cultivation were grouped into five general irrigation patterns: (1) flooding-drainage-flooding-intermittent irrigation, (2) flooding-drainage-flooding-drainage-flooding-intermittent ir-rigation, (3) flooding-intermittent irir-rigation, (4) continuous flooding, and (5) continuously intermittent irrigation (Gao and Li, 1992; Huang et al., 2004). Data pertaining toWptn
were only very rarely available on a regional scale. The limited information provided in a few studies (Mao, 1981; Liang, 1983; Xiong et al., 1992; Cai et al., 2003; Ma et al., 2005; MWRUC, 1996) could only yield rough estimates re-lated to irrigation in regions of major rice cultivation. The PDFs of field irrigation were defined by the occurrence per-centage of each irrigation pattern (Table S2 in the Supple-ment).
The data pertaining to the rice grain yield and harvesting area as of 2005 were obtained from China’s Statistical Year-book (EBCAY, 2006) and the nation’s agricultural database maintained by the Chinese Academy of Agricultural Sci-ences, respectively. The spatial distributions of all rice pad-dies in 2005 and the rice paddy area within each 1 km×1 km
grid were obtained from the Data Center for Resources and Environmental Sciences of the Chinese Academy of Sciences (RESDC, CAS). Daily mean air temperature data from 678 meteorological stations throughout China for 2005 were ac-quired from the National Meteorological Information Center (NMIC) of the China Meteorological Administration (CMA) (http://data.cma.cn/). The temperatures were then spatially interpolated into 10 km×10 km grids for each day according
to the method described by Thornton et al. (1997). Details on the datasets used in this study can be found in Sect. S2.
To preserve details related to spatial variations, all data in-put into the model were converted into 10 km×10 km grids. The applied rasterization techniques and details of how the model was run on raster datasets were provided in previously published papers (Huang et al., 2006).
2.4 Combining uncertainty and spatial aggregation In each 10 km×10 km grid, the uncertainties in our
esti-mates originated from both the model fallacy (Eq. 4) and error in the input data. Equation (5) was used to merge the two uncertainty sources where MSE was again split into two parts as showed in Eq. (4):
σT ,i2 =σb2,i+σv2,i+σd2,i
=(Fi×rb)2+(Fi×rv)2+σd2,i, (5)
whereσT ,i represents the uncertainty of the methane flux in gridi, andFi andσd,i represent the mean and standard devi-ation of the Monte Carlo simuldevi-ation results in gridi, respec-tively.rbandrvrepresent the same entities as in Eqs. (2) and
(3).
σd2,isignifies the uncertainty caused by the error and avail-ability of data,(Fi×rb)2represents the modeling bias, and
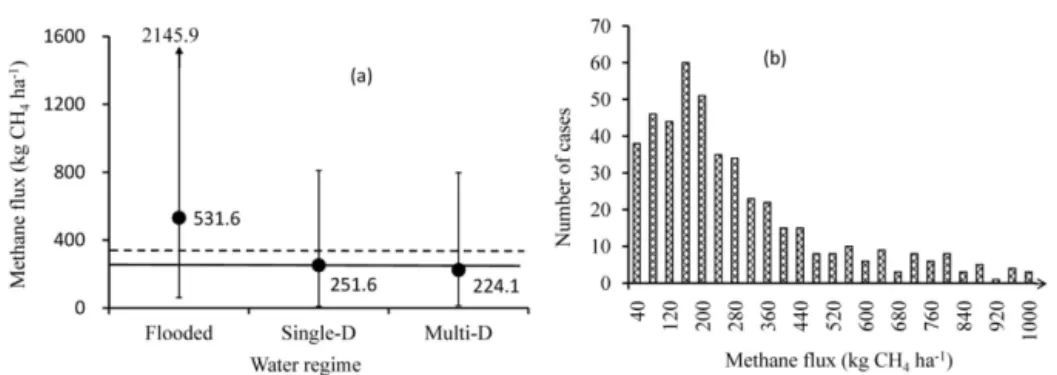
Figure 3.Statistical representations of the measured methane fluxes.(a)Statistical parameters and(b)histogram of the measurements. The solid circles represent the sample mean, and the vertical bars are the 95 % confidence intervals of the samples, from the 2.5 % percentile to the 97.5 % percentile. The dashed line indicates the arithmetic average of all measured fluxes (mc). The solid line is the area-weighted
mean of the methane fluxes (mw), in reference to the areal proportion of each water regime in the national total rice harvesting area: 10 %
continuous flooding (Flooded), 20 % single drainage (Single-D), and 70 % multi-drainage (Multi-D) (Xiong et al., 1992; MWRUC, 1996; Li, 2001; Zou et al., 2009).
from(Fi×rb)2. To produce the uncertainty of the national
in-ventory, the three components ((Fi×rb)2,(Fi×rv)2, andσd2,i
in Eq. 5) of the estimation uncertainties in all grids were sep-arately aggregated (Eqs. S15, S16, S17, and S18 in Sect. S4 of the Supplement) and summed as follows:
σT2=σb2+σv2+σd2. (6)
3 Results
3.1 Methane emissions and the uncertainties derived from field measurements
Among the 495 methane flux measurements (the accumu-lative methane emission from transplanting to harvesting), 184 (37 % of all cases) came from paddies that were con-tinuously flooded during the entire rice growing period, 50 (10 % of all cases) came from paddies with single mid-season drainage, and 261 (53 % of all cases) came from pad-dies under multi-drainage. The average methane fluxes as-sociated with the three water regimes were 531.6±512.6,
251.6±231.1, and 224.1±207.5 kg CH4ha−1(Fig. 3a). The
overall arithmetic average of the 495 measurements (rep-resented hereafter by mc) was 341.2±383.2 kg CH4ha−1.
However, the simple arithmetic average might be a biased representation of the “true” mean methane flux of rice pad-dies in China since far less than 37 % of the rice padpad-dies in China are continuously flooded. In the literature, 10, 20, and 70 % of the rice area was reported to be under continuous flooding, single drainage, and multi-drainage water regimes, respectively (Xiong et al., 1992; MWRUC, 1996), and the harvested-area-weighted mean (Sect. S1 in the Supplement) of the measured fluxes (represented hereafter by mw) was
260.4±281.6 kg CH4ha−1(Fig. 3a).
The 95 % CIs of the methane flux measurements were 61.1–2145.9, 9.6–809.9, and 14.0–797.7 kg CH4ha−1,
re-spectively, for the three water regimes (continuous flooding,
single drainage, and multi-drainage in Fig. 3a). The 95 % CI of all combined area-weighted measurements (Sect. S1 in the Supplement) was 13.7–1115.4 kg CH4ha−1. The
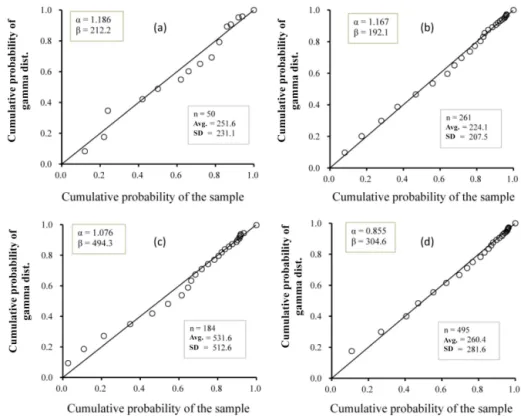
mea-surements were not normally or symmetrically distributed (Fig. 3b). The P-P plots (Fig. 4) showed that the param-eterized gamma distributions matched the sample distri-butions. The 95 % CIs calculated with the parameterized gamma functions were 16.8–1900.8, 10.4–863.4, and 8.9– 774.2 kg CH4ha−1, respectively, for the three water regimes
(continuous flooding, single drainage, and multi-drainage); these values overlapped the CIs derived directly from the measurements by 88.2, 99.9, and 97.0 %, respectively.
The national methane emissions from rice agriculture calculated by multiplying the rice harvesting area (year-book data in 2005) by the area-weighted mean flux (260.4±281.6 kg CH4ha−1) was 7.51 Tg CH
4 (Fig. 3a).
When the measurements are statistically independent, the standard error (SE) of the summation isn−1 (nis the
sam-ple size of the measurements) times smaller than the standard deviation (±281.6 kg CH4ha−1), which consists of the
rep-resentative and measurement errors of the measured fluxes (Van Bodegom et al., 2002a; Verburg et al., 2006). Assum-ing that the measurements were statistically independent, the 95 % CI of the national inventory was 7.20–8.58 Tg CH4
Figure 4.P-P plots of the cumulative probability of the measured methane fluxes vs. the gamma distribution.(a)Single-drainage irrigation cases,(b)multi-drainage irrigation cases,(c)continuous flooding irrigation cases, and(d)all cases after being area weighted (Sect. S1).n, avg., and SD represent the sample size, statistical mean, and standard deviation of the sample methane fluxes, respectively.αandβrepresent the shape and scale parameters of the gamma distribution, which were calculated with the statistical mean and variance of the measured methane fluxes;β=(SD)2/(avg.)andα=(avg.)/β. The diagonal line is the 1 : 1 straight line for a perfect gamma distribution match.
3.2 Model performance under different situations of data availability
The averaged bias of the estimate obtained with R1 was 212.0 kg CH4ha−1(Table 2) or 62.1 % of the measured mean
(mc=341.2 kg CH4ha−1). The average bias of R2, in
con-trast, was−1.3 kg CH4ha−1. R1 was more likely to
overesti-mate the amount of methane emitted than R2 (Table 2), espe-cially when more organic matter was incorporated (Fig. 5a). For example, in one case the modeled CH4 flux was more
than 6000 kg CH4ha−1, whereas the measured flux was less
than 3000 kg CH4ha−1(Fig. 5a). The estimates obtained
us-ing R2 did not show significant variations and appeared to de-cline when the measured methane fluxes increased (Fig. 5b). The CH4MOD model also produced a small averaged bias, representing 7.1 % of the measured mean. The MSE was 253.0, 407.8, and 596.0 kg CH4ha−1for the M–S0, R2–S0,
and R1–S0 scenarios, respectively (Table 2), which demon-strates that model performance improves when more factors are incorporated into the model.
Although the CH4MOD model produced better simulation results than the simple regression equations, its performance fundamentally depends on data availability. When no case-specific data were available (as in scenario M–S3), rb was −32.2 % and MSE was 122.1 % of the mean flux; the results
Table 2.Performance of the methods under different scenarios of data availability.
Method Bias of the SD of the estimation Root of
estimation (rb) residues (rv) MSE (RMSE)
R1–S0 212.0 (62.1 %)∗ 577.1 (163.3 %) 596.0 (174.7 %) R2–S0 −1.3 (−0.4 %) 407.8 (119.5 %) 407.8 (119.5 %) R2–S1 −4.9 (−1.4 %) 415.7 (121.8 %) 415.7 (121.9 %) M–S0 −24.2 (−7.1 %) 251.8 (73.8 %) 253.0 (74.1 %) M–S1 −30.8 (−9.0 %) 343.9 (100.8 %) 345.2 (101.2 %) M–S2 −120.7 (−35.4 %) 341.3 (100.0 %) 362.9 (106.1 %) M–S3 −109.8 (−32.2 %) 401.8 (117.8 %) 416.6 (122.1 %)
∗
Percentages in parentheses indicate the magnitude of the error relative to the overall average methane flux (341.2 kg CH4ha−1)for all cases.
obtained under this scenario were even worse than the re-sults obtained under the R2–S0 scenario (Table 2). For the M–S1 scenario, where the data pertaining to the soil proper-ties and water regime were case-specific, the magnitude ofrb
decreased to 9.0 % of the mean flux, and the MSE decreased to 101.2 % of the mean flux. The M–S0 scenario produced much better results than the other scenarios since more data were available for the key model input variables (Table 2). Even no case-specific input data used in M–S3 had smaller rb,rv, and MSE than R1–S0. In Table 2, largerrvof R1–S0
Figure 5.Methane fluxes in the experiments plotted against the respective simulation results through different methods.(a)R1–S0,(b)R2– S0, and(c)M–S0, which are described in Table 1.
Figure 6.Histograms and their fitting gamma probability lines for the calculated methane fluxes (via CH4MOD) of the 10 km×10 km rice paddy grids in China.(a)Single rice rotations, including rice-fallow rotations, and rotations of rice with upland crops;(b)early and(c)late rice in double rice rotations. The vertical bars are the histograms of the calculatedFj (Eq. 5), and the solid line is the theoretic gamma PDF
line, the parameters for which were derived from the statistics forFjvia momentum methods.
the influence from organic matter inputs on methane emis-sion that added extra error to the estimation.
3.3 Inventory of rice paddy methane emissions and the uncertainties with different approaches
Because of the spatial heterogeneity in the climate and soil properties, organic matter incorporation, and field irrigation in rice cultivation, the methane fluxes simu-lated by CH4MOD varied spatially between 17.2 and 708.3 kg CH4ha−1 from grid to grid (Fig. 6). The national
means for the simulated methane fluxes were 217.9, 204.6, and 255.8 kg CH4ha−1 for single, early, and late rice
culti-vation, respectively. The within-grid estimation error (σT ,i, calculated with Eq. 5) represented 81.2–95.5 % of the mean fluxesFiin the grids. In the present study, model fallacy, rep-resented byUb,i+Uv,i, contributed 79.5–88.9 % to the un-certaintyσT ,i2 , withσd2,i accounting for the remaining 11.1– 20.5 %. This implies that a model with better performance is needed to reduce the uncertainty ofσT ,iin each grid.
As shown in Fig. 7, the highest levels of emitted methane occurred in southern China, with the northeast also rep-resenting a major source of methane, despite this re-gion being climatically cool. The total amount of methane emitted, as calculated by the M–S0 approach, was 6.43 (3.79–9.77) Tg CH4yr−1 (Table 3), which is close to the
7.51 Tg CH4yr−1 derived from the experimental field
mea-surements.
In Table 3, the estimated national CH4 emissions ranged
from 6.43 (3.79–9.77) to 13.59 (1.45–38.98) Tg CH4yr−1for
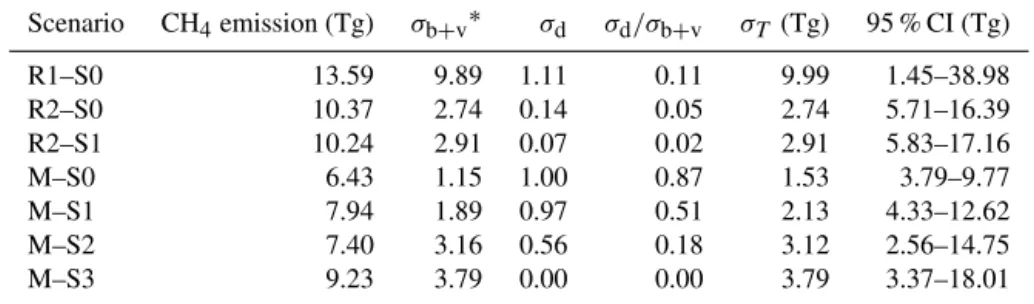
the M–S0 scenario and R1–S0 scenario, respectively. The 95 % CIs of the national estimation differed more among the approaches than those among the data availability scenarios of each approach. With M–S0, the fallacy of CH4MOD con-tributed 56.6 % of the total uncertainty, with the remaining 43.4 % being attributed to errors and the scarcity of the spa-tial datasets of the model inputs (Table 4). As an indicator of the trade-off between the complexity of the approach and data availability, theσd/ σb+v ratio in Table 3 was 0.87 for
M–S0, closer to 1 than those for the other approaches and scenarios, which also yielded the narrowest 95 % CI in Ta-ble 3.
4 Discussion
4.1 Contributions of different error sources to the uncertainties in the inventory
In the experimental field measurements (Fig. 1), the vari-ations in rice paddy methane fluxes ranged from 3.2 to 2451.7 kg CH4ha−1, averaging 341.2±383.2 kg CH4ha−1.
The average simulated methane fluxes in the 10 km×10 km
Table 3.Methane emissions inventory and the uncertainties caused by model imperfection and errors in model input data.
Scenario CH4emission (Tg) σb+v∗ σd σd/σb+v σT (Tg) 95 % CI (Tg)
R1–S0 13.59 9.89 1.11 0.11 9.99 1.45–38.98 R2–S0 10.37 2.74 0.14 0.05 2.74 5.71–16.39 R2–S1 10.24 2.91 0.07 0.02 2.91 5.83–17.16 M–S0 6.43 1.15 1.00 0.87 1.53 3.79–9.77 M–S1 7.94 1.89 0.97 0.51 2.13 4.33–12.62 M–S2 7.40 3.16 0.56 0.18 3.12 2.56–14.75 M–S3 9.23 3.79 0.00 0.00 3.79 3.37–18.01
∗Root ofU
b+Uv, uncertainty owing to model fallacy in the national inventory.
Figure 7. Spatial distributions of rice paddy methane emissions (×106g CH4per 10 km×10 km grid).
extremely high methane fluxes obtained from experimental measurements were not reproduced by the model estima-tions. This was partly due to the discrepancy in the spatial representativeness of the methane fluxes in field observa-tions and model estimaobserva-tions (Verburg et al., 2006). The ex-perimental measurements represented methane fluxes from an area of less than 1 ha, while the modeled fluxes were the averages from 10 km×10 km grids. This mismatch in
spatial representativeness might also be due to errors in the model input data as well as to the impacts of other unknown factors (Singh and Dubey, 2012; Bhatia et al., 2011; Zheng et al., 2010; Gauci et al., 2008). Methane emissions could be estimated using a limited number of factors and simpli-fied equations to express the complex relationships between methane emissions and influential factors, but such simplifi-cation resulted in poor performance of the methods (Table 2). In Eq. (5), σd,i is the uncertainty due to errors in the input data. With an increasing number of explanatory factors, rb
andrvmight decrease (which means better performance of
the method), but σd,i might increase because of the cumu-lative errors resulting from the increasing number of factors
Figure 8.Composition of the aggregated uncertainty of the national inventory along with the spatial autocorrelation of the variances of the model residues in grids. Distance criteria (Dc)are used to define
the step functions of spatial autocorrelation: if two grids diverge by a distance beyondDc, the autocorrelation is 0; otherwise, it is 1.
The step function is a simplified version and represents the upper limit of the true spatial autocorrelation. With the step function, a largerDcindicates stronger autocorrelation.
incorporated in the models. To reduce uncertainties in the es-timates and improve the performance of the model, the input data need to be available and of good quality.
The aggregated uncertainty of the national inventory de-pended not only on the magnitude ofσv,iandσd,iin each grid (i) but also on the spatial correlation between these variables (Eq. S6 in the Supplement). The spatial correlation ofσd,i de-pends on the availability of input data for the model and on spatial aggregation (Table S3 in the Supplement). However, the spatial correlation ofσv,i could not be assessed analyti-cally because it was a result of model fallacy and errors in measurements. In the case of a strong correlation ofσv,i val-ues, the aggregatedσv2will account for a large proportion of σT2(right side in Fig. 8). However, if the spatial correlation is confined to a short distance, such as less than four grids (Dormann et al., 2007; Dray et al., 2006), the contribution of σv2toσT2 will be negligible (left side in Fig. 8). At the mid-point ofDC(Eq. S6, 30 grids, equal to 300 km), as shown in
Fig. 8, the model uncertainty (σr2+σv2)accounted for 56.6 %
∗Numbers in parentheses represent the range ofU
vdepending on the spatial correlation of the model simulation residuals. Long-distance correlation results in a large aggregatedUv, whereas short-distance correlation results in a small aggregatedUv.
4.2 Consistency of errors between model validation and model upscaling
Upscaling a site-scale model (e.g., CH4MOD in this study) to a national scale poses enormous challenges when data are scarce. Enhancing the spatial abundance of the input data minimizes the propagation of data error into the ag-gregated uncertainties. Many environmental and agricultural factors impact methane emissions from rice paddies. In the CH4MOD model, the key factors were parameterized as model inputs (Huang et al., 2004). However, when assess-ing the uncertainty of a model, the explanatory variables are arbitrarily included (Verburg et al., 2006). Li et al. (2004) found that soil properties were the “most sensitive factor” and therefore used this parameter in the uncertainty analysis. The inclusion of as many of the highly sensitive key factors as possible in the uncertainty analysis should generate more accurate and reliable results (right part in Fig. 2).
Experimental field studies have shown that the rice vari-ety has substantial impacts on methane emissions (Aulakh et al., 2008; Inubushi et al., 2011; Jia et al., 2002). A study of field observations (Su et al., 2015) showed that transfer of the barley geneSUSIBA2to rice favors the allocation of photosynthates to the aboveground biomass over allocation to the roots. Moreover, less biomass allocation to root exu-dates results in reduced methane emissions. The impact that the rice variety has on methane emissions was parameter-ized as the variety index (VI) in CH4MOD. According to Huang et al. (1998), VI ranges from 0.5 to 1.5 and averages 1.0 for most rice varieties. To validate the CH4MOD model (left portion of Fig. 2) using the 495 methane emission mea-surements included in the present study, VI was assigned a default value of 1.0 regardless of the rice variety because until now no dedicated attempts were made to quantify the VI of different rice varieties. Therefore, the rb andrv
val-ues presented in Table 2 incorporate the uncertainty in model performance that can be attributed to different rice varieties (Mf(x)in Eq. S6 of the Supplement). To maintain
consis-tency, VI was assigned the same default value (1.0) when the model was scaled-up to the national scale (right side of Fig. 2), and no PDF was built for the uncertainty
calcula-tion conducted with the Monte Carlo simulacalcula-tion. If a PDF had been incorporated into the uncertainty calculation when the model was scaled-up, the overall uncertainties (Table 4) would have been overestimated. However, if different VI val-ues were assigned to rice varieties during model validation, the error caused by the inaccuracy of VI would also need to be considered during the scaling-up of the model to prevent underestimation of the overall uncertainty.
5 Conclusion
Due to the remarkable spatial variation in rice paddy methane emissions, the uncertainties in national estimates obtained ei-ther through field measurements or modeling remain consid-erably large. For field measurements, the reduction in uncer-tainty achieved by increasing the number of observations was shown to be inversely related to the spatial correlation be-tween the measurements. To reduce the estimation bias, the number of measured emission fluxes should be proportional to the paddy area where the corresponding agronomic activ-ities and environmental conditions occur homogenously.
Model performance depends not only on the effectiveness of the models themselves but also on the availability of the data needed to drive the model. We found that without a suf-ficient quantity of high-quality data, a well-developed model may perform even more poorly than simple regression ap-proaches. When modeling methane emissions, uncertainties in the performance of the model remain the major obstacle to reliably estimating methane emissions. Estimate uncer-tainty could be reduced at the national scale by increasing the availability of input data and decreasing spatial correla-tions among the residues of the model output.
Modeled by CH4MOD with all the available data, the na-tional methane emission from rice paddies was 6.43 (3.79– 9.77) Tg CH4yr−1in China. Compared to other options,
6 Data availability
The data of LUCC (land use and land cover change) were acquired from the Data Center for Resources and Environ-mental Sciences, Chinese Academy of Sciences (RESDC) (http://www.resdc.cn/data.aspx?DATAID=98). The climate data were provided by the Meteorological Data Service Cen-ter, Chinese Meteorological Administration (http://data.cma. cn/data/detail/dataCode/A.0029.0001.html). The data of rice cultivation (rice harvesting area and production) were re-trieved from the agricultural yearbooks of China published annually by the China Agriculture Press. The dataset of soil properties is available at http://www.resdc.cn/data.aspx? DATAID=146, with the copyright dedicated to the Institute of Soil Sciences, CAS.
The Supplement related to this article is available online at doi:10.5194/bg-14-163-2017-supplement.
Acknowledgements. The study was jointly supported by the Na-tional Natural Science Foundation of China (Grant No. 41573069, 31370492, 41321064).We greatly appreciate the helpful comments and suggestions from the two anonymous reviewers.
Edited by: P. van Bodegom
Reviewed by: two anonymous referees
References
Aulakh, M., Wassmann, R., and Rennenberg, H.: Pattern and amount of aerenchyma relate to variable methane transport ca-pacity of different rice cultivars, Plant Biol., 2, 182–194, 2008. Bachelet, D. and Neue, H.: Methane emissions from wetland rice
areas of Asia, Chemosphere, 26, 219–237, 1993.
Bachelet, D., Kern, J., and Toelg, M.: Balancing the rice carbon budget in China using spatially-distributed data, Ecol. Model., 79, 167–177, 1995.
Banger, K., Tian, H., and Lu, C.: Do nitrogen fertilizers stimulate or inhibit methane emissions from rice fields?, Glob. Change Biol., 18, 3259–3267, 2012.
Bhatia, A., Ghosh, A., Kumar, V., Tomer, R., Singh, S., and Pathak, H.: Effect of elevated tropospheric ozone on methane and nitrous oxide emission from rice soil in north India, Agr. Ecosyst. Envi-ron., 144, 21–28, 2011.
Bodelier, P. L. E. and Laanbroek, H. J.: Nitrogen as a regulatory factor of methane oxidation in soils and sediments, FEMS Mi-crobiol. Ecol., 47, 265–277, 2006.
Butenhoff, C., Frolking, S., Li, C., Houweling, S., Milliman, T., Khalil, A., and Zhuang, Q.: Intercomparison of models to es-timate methane emissions from rice agriculture using common data sets, 283, AGU Fall Meeting, 2009.
Butterbach-Bahl, K., Papen, H., and Rennenberg, H.: Impact of gas transport through rice cultivars on methane emission from rice paddy fields, Plant Cell Environ., 20, 1175–1183, 1997. Cai, Z., Tsuruta, H., Gao, M., Xu, H., and Wei, C.: Options for
mit-igating methane emission from a permanently flooded rice field, Glob. Change Biol., 9, 37–45, 2003.
Cao, M., Dent, J., and Heal, O.: Modeling methane emissions from rice paddies, Global Biogeochem. Cy., 9, 183–195, 1995. Cao, M., Gregson, K., Marshall, S., Dent, J., and Heal, O.: Global
methane emissions from rice paddies, Chemosphere, 33, 879– 897, 1996.
CFPC: Datasets of China Pollution Source Census, China Environ-mental Sciences Press, Beijing, China, 2011.
Chen, H., Zhu, Q. A., Peng, C., Wu, N., Wang, Y., Fang, X., Jiang, H., Xiang, W., Chang, J., and Deng, X.: Methane emissions from rice paddies natural wetlands, and lakes in China: synthesis and new estimate, Glob. Change Biol., 19, 19–32, 2013.
Conrad, R., Klose, M., Noll, M., Kemnitz, D., and Bodelier, P. L. E.: Soil type links microbial colonization of rice roots to methane emission, Glob. Change Biol., 14, 657–669, 2007.
Dijkstra, F. A., Prior, S. A., Runion, G. B., Torbert, H. A., Tian, H., Lu, C., and Venterea, R. T.: Effects of elevated carbon dioxide and increased temperature on methane and nitrous oxide fluxes: Evidence from field experiments, Front. Ecol. Environ., 10, 520– 527, 2012
Ding, A., Willis, C., Sass, R., and Fisher, F.: Methane emissions from rice fields: effect of plant height among several rice culti-vars, Global Biogeochem. Cy., 13, 1045–1052, 1999.
Dormann, F. C., M McPherson, J., B Araújo, M., Bivand, R., Bol-liger, J., Carl, G., Davies, R., Hirzel, A., Jetz, W., and Daniel Kissling, W.: Methods to account for spatial autocorrelation in the analysis of species distributional data: a review, Ecography, 30, 609–628, 2007.
Dray, S., Legendre, P., and Peres-Neto, P. R.: Spatial modelling: a comprehensive framework for principal coordinate analysis of neighbour matrices (PCNM), Ecol. Model., 196, 483–493, 2006. EBCAY: China Agriculture Yearbook, China Agriculture Press,
Beijing, China, 2006.
Gao, L. and Li, L.: Rice Meteorology and Ecology, China Agricul-ture Press, Beijing, 1992 (in Chinese).
Gao, X. Z., Ma, W. Q., Ma, C. B., Zhang, F. S., and Wang, Y. H.: Analysis on the current status of utilization of crop straw in China, J. Huazhong Agr. Univ., 21, 242–247, 2002 (in Chinese with English abstract).
Gauci, V., Dise, N. B., Howell, G., and Jenkins, M. E.: Suppression of rice methane emission by sulfate deposi-tion in simulated acid rain, J. Geophys. Res., 113, G00A07, doi:10.1029/2007JG000501, 2008.
Gaunt, J., Grant, I., Neue, H., Bragais, J., and Giller, K.: Soil char-acteristics that regulate soil reduction and methane production in wetland rice soils, Soil Sci. Soc. Am. J., 61, 1526–1531, 1997. Goovaerts, P.: Geostatistical modelling of uncertainty in soil
sci-ence, Geoderma, 103, 3–26, 2001.
Inubushi, K., Cheng, W., Mizuno, T., Lou, Y., Hasegawa, T., Sakai, H., and Kobayashi, K.: Microbial biomass carbon and methane oxidation influenced by rice cultivars and elevated CO2 in a
Japanese paddy soil, Eur. J. Soil Sci., 62, 69–73, 2011.
IPCC (The Intergovernmental Panel on Climate Change): 2006 IPCC Guidelines for National Greenhouse Gas Inventories, pre-pared by: National Greenhouse Gas Inventories Programme, edited by: Eggleston, H. S., Buendia, L., Miwa, K., Ngara, T., and Tanabe K., Institute for Global Environmental Strategies (IGES), Japan, 2006.
Ito, A. and Inatomi, M.: Use of a process-based model for assessing the methane budgets of global terrestrial ecosystems and evalua-tion of uncertainty, Biogeosciences, 9, 759–773, doi:10.5194/bg-9-759-2012, 2012.
Jia, Z., Cai, Z., Xu, H., and Tsuruta, H.: Effects of rice cultivars on methane fluxes in a paddy soil, Nutr. Cycl. Agroecosys., 64, 87–94, 2002.
Kennedy, M. C. and O’Hagan, A.: Bayesian calibration of computer models, J. R. Stat. Soc. B Met., 63, 425–464, 2001
Kern, J., Bachelet, D., and Tölg, M.: Organic matter inputs and methane emissions from soils in major rice growing regions of China, in: Soils and Global Change, edited by: Lal, R., Kimble, J., Levine, E., and Stewart, B. A., Advances in Soil Science, CRC Lewis Publishers, Boca Raton, 189–198, 1995.
Kern, J. S., Zitong, G., Ganlin, Z., Huizhen, Z., and Guobao, L.: Spatial analysis of methane emissions from paddy soils in China and the potential for emissions reduction, Nutr. Cycl. Agroe-cosys., 49, 181–195, 1997.
Khalil, M., Rasmussen, R., Wang, M. X., and Ren, L.: Methane emissions from rice fields in China, Environ. Sci. Technol., 25, 979–981, 1991.
Khalil, M., Shearer, M., and Rasmussen, R.: Methane sources in China: historical and current emissions, Chemosphere, 26, 127– 142, 1993.
Khosa, M. K., Sidhu, B., and Benbi, D.: Methane emission from rice fields in relation to management of irrigation water, J. Environ. Biol., 32, 169–172, 2011.
Legendre, P.: Spatial autocorrelation: trouble or new paradigm?, Ecology, 74, 1659–1673, 1993.
Li, C.: Modeling trace gas emissions from agricultural ecosystems, Nutr. Cycl. Agroecosys., 58, 259–276, 2000.
Li, C., Qiu, J., Frolking, S., Xiao, X., Salas, W., Moore III, B., Boles, S., Huang, Y., and Sass, R.: Reduced methane emis-sions from large-scale changes in water management of China’s rice paddies during 1980–2000, Geophys. Res. Lett., 29, 1972, doi:10.1029/2002GL015370, 2002.
Li, C., Mosier, A., Wassmann, R., Cai, Z., Zheng, X., Huang, Y., Tsuruta, H., Boonjawat, J., and Lantin, R.: Modeling green-house gas emissions from rice-based production systems:
sen-Liu, T. L., Juang, K. W., and Lee, D. Y.: Interpolating soil proper-ties using kriging combined with categorical information of soil maps, Soil Sci. Soc. Am. J., 70, 1200–1209, 2006.
Ma, X., Zhu, B., Du, D., and Zheng, X.: CH4, CO2and N2O
emis-sions from the year-round flooded paddy field at fallow season, Journal of Agro-Environment Science, 24, 1199–1202, 2005 (in Chinese with English abstract).
Mao, L.: Irrigation in Rice Paddies, China Agricultural Press, Bei-jing, 1981 (in Chinese).
Matthews, E., Fung, I., and Lerner, J.: Methane emission from rice cultivation: geographic and seasonal distribution of cultivated ar-eas and emissions, Global Biogeochem. Cy., 5, 3–24, 1991. Matthews, R., Wassmann, R., and Arah, J.: Using a crop/soil
sim-ulation model and GIS techniques to assess methane emissions from rice fields in Asia. I. Model development, Methane Emis-sions from Major Rice Ecosystems in Asia, Nutr. Cycl. Agroe-cosys., 58, 141–159, 2001.
MWRUC (Ministry of Water Resources and Utilization of China): National Program for Conservation of Irrigation Water in Chi-nese Agriculture, in: Division of Rural Water Resources and Uti-lization, China Agriculture Press, Biejing, China, 1996 (in Chi-nese).
Mishra, S., Rath, A., Adhya, T., Rao, V., and Sethunathan, N.: Ef-fect of continuous and alternate water regimes on methane ef-flux from rice under greenhouse conditions, Biol. Fert. Soils, 24, 399–405, 1997.
Neue, H., Becker-Heidmann, P., and Scharpenseel, H.: Organic mat-ter dynamics, soil properties, and cultural practices in rice lands and their relationship to methane production, in: Soils and the greenhouse effect, edited by: Bouwman, A. F., Wiley, Chichester, 457–466, 1990.
Oberthür, T., Goovaerts, P., and Dobermann, A.: Mapping soil tex-ture classes using field textuing, particle size distribution and lo-cal knowledge by both conventional and geostatisilo-cal methods, Eur. J. Soil Sci., 50, 457–479, 1999.
Ogle, S. M., Breidt, F., Easter, M., Williams, S., Killian, K., and Paustian, K.: Scale and uncertainty in modeled soil organic carbon stock changes for US croplands using a process-based model, Glob. Change Biol., 16, 810–822, 2010.
Penman, J.: Good practice guidance and uncertainty management in national greenhouse gas inventories, Institute for Global Envi-ronmental Strategies (IGES) for the IPCC, Japan, 2000. Ren, W., Tian, H., Xu, X., Liu, M., Lu, C., Chen, G., Melillo, J.,
Reilly, J., and Liu, J.: Spatial and temporal patterns of CO2and
CH4fluxes in China’s croplands in response to multifactor
envi-ronmental changes, Tellus B, 63, 222–240, 2011.
methane emissions from rice fields: a review through a meta-analysis, Environ. Eng. Sci., 29, 1053–1062, 2012.
Sass, R., Fisher, F., Turner, F., and Jund, M.: Methane emission from rice fields as influenced by solar radiation, temperature, and straw incorporation, Global Biogeochem. Cy., 5, 335–350, 1991. Sass, R., Fisher, F., Wang, Y., Turner, F., and Jund, M.: Methane
emission from rice fields: the effect of floodwater management, Global Biogeochem. Cy., 6, 249–249, 1992.
Sass, R., Fisher, F., Lewis, S., Jund, M., and Turner, F.: Methane emissions from rice fields: effect of soil properties, Global Bio-geochem. Cy., 8, 135–140, 1994.
Sass, R., Fisher Jr., F., Ding, A., and Huang, Y.: Exchange of methane from rice fields: national, regional, and global budgets, J. Geophys. Res., 104, 26943–26951, 1999.
Sass, R. L. and Fisher, F. M.: Methane emissions from rice paddies: a process study summary, Nutr. Cycl. Agroecosys., 49, 119–127, 1997.
Shi, X., Yu, D., Warner, E., Pan, X., Petersen, G., Gong, Z., and Weindorf, D.: Soil database of 1 : 1,000,000 digital soil survey and reference system of the Chinese genetic soil classification system, Soil Survey Horizons, 45, 129–136, 2004.
Singh, A. and Dubey, S. K.: Temporal variation in methanogenic community structure and methane production potential of tropi-cal rice ecosystem, Soil Biol. Biochem., 48, 162–166, 2012. Smith, P., Martino, D., Cai, Z., Gwary, D., Janzen, H., Kumar, P.,
McCarl, B., Ogle, S., O’Mara, F., and Rice, C.: Greenhouse gas mitigation in agriculture, Philos. T. R. Soc. B, 363, 789–813, 2008.
Su, J., Hu, C., Yan, X., Jin, Y., Chen, Z., Guan, Q., Wang, Y., Zhong, D., Jansson, C., and Wang, F.: Expression of barley SUSIBA2 transcription factor yields high-starch low-methane rice, Nature, 523, 602–606, 2015.
Taylor, J. A., Brasseur, G., Zimmerman, P., and Cicerone, R.: A study of the sources and sinks of methane and methyl chloroform using a global three-dimensional Lagrangian tropospheric tracer transport model, J. Geophys. Res., 96, 3013–3044, 1991. Thornton, P. E., Running, S. W., and White, M. A.: Generating
sur-faces of daily meteorological variables over large regions of com-plex terrain, J. Hydrol., 190, 214–251, 1997.
Tian, H. Q., Lu, C. Q., Ciais, P., Michalak, A. M., Canadell, J. G., Saikawa, E., Huntzinger, D. N., Gurney, K. R., Sitch, S., Zhang, B., Yang, J., Bousquet, P., Bruhwiler, L., Chen, G., Dlugokencky, E., Friedlingstein, P., Melillo, J., Pan, S., Poulter, B., Prinn, R., Saunois, M., Schwalm, C. R., and Wofsy, S. C.: The terrestrial biosphere as a net source of greenhouse gases to the atmosphere, Nature, 531, 225–228, 2016.
Van Bodegom, P., Wassmann, R., and Metra-Corton, T.: A process-based model for methane emission predictions from flooded rice paddies, Global Biogeochem. Cy., 15, 247–263, 2001.
Van Bodegom, P., Verburg, P. H., and van der Gon, H. A. C. D.: Upscaling methane emissions from rice paddies: prob-lems and possibilities, Global Biogeochem. Cy., 16, 1014, doi:10.1029/2000GB001381, 2002a.
Van Bodegom, P. M., Verburg, P. H., Stein, A., Adiningsih, S., and Denier Van Der Gon, H. A. C.: Effects of interpolation and data resolution on methane emission estimates from rice paddies, En-viron. Ecol. Stat., 9, 5–26, 2002b.
Verburg, P. H., van Bodegom, P. M., van der Gon, H. A. C. D., Bergsma, A., and van Breemen, N.: Upscaling regional emis-sions of greenhouse gases from rice cultivation: methods and sources of uncertainty, Plant Ecol., 182, 89–106, 2006.
Watanabe, A., Kajiwara, M., Tashiro, T., and Kimura, M.: Influence of rice cultivar on methane emission from paddy fields, Plant Soil, 176, 51–56, 1995.
Wei, H. P.: Statistical analysis of methane emissions from Chinese rice paddies from 1987 to 2010, Master, College of Resources and Environmental Sciences, Nanjing Agricultural University, Nanjing, China, 65 pp., 2012.
Weller, S., Janz, B., Jörg,L., Kraus, D., Racela, H. S., Wassmann, R., Butterbach-Bahl, K., and Kiese R.: Greenhouse gas emis-sions and global warming potential of traditional and diversified tropical rice rotation systems, Glob. Change Biol., 22, 432–448, 2016.
Xie, B., Zheng, X., Zhou, Z., Gu, J., Zhu, B., Chen, X., Shi, Y., Wang, Y., Zhao, Z., and Liu, C.: Effects of nitrogen fertilizer on CH4emission from rice fields: multi-site field observations, Plant Soil, 326, 393–401, 2010a.
Xie, B. H., Zhou, Z. X., Zheng, X. H., Zhang, W., and Zhu, J. G.: Modeling methane emissions from paddy rice fields under ele-vated atmospheric carbon dioxide conditions, Adv. Atmos. Sci., 27, 100–114, 2010b.
Xie, G. H., Wang, X. Y., and Ren, L. T.: China’s crop residues re-sources evaluation, Chinese J. Biotechn., 26, 855–863, 2010c (in Chinese with English abstract).
Xiong, Z., Cai, H., Min, S., and Li, B.: Rice in China, China Agri-cultural Science and Technology Press, Beijing, 1992 (in Chi-nese).
Yagi, K., Tsuruta, H., and Minami, K.: Possible options for mitigat-ing methane emission from rice cultivation, Nutr. Cycl. Agroe-cosys., 49, 213–220, 1997.
Yan, X., Yagi, K., Akiyama, H., and Akimoto, H.: Statistical analy-sis of the major variables controlling methane emission from rice fields, Glob. Change Biol., 11, 1131–1141, 2005.
Yao, H., Conrad, R., Wassmann, R., and Neue, H.: Effect of soil characteristics on sequential reduction and methane production in sixteen rice paddy soils from China, the Philippines, and Italy, Biogeochemistry, 47, 269–295, 1999.
Zhan, M., Cao, C., Wang, J., Jiang, Y., Cai, M., Yue, L., and Shahrear, A.: Dynamics of methane emission, active soil organic carbon and their relationships in wetland integrated rice-duck systems in Southern China, Nutr. Cycl. Agroecosys., 89, 1–13, 2011.
Zhang, B. W., Tian, H. Q., Ren, W., Tao, B., Lu, C. Q., Yang, J., Banger, K., Pan, S. F.: Methane emission from global rice fields: Magnitude, Spatiotemporal patterns, and environ-mental controls, Global Biogeochem. Cy., 30, 1246–1263, doi:10.1002/2016GB005381, 2016.