Abstract—Micro electromechanical systems (MEMS) are small integrated 3-D devices fabricated mostly on a silicon substrate ranging from sub micron level to millimeter level that combine electrical and mechanical components. Due to their reduced size there can be any number of these devices, from a few to millions, in a particular system. MEMS extend the fabrication techniques developed for the integrated circuit industry to add mechanical components such as beams and diaphragms to devices. The special feature of a smart MEMS sensor is the ability to integrate sensing, controlling and actuating functions on a single chip. In this paper various factors which play a critical role in the performance of a MEMS pressure sensor are discussed. The design of the diaphragm is vital for the efficiency of the sensor. The dimensions of the diaphragm like length, radius, thickness and shape are taken into consideration and the effects of variations in pressure on the geometry of the sensing element are discussed using the Weka data mining tool.
Index Terms— Diaphragm design, MEMS pressure sensors, WEKA tool.
I. INTRODUCTION
ICRO pressure sensors are used to monitor and measure pressure in various environments. A wide variety of differential, gauge, and absolute pressure micro sensors based on different transduction principles have been developed using MEMS technology.
MEMS pressure sensors work on the principle of mechanical bending of thin silicon diaphragm by the contact medium like gases, fluids etc. Over the last decade, silicon micro machined pressure sensors have undergone considerable research and growth. The diaphragm is the key sensing component of a MEMS pressure sensor and hence the realization of a high-performance diaphragm is crucial to the efficiency of the sensor. The geometry and dimensions of the diaphragm have to be properly selected for the optimal performance of the sensor. It is therefore important to analyze the relationships among diaphragm thickness, side length, radius and pressure to set the design rules for micro pressure sensors. In order to get high sensitivity, the
Manuscript received February 24, 2011; revised April 10, 2011. K .Y Madhavi is with Department of Physics, Maharani Science College for Women Bangalore, India (phone:080-22262796; fax: 91-080-22262796; e-mail: [email protected]
Dr M. Krishna is with the Research and Developmrnt Department, R.V.College of Engineering Bangalore India, (e-mail: [email protected] )
Dr Sumithradevi K A and Dr Andhe Dharani are with Department of
MCA R.V.College of Engineering Bangalore India (e-mail: . [email protected] and [email protected]).
.
diaphragm thickness should be thin to maximize the load-deflection responses. On the other hand, thin diaphragm under high pressure may result in large deflection and nonlinear effects that are not desirable [1]
II. WEKA DATA MINING TOOL
Weka is a collection of machine learning algorithms for data mining tasks. The algorithms can either be applied directly to a dataset or called from your own Java code. Weka contains tools for data pre-processing, classification, regression, clustering, association rules, and visualization. It is also well-suited for developing new machine learning schemes. Weka is open source software issued under the GNU General Public License [2].
The Weka GUI Chooser provides a starting point for launching Weka’s main GUI applications and supporting tools .The GUI Chooser consists of four buttons one for each of the four major Weka applications and four menus[3]. Explorer- An environment for exploring data with Weka Experimenter- An environment for performing experiments and conducting statistical tests between learning schemes. Knowledge Flow- This supports essentially the same functions as the Explorer but with a drag-and-drop interface. One advantage is that it supports incremental learning. Simple CLI -Provides a simple command-line interface that allows direct execution of WEKA commands for operating systems that do not provide their own command line interface. Using the Explorer it is possible to
Preprocess: Choose and modify the data being acted on. Classify: Train and test learning schemes that classify or perform regression [3].
A. Square Diaphragms
As far as the induced stress for a given pressure is concerned the square diaphragm has the highest induced stress hence it is the preferred geometry for pressure sensors because the high stresses generated by applied pressure loading result in high sensitivity. Also it is easy to dice the diaphragm from standard wafers [4].
Diaphragm Design for MEMS Pressure Sensors
using a Data Mining Tool
K. Y. Madhavi, Sumithradevi.K.A, M Krishna , Andhe Dharani Member, IAENG
M
Proceedings of the World Congress on Engineering 2011 Vol II WCE 2011, July 6 - 8, 2011, London, U.K.
ISBN: 978-988-19251-4-5
ISSN: 2078-0958 (Print); ISSN: 2078-0966 (Online)
For a square plate clamped at the edges: The maximum stress at the middle of each edge
(1) The maximum deflection for a given pressure is
Wmax (2)
Where p is the applied pressure, a the side length, h the diaphragm’s thickness and E the Young’s modulus [5]. Assuming a maximum stress of 7000MPa the yield strength of silicon a thickness of 15µm and a Young’s modulus of 180GPa the side length for different pressures is calculated as shown in Table1.The relationship between Pressure, side length, and maximum deflection can be analyzed using the Weka tool.
TABLE I
SIDE LENGTH & MAXIMUM DEFLECTION FOR DIFFERENT PRESSURES IN A SQUARE DIAPHRAGM
Pressure in MPa
Side length in µm
Max Deflection
in µm
20 505.64 29.69
50 319.79 11.87
100 226.13 5.93
150 184.63 3.95
200 159.89 2.97
250 143.00 2.37
300 130.55 1.98
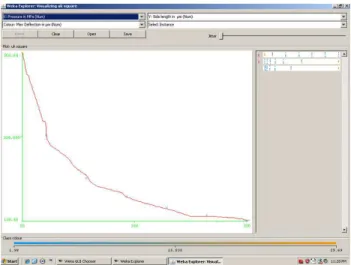
Fig. 1. Maximum deflection of the diaphragm in micrometers as a function of pressure in MPa.
From Fig.1 it can be seen that as pressure increases the maximum deflection decreases in a nonlinear fashion. The side length exhibits a nearly linear relationship with maximum deflection as seen in Fig.2 and according to Fig.3 as the pressure increases the length of the diaphragm decreases nonlinearly. Hence for greater pressures smaller plates are required.
B. Circular Diaphragm
The circular diaphragm has the lowest stress on its edges when applying the same pressure as on a square diaphragm, but the largest centre deflection can be seen in circular diaphragm. So, in applications which maximum deflection plays the prime role the circular diaphragm is suggested. The circular diaphragm is most favored from design engineering point of view.
For the case of a clamped circular plate with small deflections the form of deflection is [6]
Fig. 2. Maximum deflection of the diaphragm in micrometers as a function of side length in micrometers.
.
Fig. 3. Side length of the diaphragm in micrometers as a function of Pressure in MPa.
Proceedings of the World Congress on Engineering 2011 Vol II WCE 2011, July 6 - 8, 2011, London, U.K.
ISBN: 978-988-19251-4-5
ISSN: 2078-0958 (Print); ISSN: 2078-0966 (Online)
(3)
Where, r, a, and P are the deflection, radial distance from the centre of the diaphragm, diaphragm radius, and applied pressure, respectively. D is the flexural rigidity, given by
(4) The maximum deflection at the center of the plate is:
wmax
=
(5) The maximum stress in the membrane is given as:max
=
=
=
=
(6) Where E, h, and are the Young’s modulus, thickness, and Poisson’s ratio, respectively of the diaphragm. From the above equations it is clear that the total deflection is directly proportional to the applied pressure. However, for diaphragms which have a high in built stress or large deflections exhibit a nonlinear proportion. It is preferable to use a deflection measurement system which varies linearly with pressure for better calibration and accurate measurement [7]. The maximum deflection at full scale is chosen such that the maximum deflection does not exceed 25-30% of the capacitance gap. Assuming a membrane thickness of 15 m and capacitor gap of 1.5 m and a maximum deflection of 0.4 m the radius of a pressure sensor for different pressures can be calculated using
(7)
Where E= 169GPa and = 0.22
Table 2 shows the radius and maximum induced stress for different given pressures.
TABLE II
RADIUS AND MAXIMUM STRESS FOR DIFFERENT PRESSURES IN A CIRCULAR DIAPHRAGM
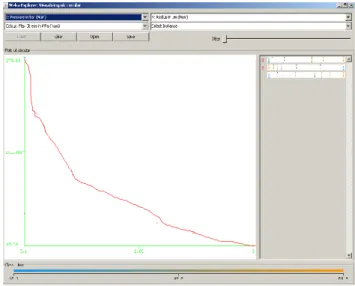
From the plots obtained using Weka tool it can be seen that the radius of the diaphragm decreases in a nonlinear
manner with increasing pressure as in Fig.5. From Fig.4 we can see that the induced stress bears a direct proportion with applied pressure and from Fig.6 it is evident that as the radius of the device decreases the induced stress increases in a non linear manner.
III. CONCLUSION
The relationships between the different dimensions of a square and circular diaphragm have been analyzed using the Weka tool. According to this as the pressure increases the size of the membrane has to become smaller. For the square diaphragm the maximum deflection decreases as pressure increases and for the circular membrane the maximum stress decreases as radius increases thus leading to the fact that smaller diaphragms show greater sensitivity.
Pressure in Bar
Radius in µm Max Stress in MPa
0.1 178.68 18.1
0.2 150.25 25.6
0.5 119.49 40.5
0.1 100.48 57.2
1.2 96.00 62.7
1.5 90.79 70.1
2 84.49 80.9
Fig. 4. Maximum stress in MPa of the diaphragm as a function of Pressure in Bar.
Fig. 5. Radius of the diaphragm in micrometers as a function of Pressure in Bar.
Proceedings of the World Congress on Engineering 2011 Vol II WCE 2011, July 6 - 8, 2011, London, U.K.
ISBN: 978-988-19251-4-5
ISSN: 2078-0958 (Print); ISSN: 2078-0966 (Online)
REFERENCES
[1] Xiaodong Wanga, Baoqing Lia, Onofrio L. Russoa, Harry T. Romanb, Ken K. China, Kenneth R. Farmera “Diaphragm design guidelines and an optical pressure sensor based on MEMS technique” Microelectronics Journal 37 ,50–56, 2006
[2] www.waikato.ac.nz
[3] WEKA Manual for Version 3-7-3
[4] Tai Ran Hsu “Mems and Microsystems” Tata McGraw-Hill 2002 [5] Timoshenko S and Woinosky-Krieger S “Theory of Plates and
Shells” 1987
[6] W.C. Young and R. G.Budynas “Roark’s formulas for stress and strain” by (Mc Graw Hill)
[7] W.P.Eaton and J.H.Smith “Micromachined pressure sensors: Review and recent developments” Smart Mater. Struct. 6 (1997) 530–539 Fig. 6. Maximum stress in the diaphragm in MPa as a function of Radius in micrometers.
Proceedings of the World Congress on Engineering 2011 Vol II WCE 2011, July 6 - 8, 2011, London, U.K.
ISBN: 978-988-19251-4-5
ISSN: 2078-0958 (Print); ISSN: 2078-0966 (Online)