Analysis of mandibular dimensions growth
at different fetal ages
Rafael Souza Mota*, Vinícius Antônio Coelho Cardoso*, Cristiane de Souza Bechara*, João Gustavo Corrêa Reis**, Sérgio Murta Maciel***
Objective: To investigate growth asymmetry between the left and right hemimandibles (HMs) during the 2nd and early 3rd trimester of pregnancy. Methods: Sixty eight hemi-mandibles (34 hemi-mandibles) of fetuses were used—20 female and 14 male—preserved in 10% formalin solution, and the following measurements were performed: Condyle-Cor-onoid Process (Co-CP), Gonion-CorCondyle-Cor-onoid Process (Go-CP), Gonion-Gnathion (Go-Gn), Condyle-Gnathion (Co-Gn), Symphyseal Height (SH), Mandibular Angle (MA). The data were collected, tabulated and analyzed with the aid of SPSS software, version 11.0, 2005. One-way ANOVA test was performed to compare the mean values of anatomical measure-ments of the right and left HMs. Gestational ages were divided into second trimester (Pe-riod 1: 13-18 weeks and Pe(Pe-riod 2: 18-24 weeks), and early third trimester (Pe(Pe-riod 3: 24-30 weeks) of pregnancy. Results: We noted a slight growth rate asymmetry in Go-Gn, Co-CP, Co-Gn, Go-CP and SH, comparing the left and right mandibular halves, between the 2nd and early 3rd trimester of pregnancy, although not statistically significant (p > 0.05). It was also found that the mandibular angle decreased and showed a slight—though statistically significant (p < 0.05)—asymmetry in the same prenatal period. Conclusion: The authors concluded that there was a slight asymmetry in the growth rate of measurements Go-Gn, Co-CP, Co-Gn, Go-CP and SH, comparing the left with the right hemimandible between the 2nd and early 3rd trimester of gestation.
Abstract
Keywords: Growth. Mandible. Fetus.
* Medicine graduate, Juiz de Fora Federal University - Physician.
** MSc in Morphology, Rio de Janeiro Federal University (UFRJ) - Physician (Otolaryngologist).
INTRODUCTION
The mandible appears in adults as a single bone. However, various portions or subunits are found during its development process: the body of the mandible, to which the alveolar portion is attached, the condylar and coronoid processes, mandibular angles and mentum.3
The facial development process begins from the first and second pharyngeal arches during the fourth week of gestation.9 Proffit10 asserted
that the first pharyngeal arch, also called man-dibular arch, gives rise to tissues that will de-velop in the masticatory muscles and mandible. The mandibular arch houses Meckel’s cartilage, which is responsible for its support. The man-dibular body originates in the anterior portion of Meckel’s cartilage from the intramembranous ossification of the ventral portion of the first branchial arch. The mandibular condyle, in turn, starts its development from a secondary carti-lage, which is covered with a fibrous capsule.10
According to Moyers,9 mandibular dimensions
show different growth patterns during the pre-natal period and after birth.
It was long believed that the condyle was the center of mandibular growth.3 With the advent
of Functional Matrix Theory, however, a num-ber of theories emerged addressing bone struc-ture growth and development.8 The condyle
undoubtedly plays a major role in mandibular growth but it is not alone since mandibular growth is a complex process that cannot be ex-plained away in simplistic terms.3
Research on fetal mandibular growth basi-cally correlates the development of mandibular structures with fetus age.1,4,5,16
In his study, Mandarim et al6 provided a
straightforward and accurate method for clas-sifying fetal age. Once the values of certain parameters are known—such as growth of ce-phalic module, greater foot length, crown-rump length, and weight—it is possible to determine fetal age. They used a table initially proposed by
Streeter,17 which was perfected by the authors
and helps determine such an age in weeks post conception with reasonable approximation.6
The work of Mandarim et al6 was rectified
and showed a correlation between foot length and the growth in crown-rump length.14
Studying the mandible during the prenatal period is critical for the evaluation and diagno-sis of congenital anomalies of the face, whereas mandibular abnormalities may be associated with several syndromes.1,4,5,7,12 Thus, data from
this study may contribute to a better under-standing of the process of formation and devel-opment of the facial skeleton.13
The purpose of this study is to provide a comparison between different anatomical di-mensions of the right and left hemimandibles (HMs) during the second and early third trimes-ter of pregnancy.
Ultrasound methods, when used to assess mandibular growth structures and for the diag-nosis of fetal malformations such as microgna-thia and macrognamicrogna-thia, establish evaluation cri-teria for the diagnosis of mandibular anomalies in uterus, which allows early diagnosis and the choice of a suitable therapy.12 Research has
em-phasized that any structural changes in mandibu-lar cartilage during the prenatal period are more intimately related to local mechanical factors and articulation than to bone growth per se.12
The functions exerted by the masseter and temporal muscles induce mandibular growth during the 11th week.1
MATERIAL AND METHODS
Gestational age ranged from 13 to 30 weeks post-conception (WPC) and was estimated on the basis of greatest foot length and weight, ac-cording to protocol5,6,16 (Table 1).
After the fetal age had been estimated, the mandibles were dissected, disjointed and im-mersed in a plastic 50 x 50 x 80 cm wash tub containing water. The technique of natural run-ning water maceration was utilized.12 It took a
period of 6 weeks for the complete removal of
the soft tissues, including the periosteum, for better visualization of the anatomical landmarks chosen for analysis. After this process, the follow-ing measurements5 were performed (Fig 1):
1. Condyle-Coronoid Process (Co-CP): Dis-tance between the posterior-most point on the condylar process and the anterior-most point on the coronoid process.
2. Gonion-Coronoid Process (Go-CP): Dis-tance between the gonion and the upper-most
AGE
(WPC) GENDER
WEIGHT (g)
GREATER FOOT LENGTH (mm)
Co-CP (cm)
Go-CP (cm)
SH (cm)
Go-Gn (cm)
Co-Gn
(cm) MA HM
13.4 F 68.2 18 0.555 0.755 0.425 1.115 1.765 148° R
0.565 0.775 0.400 1.100 1.725 153° L
13.7 M 61.5 19 0.575 0.710 0.365 1.055 1.685 157° R
0.525 0.715 0.365 1.075 1.645 140° L
13.7 M 75.2 19 0.545 0.800 0.415 1.055 1.825 153° R
0.565 0.785 0.400 1.000 1.835 155° L
15.2 F 131.3 24 0.675 0.955 0.385 1.525 2.155 138° R
0.685 1.000 0.385 1.575 2.155 142° L
15.2 F 137.3 24 0.645 0.725 0.415 1.500 2.185 149° R
0.635 0.775 0.400 1.500 2.085 150° L
15.7 M 127.9 26 0.865 0.875 0.445 1.425 2.200 153° R
0.855 0.900 0.445 1.455 2.335 155° L
17.4 F 194.8 32 0.865 1.115 0.635 2.025 2.700 146° R
0.865 1.115 0.635 2.025 2.700 146° L
17.4 F 224.1 32 0.775 1.035 0.535 1.685 2.435 148° R
0.785 1.045 0.535 1.585 2.415 148° L
17.8 F 212.5 33 0.675 1.055 0.500 1.800 2.385 144° R
0.700 1.035 0.500 1.825 2.400 144° L
18.1 M 333.7 34 0.835 1.185 0.645 2.085 2.715 141° R
0.825 1.165 0.645 2.035 2.735 136° L
18.1 F 201.7 34 0.775 1.045 0.600 1.945 2.675 153° R
0.775 1.100 0.600 1.965 2.665 146° L
18.4 M 287.7 35 0.795 0.995 0.615 1.925 2.800 147° R
0.815 1.025 0.575 2.000 2.785 145° L
18.4 F 292.8 35 0.825 1.085 0.535 1.975 2.615 148° R
0.900 1.165 0.535 1.945 2.645 146° L
18.7 M 309.6 36 0.865 1.085 0.585 1.995 2.700 148° R
0.895 1.245 0.575 1.965 2.775 151° L
19.0 M 320.3 37 0.955 1.100 0.555 2.145 2.775 142° R
0.925 1.135 0.565 2.165 2.800 148° L
19.0 F 319.2 37 0.775 1.145 0.525 2.165 2.765 141° R
0.755 1.045 0.495 2.225 2.765 132° L
19.0 F 387.2 37 0.915 1.265 0.545 1.945 2.915 140° R
1.000 1.245 0.545 2.055 2.915 130° L
20.5 F 418.5 42 0.885 1.165 0.555 2.100 2.785 140° R
0.825 1.125 0.555 2.100 2.800 135° L
20.9 F 459.5 43 0.925 1.275 0.665 2.525 3.055 127° R
0.935 1.295 0.665 2.500 3.075 130° L
21.3 M 477.8 44 0.945 1.315 0.735 2.265 3.000 140° R
0.875 1.335 0.735 2.275 2.845 138° L
21.8 F 462.3 45 1.000 1.425 0.855 2.465 3.235 134° R
1.015 1.435 0.855 2.465 3.235 131° L
21.8 M 535.5 45 1.025 1.445 0.700 2.600 3.400 144° R
1.055 1.400 0.665 2.615 3.355 140° L
21.8 F 541.5 45 1.165 1.500 0.845 2.620 3.455 145° R
1.100 1.555 0.800 2.655 3.445 148° L
22.2 F 507.3 46 1.255 1.165 0.665 2.515 3.425 147° R
1.145 1.335 0.665 2.445 3.395 147° L
23.1 M 657.1 48 1.025 1.245 0.800 2.485 3.425 137° R
1.035 1.225 0.800 2.475 3.425 148° L
24.8 F 699.0 52 1.115 1.325 0.675 2.735 3.475 139° R
1.175 1.335 0.685 2.725 3.500 138° L
25.7 M 628.7 54 1.085 1.615 0.965 2.565 3.675 136° R
1.100 1.745 0.965 2.600 3.535 138° L
27.1 M 1956.3 43 1.555 1.875 1.315 3.645 4.915 138° R
1.600 2.055 1.300 3.655 4.975 141° L
27.5 M 1166.4 58 1.275 1.565 1.135 3.135 4.215 151° R
1.245 1.600 1.100 3.075 4.075 141° L
27.6 F 1303.0 60 1.455 1.525 1.045 2.775 4.085 142° R
1.465 1.625 1.045 2.745 4.115 150° L
28.0 F 1560.4 61 1.600 1.715 1.155 3.265 4.425 147° R
1.715 1.685 1.100 3.225 4.500 150° L
28.0 F 995.8 59 1.400 1.500 0.955 2.995 4.000 149° R
1.345 1.445 1.965 3.075 3.965 140° L
28.9 F 1223.7 63
1.300 1.585 0.975 2.655 4.035 147° R
1.305 1.575 0.975 2.660 4.055 148° L
30.3 M 30.3 66
1.500 1.665 0.965 2.865 4.100 144° R
point on the coronoid process.
3. Gonion-Gnathion (Go-Gn): Length from Gonion to Gnathion.
4. Condyle-Gnathion (Co-Gn): Distance be-tween the posterior-most point on the condylar process and the Gnathion.
5. Symphyseal height (SH): Measured on the median area to be occupied by the future central incisors, corresponding to the vertical distance between the upper-most and lower-most por-tions of the mandibular symphysis.
6. Mandibular Angle (MA): Measured be-tween the posterior margin of the mandibular ramus and the lower margin of the mandibular body.
All measurements were made by one and the same author, using a 0.05 accuracy caliper and a digital scale. The extent of the mandibular angle was measured with the aid of a protractor (Table 1).
The data were collected, tabulated and an-alyzed with the aid of SPSS software, version 11.0, 2005 (Statistical Package for the Social Sciences, SPSS Inc., USA). One-way ANOVA test was performed to compare the mean val-ues of anatomical measurements of the right and left HMs. Gestational age was divided into Period 1 (13-18 WPC), Period 2 (18-24 WPC), FIGURE 1 - Measurements performed in the hemimandible.
and Period 3 (24-30 WPC). Level of significance was set at p < 0.05.
RESULTS
An analysis of the following data was con-ducted for all measurements using 5% statistical significance:
Go-CP, Go-Gn, Co-Gn, and Co-CP
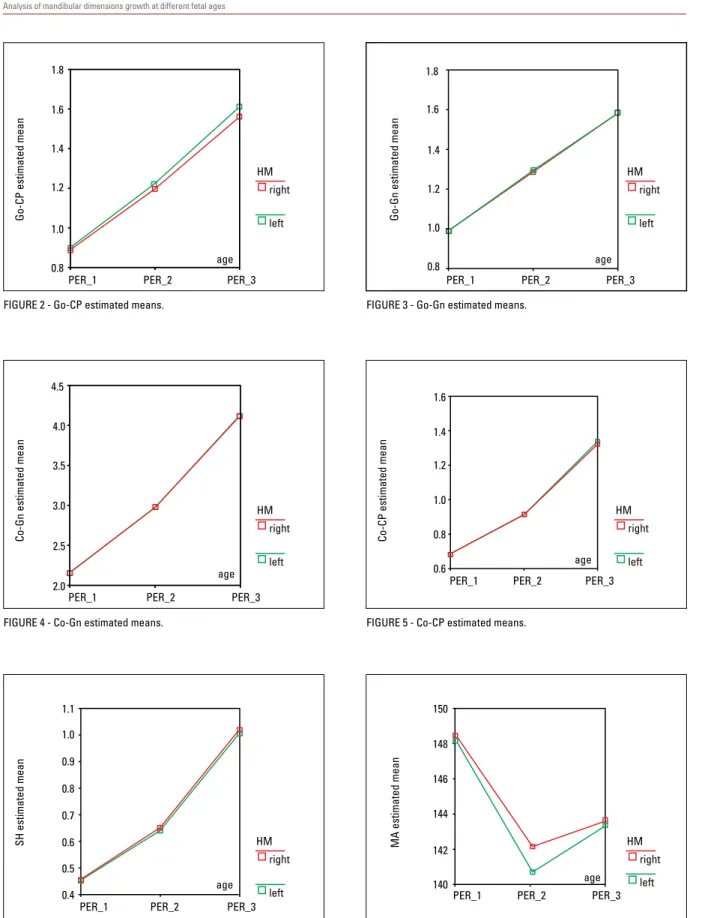
A similar growth pattern emerged between the right and left HMs throughout the three pe-riods. The left side exhibited a greater growth rate than the right, although not statistically sig-nificant (Figs 2, 3, 4 and 5, respectively).
SH (Symphyseal Height)
A similar growth pattern emerged between the right and left HMs throughout the three periods. The right side had a higher growth rate than the left, although not significant p > 0.05 (Fig 6).
MA (Mandibular Angle)
We observed a different growth pattern be-tween periods 1 and 2 and bebe-tween periods 2 and 3. The mandibular angle of the left HM un-derwent a greater decrease than the right side be-tween the first and second periods and a greater increase between the second and third periods. When the first and third periods were compared, however, both HMs were found to be identical. These results showed statistical significance (p < 0.05) and support the findings of the Malas et al6 study, in which significant differences were
found between the right and left sides (Fig 7).
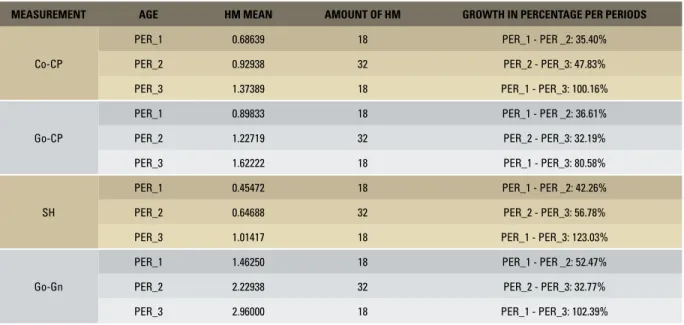
Mandibular Body x Mandibular Ramus Mandibular body growth (length: Go-Gn, height: SH) was higher than that of the man-dibular ramus (length: Co-CP, height: Go-CP) from first to third period. The highest growth rate was found for mandibular body height (SH) (Table 2).
MA SH
Go-Gn
Go-CP
Co-Gn
age
age
age age
age age 1.8
4.5
4.0
3.5
3.0
2.5
2.0
1.8
1.6 1.6
1.4 1.4
1.2
PER_1
PER_1
PER_1 PER_2
PER_2
PER_2 PER_3
PER_3
PER_3 HM
HM
HM right
right
right
left
left
left 1.2
1.0 1.0
0.8 0.8
Go-CP estimated mean
Co-Gn estimated mean
Go-Gn estimated mean
1.1 150
1.0
148 0.9
146
144
142
140 0.8
0.7
0.6
0.5
0.4
1.6
1.4
1.2
1.0
0.8
0.6
PER_1
PER_1 PER_1
PER_2
PER_2 PER_2
PER_3
PER_3 PER_3
HM HM
HM
right right
right
left left
left
SH estimated mean MA estimated mean
Co-CP estimated mean
FIGURE 2 - Go-CP estimated means.
FIGURE 4 - Co-Gn estimated means.
FIGURE 6 - SH estimated means.
FIGURE 3 - Go-Gn estimated means.
FIGURE 5 - Co-CP estimated means.
MEASUREMENT AGE HM MEAN AMOUNT OF HM GROWTH IN PERCENTAGE PER PERIODS
Co-CP
PER_1 0.68639 18 PER_1 - PER _2: 35.40%
PER_2 0.92938 32 PER_2 - PER_3: 47.83%
PER_3 1.37389 18 PER_1 - PER_3: 100.16%
Go-CP
PER_1 0.89833 18 PER_1 - PER _2: 36.61%
PER_2 1.22719 32 PER_2 - PER_3: 32.19%
PER_3 1.62222 18 PER_1 - PER_3: 80.58%
SH
PER_1 0.45472 18 PER_1 - PER _2: 42.26%
PER_2 0.64688 32 PER_2 - PER_3: 56.78%
PER_3 1.01417 18 PER_1 - PER_3: 123.03%
Go-Gn
PER_1 1.46250 18 PER_1 - PER _2: 52.47%
PER_2 2.22938 32 PER_2 - PER_3: 32.77%
PER_3 2.96000 18 PER_1 - PER_3: 102.39%
TABLE 2 - Growth of mandibular body and ramus.
DISCUSSION
In pathological conditions mandibular mea-surements can vary and alter the mandibular angle, which can lead to malocclusion and orth-odontic problems in adults.8
In some studies, researchers found variations and decreased values of the condylar angle as the gestational period evolved.1,2,13,15 A study of
the mandibular angle of 162 fetuses between 9 and 40 WPC showed that the mean values were 122±8° with no significant differences between trimesters nor between left and right HMs.7 In
another study, the observed mean of 139±1° in 36 fetuses between 13 and 37 WPC showed no significant changes in the angle during the sec-ond and third trimesters of pregnancy, compar-ing the right with the left HM.5 In our study,
we noted a variation in the mean value of the mandibular angle (143±6°) between 13 and 30 WPC. There was a decrease during the second quarter and an increase early in the third trimes-ter, more pronounced on left side (p < 0.05).
But when we compared the mean values at the beginning and end of the period studied, we found no significant differences (p > 0.05). Pre-vious studies report that mastication causes a decrease in the mandibular angle between birth and adult life.3,8,9 This suggests that the
mandib-ular angle does not complete its development in the intrauterine period but throughout child-hood, puberty and early adulthood and is influ-enced by mechanical factors.
A radiographic study of mandibular growth using 19 fetal mandibles aged between 18 and 41 WPC showed that the total length of the mandible (Co-Gn) and mandibular body (Go-Gn) increases linearly with fetal age.2 We found
similar results in the present study since the Co-Gn and Go-Gn measurements indicated a slightly greater growth pattern in the left HM, although not statistically significant (p > 0.05 ).
The mandibular body grows more rapidly than the ramus, both in length (Go-Gn) and height (SH) while symphysis height displays the high-est growth rate.5 According to some authors,
however, the mandibular ramus grows faster than the mandibular body, both in length (Co-CP) and height (Go-(Co-CP),2,3 and ramus height
shows the fastest growth rate.2,3 In this study,
we found a greater growth rate in the height (SH) and length of the mandibular body (Go-Gn) compared with the length (Co-CP) and height of the mandibular ramus (Go-CP), as shown in Table 2.
Mandibular dimensions (Go-CP and SH) were assessed using multivariate analysis and PCA and revealed higher growth rates on the right side.5 All other measurements (Co-CP,
Go-Gn, Co-Gn, MA) showed a higher growth rate on the left side, between 13 and 37 weeks of gestation.5 In our study, an analysis of
graphs reflecting the mean measurement
val-ues showed agreement with those valval-ues, ex-cept for Go-CP, which showed a growth rate slightly higher in the left HM.
CONCLUSION
The authors concluded that there was a slight asymmetry in the growth rate of measure-ments Gn-Go, Co-CP, Co-Gn, Go-CP and SH, comparing the left with the right hemimandi-ble between the 2nd and early 3rd trimester of gestation, although not statistically significant. Furthermore, a reduction was found in the man-dibular angle (MA) during the 2nd trimester of gestation, which contrasted with an increased MA at the beginning of the 3rd trimester, in addition to a slight asymmetry. These findings showed statistical significance.
ACKNOWLEDGEMENTS
1. Bareggi R, Sandrucci MA, Baldini G, Grill V, Zweyer M, Nar-ducci P. Mandibular growth rates in human fetal development. Arch Oral Biol. 1995 Feb;40(2):119-25.
2. Berraquero R, Palacios J, Gamallo C, de la Rosa P, Rodriguez JI. Prenatal growth of the human mandibular condylar cartilage. Am J Orthod Dentofacial Orthop. 1995 Aug;108(2):194-200. 3. Enlow, Donald H. Noções básicas sobre o crescimento facial.
1ª ed. São Paulo: Ed. Santos; 1998. cap. 4, p. 57-8. 4. Lee SK, Kim YS, Oh HS, Yang KH, Kim EC, Chi JG. Prenatal
development of the human mandible. Anat Rec. 2001 Jul 1;263(3):314-25.
5. Mandarim de LCA, Alves MU. Human mandibular prenatal growth: bivariate and multivariate growth allometry comparing different mandibular dimensions. Anat Embryol (Berl). 1992 Dec;186(6):537-41.
6. Mandarim de LCA, Passos MARF, Fonseca MARP. Determina-ção da idade fetal: estudo do crescimento do módulo cefálico, comprimentos de pé e vértex-cóccix, e do peso (com base em dados de Streeter, 1920). Ciênc Cult. 1987 dez;39(12):1171-4. 7. Malas MA, Üngo B, Sulak SMTO. Determination of dimensions
and angels of mandible in the fetal period. Surg Radiol Anat. 2006;28:364.
8. Moss ML. The functional matrix hypothesis revisited. Am J Orthod Dentofacial Orthop. 1997;112(4):410-7.
REFERENCES
9. Moyers RE. Ortodontia. 4ª ed. Rio de Janeiro: Guanabara Koogan; 1991. cap. 3, p. 18-32.
10. Proffit WR. Ortodontia contemporânea. 3ª ed. Rio de Janeiro: Guanabara Koogan; 2002. cap. 2, p. 22-57, cap. 3, p. 58-65. 11. Radilaski RJ, Renz H, Klarkoviski MC. Prenatal development of
the human mandible. Anat Embryol. 2002 Sep;207:221-32. 12. Rodrigues H. Técnicas anatômicas. 1ª ed. Juiz de Fora: Ed. da
UFJF; 1973. cap. 1, p. 9-14
13. Rotten D, Levaillant JM, Martinez H, Ducou le Pointe H, Vicaut E. The fetal mandible: a 2D and 3D sonographic approach to the diagnosis of retrognathia and micrognathia. Ultrasound Obstet Gynecol. 2002 Feb;19(2):122-30.
14. Uchida Y, Akiyoshi T, Goto M, Katsuki T. Morphological chang-es of human mandibular bone during fetal periods. Okajimas Folia Anat Jpn. 1994 Oct;71(4):227-47.
15. de Vasconcellos HA, Prates JC, de Moraes LG. A study of human foot length growth in the early fetal period. Ann Anat. 1992 Oct;174(5):473-4.
16. Vasconcellos HA, Silva DS, Salgado MC. Estudo do crescimen-to do ramo da mandíbula durante o período fetal humano. Rev Bras Odontol. 1994 jan-fev;51(1):34-6.
17. Streeter GL. Weight, sitting height, head size, foot length and menstrual age of the human embryo. Contrib. Embr. Carn. Inst. Washington. 1920;11:163-70.
Contact address
Rafael Souza Mota
Rua Vila Rica 18/602 – São Mateus CEP: 36025-080 – Juiz de Fora/MG, Brazil E-mail: [email protected] Submitted: November 2008