Abstract
Current stainless steel design codes, like the Eurocode 3, part 1.4, (2006), are still largely based on analogies with carbon steel structural behavior. The net section rupture represents one of the ultimate limit states usually veriied for structural elements submitted to normal tension stress. An investigation aiming to evaluate the tension capacity of carbon and stainless steel bolted structural elements was performed and in this article, the results are discussed and compared in terms of stress distribution, and force-displacement curves, among others. The result assessment was done by comparisons to the Eurocode 3 (2003) provisions for carbon and stainless steels. The investigation indicated that when stainless steel is used in certain structural engineering applications like joints under tension forces, the current design criteria based on deformation limits need to be re-evaluated, especially due to the differences in the yields for ultimate deformation and stress ratios.
Keywords: Stainless steel, tension resistance, nonlinear analysis, bolted joints, inite element method.
Resumo
As normas atuais de projeto de estruturas em aço inoxidável, como o Eurocódigo 3, parte 1.4 (2006), são, em grande parte, baseadas em analogias assumidas com o comportamento de estruturas desenvolvidas com aço carbono. A ruptura da seção transversal representa um dos estados-limites últimos usualmente veriicados para elementos estruturais submetidos a tensões normais de tração. Esse artigo apresenta uma investigação para se avaliar a resistência à tração de elementos aparafusados em aço carbono e aço inoxidável. Os resultados são discutidos e comparados em termos de distribuição de tensões, curvas carga-deslocamento, entre outros. Esses resultados foram comparados com as recomendações de projeto do Eurocódigo 3, para aço carbono e aço inoxidável, respectivamente. Essa investigação indicou que, quando o aço inoxidável é utilizado em certas aplicações da engenharia estrutural, como ligações submetidas a esforços de tração, o critério atual de dimensionamento, baseado em deformações-limites precisa de ser reavaliado, especialmente devido às diferenças elevadas de tensões de escoamento e de ruptura, respectivamente.
Palavras-chave: Aço inoxidável, resistência à tração, análise não-linear, ligações aparafusadas, método dos elementos initos.
Numerical and experimental
assessment of stainless and
carbon bolted tensioned
members with staggered bolts
Avaliação numérica e experimental de
membros tracionados em aço carbono e
aço inoxidável com parafusos defasados
João de Jesus dos Santos
PGECIV - Post Graduate Program in Civil Engineering, UERJ, Brazil [email protected]
André Tenchini da Silva
PGECIV - Post Graduate Program in Civil Engineering, UERJ, Brazil [email protected]
Luciano Rodrigues Ornelas de Lima
Structural Engineering Department, UERJ, Brazil [email protected]
Pedro Colmar Gonçalves da Silva Vellasco
Structural Engineering Department, UERJ, Brazil [email protected]
Sebastião Arhur Lopes de Andrade
Structural Engineering Department, UERJ, Brazil [email protected]
José Guilherme Santos da Silva
Structural Engineering Department, UERJ, Brazil [email protected]
1. Introduction
Stainless steel has been used in various types of constructions, due to its main characteristics associated with high corrosion resistance, durability, ire resistance, ease of maintenance, appear-ance and aesthetics (Gardner and Neth-ercot, 2004). Stainless steel is indicated, as a structural element in construction for multiple reasons. Its high ductility allows its use in structures subjected to cyclic loadings, enabling the dissipation of the energy before structural collapse. Despite these facts, current stainless steel design codes like the Eurocode 3, part 1.4,
(2003), are still largely based on carbon steel structural analogies.
The search for a broader under-standing of the actual behavior of stainless steel joints has motivated investigations in various research centers like: Burgan et al. (2000), Gardner and Nethercot (2004) and Bouchair et al (2008). The motivation was the search for the most cost-effective structure resulting from an optimum joint design, as well as an improvement of the joint fabrication and assembly costs. Experimental studies indicated that dif-ferent types of collapses, especially due to
serviceability limitations, were observed in stainless steel joints with thin and thick plates under shear. This article presents an investigation aiming to evaluate the ten-sion capacity of carbon and stainless steel bolted structural elements. The results are discussed and compared in terms of the stress distribution, and force-displacement curves, among others. Assessment of the results was done by comparisons to the Eurocode 3 (2003) provisions for carbon and stainless steels.
2. Eurocode 3 design code provisions
The current investigation uses the European code for stainless steel ele-ments - Eurocode 3, pt 1.4 (2003). In this design standard, the failure modes for a plate with staggered holes under tension axial forces are governed by two ultimate limit states: the gross area yield and the
net area tension rupture. The presence of staggered holes in the transversal section (see Figure 1), makes it dificult to im-mediately identify the plate’s critical net section. This problem is not new, since Cochrane (1922), performed one of the irst attempts to characterize staggered
bolted connection failure modes by using Equation (1) below. This expression adds a term to the original net width to obtain the inal net section area and it is present in major steel design codes all over the world.
b
n= b - d
b+ s
24p
(1)In the above equation, b is the plate width, db is the bolt diameter, s and p represent the staggered center to center hole distances measured parallel and perpendicular to the member axis
Eurocode 3, part 1.4, (2003) establishes the guidelines for the stainless steel plate design submitted to axial tension forces. As cited before, the structural failure is as-sociated to the smallest axial tension force
obtained considering two limiting states: gross cross-section plastic resistance given by Equation (2), or the ultimate net cross-section tension rupture expressed by Equation (3).
N
pl, Rd=
A
g. f
yg
M0 (2)where Npl,Rd is the tension design plastic resistance, Ag is the plate’s gross area,
fy is the steel’s yielding stress, gM0 is the partial safety factor, in this case
equal to 1.
N
u, Rd= k
r. A
n. f
uwith
k
r= (1 + 3r(d
0/u - 0.3))
g
M2 (3)where An is the net cross-section plate area, fu is the steel tension rupture stress, kr is a factor for stainless steel material, gM2 is the partial safety factor, equal to 1.25, r is the ratio between the number of bolts at the cross-section and the total joint bolt number, d0 is the hole diameter, u = 2.e2 but u ≤ p2 where e2 is the edge distance measured from the bolt hole center to its adjacent edge, in the direction
perpendicu-lar to the load direction and p2 is the hole center-to-center distance, perpendicular to the load axis.
The tension plate design has also some additional provisions: in bolted joints, the hole width should be consid-ered 2 mm larger than the nominal bolt diameter, perpendicular to the applied force direction; in the case of staggered holes, when a diagonal direction to the
load axis or zigzag is considered, the net width should be calculated irst deduc-ing from the initial gross width, all the holes present in it, and after that adding for each staggered holes a value equal to s2/4p, where s and g, correspond to the
considered longitudinal and traversal hole spacing; the bolted joint critical net width is the smallest evaluated net width for all the possible net ruptures.
3. Experimental investigations
An innovative experimental pro-gram was used to evaluate the tension ca-pacity of carbon and stainless steel plates
with staggered bolts. The experiments involved bolted cover plate joints made of stainless steel A304 and carbon steel
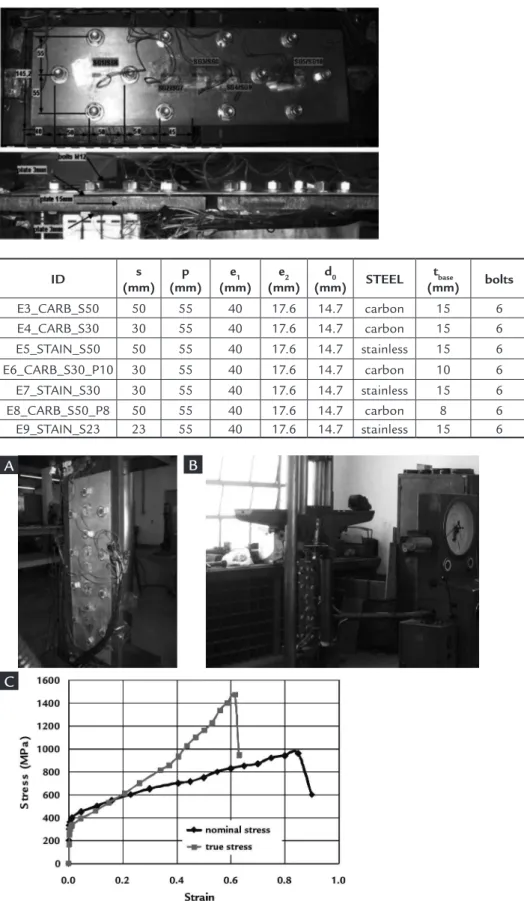
of two, 3 mm thick, stainless and carbon steel plates and two, 15 mm thick, carbon steel plates used for load transfer to the 3mm plate with a 5 mm gap - see Figure 2(A). The horizontal bolt pitch, s, was modiied in each test and the vertical bolt pitch, p, was 55 mm (see Figure 1). The bolted cover plate joint tests were carried out on a 600kN Universal Lousenhausen test machine; see Figure 2(B). The strain
measurements were performed using lin-ear strain gauges located in both stainless steel plates named SG in Figure 1.
The tensile coupons test curves presented a nonlinear expected behavior, mainly for the stainless steel – see Figure 2(C). The stainless steel yield stress was determined using a straight line parallel to the initial stiffness at a 0.2% deforma-tion, leading to a value equal to 350.6
MPa while the ultimate tension stress was 710.7 MPa. For the carbon steel, these values were equal to 386.8 MPa and 478.7 MPa, respectively. Figure 2(C) also presents the results of a well-known true stress versus true strain curve used in the inite element modeling, due to the large strain and stresses associated with the investigated problem.
Figure 3 presents the comparison
Figure 1 Cover plate joint detail and strain gauges location.
Table 1 Summary of experimental
tests (Santos, 2008).
Figure 2 Santos et al. (2008) test layout. A) cover plate joint detail. B) Universal test machine, 600kN. C) Stress versus strain curves
for the stainless steel A304.
ID s
(mm) p (mm)
e1 (mm)
e2 (mm)
d0
(mm) STEEL
tbase
(mm) bolts
E3_CARB_S50 50 55 40 17.6 14.7 carbon 15 6 E4_CARB_S30 30 55 40 17.6 14.7 carbon 15 6 E5_STAIN_S50 50 55 40 17.6 14.7 stainless 15 6 E6_CARB_S30_P10 30 55 40 17.6 14.7 carbon 10 6 E7_STAIN_S30 30 55 40 17.6 14.7 stainless 15 6 E8_CARB_S50_P8 50 55 40 17.6 14.7 carbon 8 6 E9_STAIN_S23 23 55 40 17.6 14.7 stainless 15 6
A B
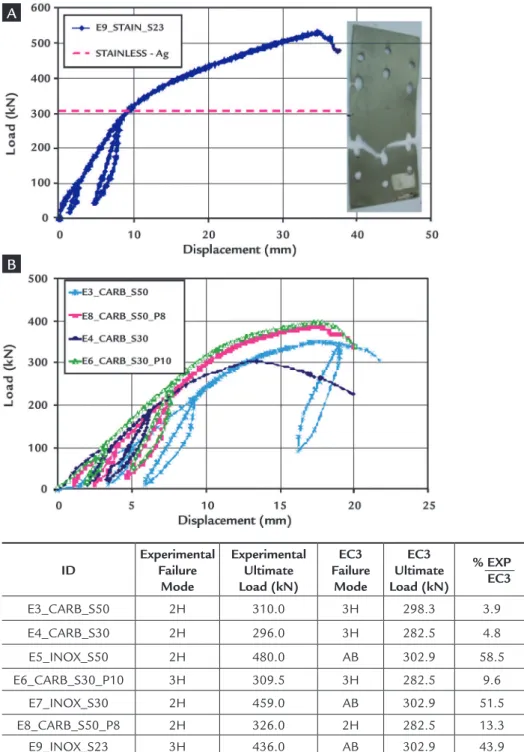
between the results from tests E3_CARB_ S50 and E5_STAIN_S50 in terms of the load versus axial displacement curves. This igure depicts the experimental ul-timate loads of 310.0 kN and 469.4 kN for E3_CARB_S50 and E5_STAIN_S50 tests, respectively. According to the Eu-rocode 3, (2003), Equations (2) and (3), for the E3_CARB_S50 test, the design resistances were 337.0 kN for gross cross-section plastic resistance and 298.7 kN for ultimate net cross-section ten-sion rupture (section with three holes). While for the E5_STAIN_S50 test, these values were 305.5 kN and 810.8 kN (net section with three holes), respectively. The partial safety factor was taken to be equal to 1.0. Figure 3 also indicates that in both tests, the test rupture occurred in the section represented by two holes near the joint symmetry axis. For the carbon steel test E3_CARB_S50, the theoreti-cal and experimental values presented a good agreement but the stainless steel test E5_STAIN_S50 presented a larger differ-ence in terms of the ultimate design equa-tion and test loads. Figure 3 also presents the results for tests: E4_CARB_S30 and
E7_STAIN_S30. The ultimate loads were 303.6 kN and 545.8 kN for E4_CARB_ S30 and E7_STAIN_S30 tests. According to the Eurocode 3 (2003), Equations. (2) and (3), for the E4_CARB_S30 test, the design resistances were 337.0 kN for gross cross-section plastic resistance and 291.7 kN for ultimate net cross-section tension rupture (section with three holes). For the E5_STAIN_S50 test, these values were 305.5 kN and 791.9 kN (net section with three holes), respectively. Figure 4 indicates that in both tests, the rupture occurred in the section with the two holes nearest to the joint symmetry axis. Again the carbon steel test E3_CARB_S50 theo-retical and experimental values presented a good agreement while the stainless steel test E5_STAIN_S50, still showed a non-negligible difference for the ultimate design equation and test loads.
Considering the difference between the failure modes for the two stainless steel joints presented before, another test, E9_STAIN_S23, was done to investigate this issue where the horizontal bolt pitch was taken to be equal to 23mm. This value considered the increase in the difference
between the load failure in sections with two and three bolts, respectively. Accord-ing to Eurocode 3 (2003), for this test, the design resistances were 305.4 kN for gross cross-section plastic resistance and 787.7 kN for ultimate net cross-section tension rupture (section with three holes). Figure 4(a) presents the load versus displace-ment for this test where the ultimate load was equal to 526.5 kN. It can also be observed that the joint rupture occurred in the net section passing through three bolts, in agreement with the Eurocode 3 (2003). Despite this fact, the design equation and the tests collapse loads still had some difference. A summary of these results is presented in Table 2. It may be concluded that for carbon steel joints, a good agreement was observed comparing the theoretical and experimental results. Alternatively, for the stainless steel joints, larger differences were found in terms of ultimate (rupture) loads.
Another key issue undertaken in-volved the assessment of the inluence of the load application plate thickness, adopted initially equal to 15mm (E3_ CARB_S50 and E4_CARB_S30). Two
Figure 3
Load versus displacement curves – part I (Santos, 2008).
A) E3_CARBON_S50 & E5_STAIN_S50 B) E4_CARBON_S30 & E7_STAIN_S30.
A
other tests were performed, E6_CARB_ S30_P10 (load plate thickness equal to 10 mm) and E8_CARB_S50_P8 (load plate
thickness equal to 8 mm). Comparing the E3, E8 and E4 tests with E6, Figure 4(b), it may be concluded that the load
applica-tion plate thickness signiicantly alters the joint response in terms of ultimate load and associated failure mode.
Figure 4 Load versus displacement curves – part II(Santos, 2008).
A) E9_STAIN_S23. B) Load plate thickness variation.
Table 2 Summary of experimental
tests (Santos, 2008). 2H: Two hole net rupture. 3H: Three hole net rupture. AB: Gross section yielding.
ID
Experimental Failure
Mode
Experimental Ultimate Load (kN)
EC3 Failure
Mode
EC3 Ultimate Load (kN)
% EXP EC3
E3_CARB_S50 2H 310.0 3H 298.3 3.9
E4_CARB_S30 2H 296.0 3H 282.5 4.8
E5_INOX_S50 2H 480.0 AB 302.9 58.5
E6_CARB_S30_P10 3H 309.5 3H 282.5 9.6
E7_INOX_S30 2H 459.0 AB 302.9 51.5
E8_CARB_S50_P8 2H 326.0 2H 282.5 13.3
E9_INOX_S23 3H 436.0 AB 302.9 43.9
4. Numerical investigation
Finite element numerical analyses provide a relatively inexpensive and time eficient alternative to physical experi-ments. Despite this fact, due to their na-ture, these numerical simulations have to be properly calibrated against experimen-tal test results (Silva, 2009). If the validity of FE analysis is assured, it is possible to investigate the structural behavior against a wide range of parameters with the FE model. A inite element model was used to investigate the tension capacity of
cover plate joints developed with the aid of the Ansys 11 (2008) FE package. The numerical model adopted solid elements (SOLID45) deined by eight nodes with three degrees of freedom per node: trans-lations in the nodal x, y and z directions. Contact elements (CONTA174 and TARGE170) presented in the Ansys 11 (2008) Elements Library, were considered between the plates and between the holes and the bolt shanks. The load was applied by means of axial displacements in the
load plate such as presented in Figure 5. In this igure, it is also possible to observe that the bolt head and nuts were simulated through UZ displacements restraints at the hole’s adjacent area. Figure 5 presents a typical mesh coniguration of the complete model. It is emphasized here that only half of the model was considered using sym-metry conditions suficient to characterize the joint ultimate limiting states.
The adopted material properties were: Young’s modulus of 210 GPa (see
A
Figure 2) and a Poisson’s coeficient of 0.3. As previously mentioned, stainless steel true stress versus true strain curves with a nonlinear behavior were adopted using data from the tensile coupons tests - Figure 2(C). A full nonlinear analysis was performed for the developed numerical model. The material non-linearity was considered using a von Mises yield cri-terion associated to a multi-linear stress-strain relationship and isotropic hardening response. The geometrical non-linearity was introduced in the model by using an Updated Lagrangean formulation. This procedure represents the full structural assessment of the analyzed bolted joints, and may be summarized in several
out-puts, namely the stress distribution (that detects, among other data, irst yield), or the force versus displacement curve for any node within the connection.
Figure 6 presents the load versus dis-placements curves for each individual test, where it can be observed that the ultimate load of experiments E5_INOX_S50, E7_ INOX_S30 e E9_INOX_S23 were: 389 kN, 389 kN and 385 kN, respectively. All the numerical model loads were situated in an interval between the experimental loads and the Eurocode 3 part 1.4 (2003) estimated values.
In order to validate the proposed numerical model, a series of compari-sons will be presented in terms of load
versus strain curves for speciic points that were measured in the experimental program. Figure 7 presents numerical and experimental strain comparisons for the E5_INOX_S50 specimen, mea-sured in the region close to the joint center line. It can be observed that a similar response was found in the nu-merical and experimental curves, for strain gauges 2(4) and 3(8). However, the numerical model presented in the plastic range had a stiffness value lower than its experimental counterparts. Figure 8 depicts load vs. strain curves for the E7_INOX_S30 test, where it can be observed that the numerical results were not as good as the previous tests,
Figure 5
Finite element model and contact elements (Silva, 2009).
Figure 6
Stainless steel load versus
displacement curves (Silva, 2009). A) E5_INOX_S50 specimen. B) E7_INOX_S30 specimen. C) E9_INOX_S23 specimen.
Figure 7
Load vs strain (experimental and numerical) - E5_INOX_50 (Silva, 2009). A) Strain gauges 2 and 4.
B) Strain gauges 3 and 8.
Figure 8
Load vs strain (experimental and numerical) - E7_INOX_30 (Silva, 2009). A) Strain gauges 2 and 4.
B) Strain gauges 3 and 8.
0 100 200 300 400 500 600
0 5 10 15 20
Displacement (mm) Numerical model Experimental Eurocode 3 0 100 200 300 400 500 600
0 5 10 15 20
Displacement (mm) Numerical model Experimental Eurocode 3 0 100 200 300 400 500 600
0 5 10 15 20
Displacement (mm) Numerical model Experimental Eurocode 3 L o a d ( k N ) L o a d ( k N ) L o a d ( k N )
A B C
0 50 100 150 200 250 300 350 400 450
0 1000 2000 3000 4000 5000
Strain (µ )ε Strain (µ )ε
Ext_2 Ext_4 Numerical model 0 50 100 150 200 250 300 350 400 450
0 1000 2000 3000 4000 5000
Ext_3 Ext_8 Numerical model L o a d ( k N ) L o a d ( k N ) A B
Strain (µ )ε Strain (µ )ε
0 50 100 150 200 250 300 350 400 450
0 1000 2000 3000 4000 5000 Ext_2 Ext_4 Numerical model 0 50 100 150 200 250 300 350 400 450
presenting a lower stiffness and achiev-ing larger strains than its experimental counterparts. Alternatively, the results of E9_INOX_S23 tests, Figure 9, in-dicated a good similarity between the numerical and test evidences.
The plate section at which the stain-less steel net area rupture failure mode occurred was determined with the aid
of Figure 10 where load vs. strain curves are illustrated for a point located at the plate cross section with two bolt holes at the horizontal symmetry axes. From this graph, it can be observed that as the hori-zontal distance between two bolt holes increases, the magnitude of the stresses on the bolt present in adjacent section di-minishes. For example, for a 250kN load
level, the left curve is associated to a strain level lower than the others, highlighting the net area rupture failure passing in a plate section with three bolt holes. On the other hand, for this load level, the E5_INOX_S50 numerical model high-lights that the failure mode is associated to the net area rupture failure passing in a section with two bolt holes.
Figure 9 Load vs strain (experimental and numerical) - E9_INOX_23 (Silva, 2009).
A) Strain gauges 2 and 4 B) Strain gauges 3 and 8
Figure 10 Load versus strain curves for all the
numerical models (Silva, 2009).
5. Final considerations
This paper presented an experimen-tal and numerical program to investigate the structural response of the carbon steel and stainless steel plates with staggered bolts under tension. Initially the experi-mental results were compared to theo-retical results according to Eurocode 3, (2003), provisions. For carbon steel tests, a good agreement was reached between the design equation and the experiments; a fact that was not corroborated in the stainless steel tests, where large differ-ence were observed, mainly in terms of the ultimate load. A possible explanation for these discrepancies could be related to the fact that the great majority of stain-less steel structural design codes are still based on carbon steel analogies. At this point, it is interesting to observe that the stainless steel codes need to be improved in order to correctly evaluate the stain-less steel structural element behavior. A inite element numerical model was also developed with the aid of the Ansys 11 (2008) and considered material and geo-metrical nonlinearities through the von
Mises yield criterion and the Updated Lagrangian Formulation, respectively. The numerical model calibration was made against Santos (2008) experiments where the optimum mesh and element sizes were determined, Silva (2009).
Table 3 presents a comparison between the numerical results and the Eurocode 3 provisions (2003), for the already mentioned stainless steel tests (Santos, 2008). Differences of about 28% were found when the Eurocode 3 (2003) and the numerical models were compared. The numerical ultimate loads were less than their experimental counterparts for all the investigated specimens. This can be explained by the fact that the developed numerical models represent the joints in an idealized form, without imperfections or residual stresses. Another reason for these differences can be attributed to the fact that the stainless steel stress versus strain curve adopted in the inite element model was obtained through coupons specimens that are inluenced by the rolling direction. The problem related to the numerical
and experimental assessment of stainless and carbon bolted tensioned members is certainly much more complicated and it is inluenced by several other design parameters. Further research in this area is currently being carried out, in order to consider imperfections, residual stresses and the coupons rolling directions.
On the other hand, differences vary-ing from entre 12% up to 19% were found when the numerical and the experimental values were compared. These differences were also partly due to the natural con-servatism present in most of the design standard Eurocode 3, part 1.4, (2003). This conservatism is largely due to the lack of experimental evidence regarding stainless steel response not yet present in literature. The investigation indicated that when stainless steel is used in certain structural engineering applications like joints under shear forces, the current de-sign criteria based on deformation limits need to be re-evaluated, especially due to the differences in the yields for ultimate deformation and stress ratios.
0 50 100 150 200 250 300 350 400 450
0 1000 2000 3000 4000 5000
Ext_2 Ext_4 Numerical model 0 50 100 150 200 250 300 350 400 450
0 1000 2000 3000 4000 5000
Ext_3
Ext_8
Numerical model
Strain (µ )ε Strain (µ )ε
L o a d ( k N ) L o a d ( k N ) A B 0 50 100 150 200 250 300 350 400 450
0 1000 2000 3000 4000 5000
s=23mm
s=30mm
s=50mm
Strain (µ )ε
Table 3
Summary of experimental tests (Silva, 2009).
Experimental tests
Experimental failure mode
Experimental ultimate load
(kN)
Numerical failure
mode
Numerical ultimate load (kN)
Difference Numerical x Experimental
(%)
Difference Numerical x
EC3 (%)
E5-INOX-S50 2H 480.0 2H 389 19.0 28.8
E7-INOX-S30 2H 459.0 2H / 3H 389 15.2 28.8
E9-INOX-S23 3H 436.0 3H 385 11.6 27.5
6. Acknowledgments
The authors gratefully acknowledge the Brazilian National and State Science Support Agencies: CAPES, CNPq and
FAPERJ for the inancial support granted to this research program. Thanks are also due to ACESITA and USIMINAS for
donating the stainless and carbon steel plates used in the experiments.
7. Bibliographic references
ANSYS, Inc. Theory Reference, 2008. (version 11.0)
BOUCHAIR, J., AVERSENG, A., ABIDELAH. Analysis of the behaviour of stainless steel bolted connections. Internal Report - LaMI, Blaise Pascal University, France, 2008
BURGAN B. A., BADDOO, N. R., GILSENAN, K. A. Structural design of stainless steel members - comparison between Eurocode 3, Part 1.4 and test results. Journal of Constructional Steel Research, v. 54, n. 1, p.51-73, 2000.
COCHRANE, V. H. Rules for rivet hole deduction in tension members. Engineering News-Record, v. 80, 1922.
EUROCODE 3, ENV 1993-1-1, 2003: Design of steel structures - Structures – Part 1-1: General rules and rules for buildings. CEN, European Committee for Standardisation, 2003.
EUROCODE 3, ENV 1993-1-4, 2003: Design of steel structures – Part 1.4: General rules – Supplementary rules for stainless steel, CEN, European Committee for Standardisation, 2003.
GARDNER, L., NETHERCOT, D. A. Experiments on stainless steel hollow sections — Part 1: Material and cross-sectional behaviour. Journal of Constructional Steel Research, v. 60, n.9, p. 1291–1318, 2004.
SANTOS, J. de J. DOS, Comportamento estrutural de elementos em aço inoxidável, MSc in Civil Engineering, State University of Rio de Janeiro, UERJ, Rio de Janeiro, Brazil, 2008. (In portuguese).
SILVA, A. T. da, Modelagem numérica de elementos tracionados em aço inoxidável com parafusos defasados, MSc in Civil Engineering, State University of Rio de Janeiro, UERJ, Rio de Janeiro, Brazil, 2009. (In portuguese).