*e-mail: [email protected]
Evaluation of the Relevant Features of
Welding Defects in Radiographic Inspection
Antonio Alves de Carvalho*, Raphael Carlos de Sá Brito Suita, Romeu Ricardo da Silva, João Marcos Alcoforado Rebello
Department of Metallurgical and Materials Engineering, Federal University of Rio de Janeiro (UFRJ), C.P. 68505, 21945-970 Rio de Janeiro - RJ, Brazil
Received: December 20, 2002; Revised: May 12, 2003
The use of X-ray as an inspection technique to ensure the integrity of industrial products dates from the beginning of the 20th century. Therefore, it is a tool of non-destructive inspection widely known. Nowadays, however, there are several researches forward on the optimization of such inspection technique, mainly for the development of an automatic system of radiographic image analysis. That is, a system that can identify and classify the defects in the radiography. An impor-tant step in the construction of this system is the classification of defects, which is usually done by using some of their features. The purpose of this work is to study the relevance of some defect features in order to classify some of the main classes of defects. The employed technique is the linear correlation between the defect features and the classes of defects. A non-linear pattern classifier is used, implemented by a neural network, to evaluate the performance in the classifica-tion. The results showed the efficiency of the method used.
Keywords:nondestructive tests, radiography, welding defects, neural networks
1. Introduction
The radiography is a nondestructive method that uses the penetrating and ionizing inspection radiation to detect internal defects, which also detects, with high sensitivity, discontinuities with few millimeters of extension, when properly aligned with the incident beam. Mainly used in the petroleum, petrochemical, nuclear and power genera-tion industries for the inspecgenera-tion of welds and castings es-pecially, as well as in the war industry for the inspection of explosives, armaments and missiles, the radiography has played an important role in the quality assurance of the piece or component, in conformity with the requirements of the standards, specifications and codes of manufacturing. Be-sides, the industrial radiography plays a fundamental role in the quality documentation of the inspected product, be-cause the projected image of the radiographic film repre-sents the internal “photography” of the piece, which no other non-destructive test is able to show.
The reliable detection of defects is one of the most im-portant tasks in non-destructive tests, mainly in the radio-graphic test, since the human factor still has a decisive in-fluence on the evaluation of defects on the film. An
incor-rect classification may disapprove a piece in good condi-tions or approve a piece with discontinuities exceeding the limit established by the applicable standards.
The purpose of the automation of the process of analy-sis of digitized radiography is to reduce the analyanaly-sis time and eliminate the subjective aspect in the analysis done by the inspector, this way increasing the reliability in the in-spection, considering that the automated evaluation is done by computer programs1-3. The automation of the analysis processes of radiography consists usually on the following steps: radiographic film digitizing, digital image process-ing, feature extractions of defects, and defect recognition through tools of pattern recognition1,4.
2. Detection and Classification of Welding
Defects on Radiographic Images
The radiographic image processing is especially used to improve the image quality, making the analysis process easier, which consists of detecting and classifying defects on the film. In the conventional method, the analysis is done exclusively by the X-ray inspector. The progresses in com-puter science and the artificial intelligence techniques have allowed the defect classification to be carried out by using pattern recognition tools5,6, especially the methods that use artificial neural networks, which make the process automatic and more reliable, as it is not a subjective analysis. Pattern recognition are tasks routinely performed by humans. When someone who is driving a car looks at a traffic light, he/she is able to distinguish the information easily and start the proper procedure afterwards. When we observe a photo-graph, we can identify precisely the people in the photo even if we have seen them before for just a few times, al-though the people in the photo may wear different clothes, have different hair styles and be in different positions. These tasks, as many others, are simple for humans, but imple-menting them in a computer system is extremely complex7. The techniques for pattern recognition implemented on radiographic digital image involve, mainly, the location and isolation of the objects (defects) on the radiographic image, and later, the defect identification (classification). The pat-tern recognition assumes that the image may have one or more defects, and that each defect belongs to a preset type, cat-egory or pattern class of defects. If a digitized image has
sev-eral defects, the process for pattern recognition consists of three main steps (Fig. 1)5, which are described as follows.
The first step is the image quality improvement or the defect isolation, in which each defect is located and iso-lated from the rest of the image. Several types of degrada-tions and distordegrada-tions, inherent in the processes of image acquisition, transmission and display contribute to limit the capacity to extract information. The main purpose of this image quality improvement step is to suppress or reduce the consequences of these barriers, making it easy to ex-tract the relevant information. This improvement is usually done with the application of image digital filters5.
The second step is the extraction of defect features1, that is, where the defects are measured. One measurement is the value of any sizeable property of defect. A feature is a func-tion of one or more measurements, which are registered in the computer to dimension any significant characteristic of the defect. This drastic reduction in the amount of informa-tion (if compared to the original image) represents all the knowledge on which the subsequent process of classifica-tion shall be based5. Therefore, the fewer features existing to represent a certain class, the fewer information will be processed. For example, if an intelligent system intends to classify banana and orange, only one feature of form is nec-essary to classify these two classes. However, the classes are not always so easily separated.
The use of features of defects is one of the mostly used techniques to classify the welding defects after their detec-tion. In this case, the correct selection of the most relevant features in the identification of each class has a great im-portance in the recognition of such classes done by the in-telligent system8. This selection is similar to the interpreta-tion given by an inspector who, in most cases, recognizes first one type of welding defect in the radiography by visual characteristics, such as: location, shape, length, density (gray level), aspect ratio, etc., besides the welding conditions. So, an important study of the defect morphology at the image level is required to optimize the system performance8.
The third step of the pattern recognition process is the
classification. This output is merely a decision considering the class that each defect belongs to. Each defect is consid-ered to be an individual class, and the recognition is imple-mented as a process of classification. Each defect is directed to one of the several preset classes, which represent all pos-sible types of defects expected to exist in the image.
3. Analysis of the Linear Correlation Matrix
cients, calculated by the equation (1):
(1)
where
C (x, y): linear correlation between variables xandy. and : mean values for variables x and y respec-tively.
σ
x and σy: standard deviations for variables x and y re-spectively.
The correlation C varies in the interval of [-1, 1]. High values for the module C, that is, C close to +1 or -1, indicate that there is a great probability of a linear dependence be-tween the two variables, and values for the module C of about zero indicate that there is a small probability of such dependence occurring.
If the two variables x and y are independent and ran-dom, certainly the expected value of the correlation will be zero. A method to evaluate the reliability in the existence or non-existence of correlation between the two variables de-scribed in Chatfield9 is to compare to the correlation of ran-dom variables: the correlation values that are higher than the ratio , where N is the number of observations of the variables, indicate 95% of probability of variables be-ing correlated, more details about this theory can be read on Chatfield’s book9.
4. Experimental Methodology
4.1 Image Digitizing and Processing
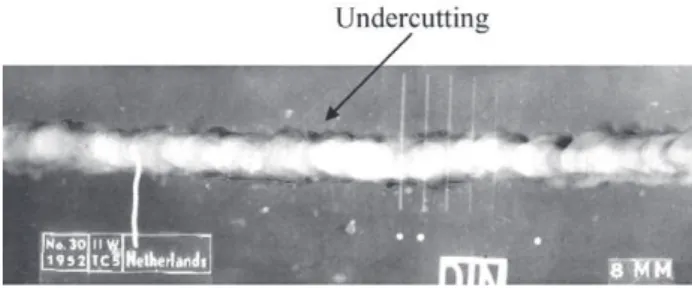
Radiographic films of the IIW (International Institute of Welding)* patterns were digitized having primarily the classes of defects desired to be evaluated in this study: lack of penetration (LP), undercutting (UC), porosity (PO) and slag inclusion (SI). The radiographic images were digitized in a Flatbed UMAX Mirage II scanner, which operates in transmission and reflection mode, with resolution of 500 dpi (dots per inch) and gray scale at 256 levels (8 bits). The images were stored in TIFF format (with no compres-sion). A microcomputer (PC type) and a image analysis pro-gram (Image Pro Plus 4.0 for Windows) were used.
After the image digitizing step, many program tools were analyzed to improve the image quality, and in general, a median-type low-pass filter was used to smooth the noise, and a high-pass filter or tools of contrast improvement were used to highlight the outlines of the defects. Some more details about this step can be find on the Silva’s reference8. Mery1 also explains each step usually used on radiographic image enhancement. After this step, the image was calibrated and the defects identified on the image by visual way, as
shown on the Fig. 2. Once the defect was located, the fea-tures were calculated automatically by the software Image Pro Plus.
4.2 Selecting and Defining the Features
Eight features were selected for the classification of four classes of defects: lack of penetration (LP), undercutting (UC), porosity (PO) and slag inclusion (SI). The data used was composed of 29 lack of penetration observations and 30 observations including the remaining defect classes. A relatively high number of features were selected, with the purpose of showing the high relevance degree of some fea-tures to characterize certain classes of defects, which will be analyzed by the correlation study.
The adequate selection of features has fundamental im-portance for the subsequent classification process. Some criteria can make it easier to choose the best features. For example, the distance from the defect to the weld bead center distinguishes very well the undercutting from the lack of penetration, as the lack of penetration is in the weld bead center and the undercutting is usually at the edge8. How-ever, the intention of this study is to evaluate the features that can provide satisfactory results with the automatic ex-traction.
Definition of the features used:
• Aspect Ratio (As): Ratios between the longest and the shortest axes of a equivalent ellipse within the defect area.
• Area/Box (AB): Ratio between the defect area and the area of the smallest rectangle that contains the defect.
• Box X/Y (X/Y): Ratio between the width and the height of the smallest rectangle that contains the defect.
• Angle (Ang): Angle between the shortest axis of the defect and the vertical line.
• Ratio between the radius (R/r): Ratio between the long-est and the shortlong-est radius of the defect.
• Roundness (R): It measures the ratio P2/4pA, where
‘p’ is the perimeter of the defect and ‘A’ is the area.
• Fractal (F): Fractal dimension10 of the defect outline. Figure 2. Identification of defects on the image.
• Medium Density (D): Medium density in gray tones of points from inside the defect.
Figure 3 shows a example of automatic extraction of the features done by the program Image Pro Plus:
5. Results and Discussions
In order to make the extracted data as representative as possible, not making the analysis improperly difficult, it is important to eliminate the outliers that are not included in the true representation of a defect class. Based on that, the measurements of the classes were adjusted to a standard normal distribution, and the atypical values that were not close to the average for more than three standard deviations were excluded from the data group, as shown on the Fig. 4. Table 1 shows the values obtained from the correlation coefficients among the 8 features, and between the features and the 4 classes of defects analyzed in this study. This tech-nique is used to evaluate the relevance of the features cho-sen for the classification of each defect class, which was calculated using the training set of the neural network11, so in this case, we have a matrix of twelve columns (8 features + 4 classes). This technique is completely described on Silva8. The criterion used to check the correlation existence follows the ratio . As the total value of the features was 119, so the values that were higher than (0.18) indicate a probability of correlation over 95% (shaded cells)9. This table also shows the values of for each defect class. See as follows one analysis of the feature correlation for each defect class, based on Table 1.
• Lack of Penetration: The features R, AB and Ang in-dicate a correlation with this class, with the feature R showing the highest correlation.
• Undercutting: The features AB and XY display a high correlation rate with this class, followed by the fea-tures AS, R/r and D.
• Porosity: The features R, R/r, AB and As indicate a correlation with this class, with the feature R showing the highest correlation.
• Slag Inclusion: The features Ang and R indicate a cor-relation with this defect class.
A nonlinear pattern classifier implemented with a backpropagation-type neural network6,11 is used with a hid-den layer of 10 neurons and 4 neurons on the output layer (4 classes of defects), being the 8 features extracted from the radiographic image the inputs of the classifier11. By al-tering the number of neurons on the hidden layer and ob-serving the training and performance error of the classifier at the end of the training, it is possible to obtain the best number of neurons on the hidden layer for the proposed study. By changing the number of neurons within the range of 7 to 15 on the hidden layer, the best result obtained (mini-mum error and maxi(mini-mum performance) was 10 neurons.
As mentioned before, the fewer features, the less com-puter efforts will be to classify the classes of defects. How-ever, the system probability of not classifying the class or classifying it incorrectly might be higher, depending on the relevance of the features used.
The first step in the process to optimize the number of features was to use all of them in the classification and evalu-ate the performance of the classifier, which was 100% in this case.
In the second step, Table 1 was used to identify the fea-tures of higher relevance in the classification. It is possible to observe that the feature AB has relevance in the classifi-cation of the classes LP, UC and PO, while the feature Ang has relevance in the classification of the classes SI and LP. Then, it could be assumed that only these two features would be enough to classify the 4 classes of defects, but the evalu-ation of the classifier for these two features shows that the Figure 3. Example of one IIW pattern used and automatic
extrac-tion of the features.
performance obtained was 87.5%, which is a consistent re-sult, considering the small amount of information supplied to the classifier.
After that, in order to improve the classification perform-ance, another feature was added to the classifier. As Table 1 shows, the feature R has relevance in the classification of the classes LP, PO and SI. So, once again the classifier is evaluated, but now with AB, Ang and R as the input data. The result obtained in this case was 93.33%, increasing sig-nificantly the performance of the classification system. Keeping the same idea, one more feature (R/r) was added to the classifier, as it has relevance to classify the classes UC and PO. With the features AB, Ang, R and R/r, the per-formance increased, reaching 97.5%. Giving continuity to the evaluation, the feature As was included, and the per-formance was also 97.5%. Then, it can be concluded that the feature As does not add any relevant information. So, it was decided to remove the feature R/r, as the feature As classifies the same classes as the feature R/r. In this case, the performance of the classifier with the features As, AB, Ang and R was 99.16%, that is, approximately the same performance obtained with the 8 features. So, it follows that evidently what really matters is the “quality” of the features used, that is, the relevance of the features in the classifica-tion of the defect classes here studied. The obtained result is excellent, because it provided the reduction in the data dimension of 50% for a performance of about 100% in the classification of the classes here studied. It is important to point out that the dimensionality reduction in multivariate systems and the intelligent use of data constitute in one of the most studied areas nowadays in pattern recognition.
It is also used to evaluate the nonlinear classifier with an test set (an input vector that was not used at the training step), because it is important to evaluate the generalization capability of the neural network. It was not possible at this work as there were not sufficient data.
An analysis can also be done by using the correlation between one feature and another. Thus, if two features are strongly correlated, the exclusion of either feature probably will not affect the classification significantly, as there might be a large amount of redundant information being provided to the classifier. This fact could be confirmed with the fea-tures As and R/r, as the exclusion of R/r did not affect the classification. This technique has already been analyzed by Silva8 applied to other features, but new features were in-vestigated in this study, presenting important results that can be used in a pattern recognition system.
There are other techniques that can be applied to reduce the input dimension of the classifier and evaluate the rel-evancy of each feature. A technique, which is also imple-mented by neural network, is described by Seixas12.
Extraction of features from radiographic images is not an easy task, since errors may occur in the measurement process. So, the question that arises is to find out what is the best cost-benefit ratio, that is, how to obtain the best preci-sion rate to meet the requirements of the problem in ques-tion as practically as possible.
6. Conclusions
The technique of linear correlation between one feature and another and between features and classes of defects showed that it is really possible to reduce the dimensionality of the data set used, because there is a higher relevance of some features to classify certain classes and the linear cor-relation between one feature and another shows redundancy of information being offered to the classifier.
The results obtained in this work confirmed the others results which were published by Silva8, however, in this work, some different features were obtained by automatic extraction. The main conclusion is that it is possible to project a system of classification of welding defects using a reduced number of relevant features.
Table 1. Matrix of correlation with the correlated features.
Features Defects
0.18 0.37 0.36 0.36 0.36
As AB X/Y Ang R/r R F D LP UC PO SI
As 1 -0.133 0.492 -0.377 0.017
AB -0.406 1 0.440 -0.757 0.440 -0.118
X/Y 0.493 -0.528 1 -0.226 0.696 -0.258 -0.214
Ang 0.140 -0.001 0.278 1 0.407 0.225 -0.241 -0.387
R/r 0.393 -0.340 0.288 0.152 1 -0.188 0.396 -0.362 0.152
R 0.131 -0.232 0.322 0.468 -0.021 1 0.537 0.321 -0.475 -0.377
F 0.034 0.082 0.070 0.049 0.092 0.060 1 0.049 0.006 0.049 -0.104
Acknowledgements
Authors wish to acknowledge CNPq, CAPES and FAPERJ for the financial support and scholarships and the International Institute of Welding for permission given to publish the present study using the radiographic standards.
References
1. Mery, D. Processing Digital X-ray Images and Its Ap-plications in the Automated Visual Inspection of Aluminum Casting, 3rd Pan American Conference for Nondestructive Testing – PANNDT, Rio de Janeiro – RJ, June 2003.
2. Liao, T.W.; Tang, K. Automated Extraction of Welds from Digitized Radiographic Images Based on MLP Neu-ral Networks. Applied Artificial Intelligence, v. 11, p. 197-218, 1997.
3. Kato, Y.; Okumura, T.; Matsui, S. et al. Development of an Automatic Weld Defect Identification System for Radiographic Testing. Welding in the Word, v. 30, n. 7-8, p. 182-188, 1992.
4. Silva, R.R. Radiographic Image Processing and Analy-sis of Defects in Weld Bead. Master’s Degree. PEMM/
COPPE/UFRJ. RJ, Brazil,1999. (In Portuguese). 5. Gonzalez, R.C.; Woods, R.E. Digital Image Processing, 1a
edição, USA, Addison-Wesley Publishing Company, 1992. 6. Bishop, C.M. Neural Networks for Pattern Recognition.
New York, Oxford University Press, 1995.
7. Siqueira, M.H.S. Inspeção em Grandes Distâncias Utilizando Ondas Ultra-Sônicas Guiadas e Inteligência Artificial, Tese D.Sc., PEMM/COPPE/UFRJ, Rio de Ja-neiro, JaJa-neiro, 2002.
8. Silva, R.R.; Calôba, L.P.; Siqueira, M.H.S. et al., Evalua-tion of the Relevant Characteristic Parameters of Welding Defects and Probability of Correct Classification Using Linear Classifiers, Insight, v. 44, n. 10, Outubro, 2002. 9. Chatfield, C.; Collins, A.J. Introduction to Multivariate
Analysis, Chapman and Hall, USA, 1980.
10. Mandelbrot, B.B. Fractal Geometry of Nature, W.H. Freeman and Co., New York, 1983.
11. Haykin, S. Neural Networks, A Comprehensive Foun-dation, Macmillian College Publishing. Inc., 1994. 12. Seixas, J.M.; Calôba, L.P.; Delpino, I. Relevance