anD chemical propertieS of the Soil by
electromagnetic inDuction
flavia cristina machado(1), rafael montanari(2)*, luciano Shozo Shiratsuchi(3), lenon
henrique lovera(4) and elizeu de Souza lima(4)
(1) Universidade Estadual de Mato Grosso do Sul, Unidade de Aquidauana, Programa de Pós-graduação em Produção Vegetal, Aquidauana, Mato Grosso do Sul, Brasil.
(2) Universidade Estadual Paulista “Júlio de Mesquita Filho”, Campus de Ilha Solteira, Departamento de Fitossanidade, Engenharia Rural e Solos, Ilha Solteira, São Paulo, Brasil.
(3) Empresa Brasileira de Pesquisa Agropecuária, Centro Nacional de Pesquisa Agrossilvipastoril, Sinop, Mato Grosso, Brasil. (4) Universidade Estadual Paulista “Júlio de Mesquita Filho”, Campus de Ilha Solteira, Programa de Pós-graduação em Sistemas de
Produção, Ilha Solteira, São Paulo, Brasil. *Corresponding author.
E-mail: montanari@agr.feis.unesp.br
abStract
brazilian soils have natural high chemical variability; thus, apparent electrical conductivity (eca) can assist interpretation of crop yield variations. We aimed to select soil chemical properties with the best linear and spatial correlations to explain eca variation in the soil using a Profiler sensor (EMP-400). The study was carried out in Sidrolândia, MS, Brazil. We analyzed the following variables: electrical conductivity - EC (2, 7, and 15 kHz), organic matter, available K, base saturation, and cation exchange capacity (cec). Soil eca was measured with the aid of an all-terrain vehicle, which crossed the entire area in strips spaced at 0.45 m. Soil samples were collected at the 0-20 cm depth with a total of 36 samples within about 70 ha. Classical descriptive analysis was applied to each property via SAS software, and gS+ for spatial dependence analysis. the equipment was able to simultaneously detect ECa at the different frequencies. It was also possible to establish site-specific management zones through analysis of correlation with chemical properties. We observed that cec was the property that had the best correlation with ECa at 15 kHz.
Keywords: precision agriculture, electrical conductivity, management zones.
introDuction
Precision agriculture can be described as production management taking into account the spatial variability of yield and its related factors. It is a relatively new field of research in agricultural sciences, and provides promising perspectives for generation of new technology and crop management alternatives, as well as potential environmental benefits (Faulin, 2005).
Homogeneous areas within a field are difficult to identify due to the complex combination of factors that may influence crop yield. Correlations between yield (dependent variable) and production factors (e.g., soil fertility) are quite low (Molin et al., 2001); and attempts to explain local phenomena with few factors have been unsuccessful.
Several methods have been proposed to define management zones, among them, the use of topography, aerial photographs, crop canopy imaging, and remote sensing, in addition to crop yield mapping, which is currently most known among these sources of information (Molin, 2001).
Studies using soil apparent electrical conductivity (ECa) have shown potential in quantifying contents of clay (Williams and hoey, 1987), water (Kachanoski et al., 1988), and salt in the soil solution (Caminha Junior et al., 2000); organic matter (Jaynes, 1996); cation exchange capacity and exchangeable Ca and Mg (McBride et al., 1990), and claypan depth (Doolittle et al., 1994; Clark et al., 2000), among others. thus, it may be possible to measure the ECa rapidly and at low cost so as to georeference soil properties that affect crop yield (Bronson et al., 2005). Several types of equipment are commercially available for in situ measurement of ECa, for example, the MuCEP, the Veris 3100,
the Soil Doctor, the EM 38, the GEM 300, and the Profiler EMP400.
Soil ECa is controlled by a series of factors, among which are salt content, clay mineralogy, soil moisture, and soil temperature (Brevik et al., 2006). Netto et al. (2007) observed significant correlation between ph and exchangeable Na concentration, confirming positive and significant correlation between ECa and soil salt content. King et al. (2005) used an electromagnetic current sensor in an experimental field at two periods in the year that exhibit extreme values for soil moisture, field capacity, and permanent wilting point, showing ECa stability in both situations, despite significant differences in absolute terms.
Measurement of spatial and time variability of soil properties influencing crop yield for the purpose of optimizing the use of natural resources, reducing costs, and improving soil quality is of utmost importance for technological advancement of agriculture (Montanari et al., 2010). Spatial variations may be analyzed via geostatistics, which allow maps to be drawn up marking off areas of site-specific management (Dalchiavon et al., 2013).
Geostatistical analysis is a tool for evaluating the spatial variability of assessed and mapped soil properties by kriging interpolation, or even from estimates of two variables that are correlated by co-kriging. they can be described as techniques that minimize the estimated variance by regression analysis, taking dependence among data distributed in space into account. thus, kriging and co-kriging interpolations are strongly associated with models of fitted semivariograms, which may be exponential, spherical, or Gaussian, which can be evaluated by cross validation (Dalchiavon et al., 2013). Following this line, Profiler EMP400 equipment can assist reSumo: DepenDênCia espaCial Da ConDutiviDaDe elétriCa e atributos
QuímiCos Do solo por inDução eletromagnétiCa
os solos brasileiros apresentam grande variabilidade química natural e com isso a condutividade elétrica aparente (Cea) pode auxiliar na interpretação das variações de produtividade das culturas. o objetivo deste trabalho foi selecionar atributos químicos do solo com a melhor correlação linear e espacial,
para explicar a variabilidade da CEa do solo utilizando o aparelho Profiler modelo EMP-400. O estudo
foi realizado no município de sidrolândia, ms, e as variáveis avaliadas no solo foram: Ce 2 kHz, Ce 7 kHz, Ce 15 kHz, matéria orgânica, K disponível, saturação de bases e capacidade de troca catiônica (CtC). a medição da Cea do solo foi feita com auxílio de um quadricículo, percorrendo a área total com
espaçamento de 0,45 m entre passadas. As amostras de solo foram coletadas na profundidade de 0-20 cm, totalizando 36 amostras de solo em aproximadamente 70 ha. Para cada atributo analisado, realizou-se
a análise descritiva clássica, utilizando o programa SAS, e para a dependência espacial, usou-se o GS+.
o equipamento foi capaz de detectar simultaneamente as Ceas nas diferentes frequências; por meio da
análise de correlação com os atributos químicos do solo, foi possível estabelecer as zonas específicas de
manejo. o atributo do solo que melhor se correlacionou com a Cea foi a CtC, para a frequência de 15 kHz.
in reducing the number of soil samples collected, and therefore build up site-specific areas of soil management for precision farming purposes.
thus, the aims of this study were to select soil properties with the best linear and spatial correlations to explain soil ECa variability, and to collect ECa sampling data using the Profiler EMP-400 equipment.
material anD methoDS
the study was performed during the second half of 2013 on the Ribeirãozinho farm in Sidrolândia, MS, Brazil (20° 54’ 59.56” S and 54° 58’ 00.30” W). The study was carried in a field under conventional tillage and degraded grassland for 20 years. Soil at the location is classified as a Latossolo Vermelho distróférrico (Embrapa, 2013) (Oxisol) with 70 % clay content. Data collection (ECa and soil) was done after corn harvest, when soil moisture was low. A georeferenced sketch was made containing 36 points randomly distributed to cover 70 ha of the field. Soil apparent electrical conductivity (ECa) was analyzed at three frequencies (2, 7, and 15 khz), chosen because they represent the upper, lower, and middle of the frequency range available for measurement. Measurements were performed by Profiler model EMP-400 (Geophysical Survey Systems, 2006) which crossed the entire area in strips spaced at 0.45 m at 1.0 m above the ground on a PVC support on an all-terrain vehicle. Regular soil samples were also collected from the area around each sampling point at the 0-20 cm depth layer for analysis of organic matter content - OM (2.6 %), ph in CaCl2 (5.5), P
(2.9 mg dm-3), S (31.4 mg dm-3), K+ (3.6 mmol
c dm-3),
Ca2+ (60.0 mmol
c dm-3), Mg2+ (28.1 mmolc dm-3),
h+Al (40.2 mmolc dm-3), Al3+ (1.4 mmolc dm-3),
sum of bases - SB (91.8 mmolc dm-3), cation
exchange capacity - CEC (132.1 mmolc dm-3), base
saturation - V (68.8 %), and aluminum saturation - m (1.6 mmolc dm-3), according to Raij et al. (2001).
The analyses were made in the Sial Soil Laboratory in Campo Grande, MS, Brazil.
A classic descriptive analysis of the data was performed using SAS software (Schlotzhaver and Littell, 1997), in which the following numerical variables were calculated: mean, median, minimum, maximum, standard deviation, coefficient of variation, kurtosis, asymmetry, and frequency distribution. the Shapiro and Wilk test at 5 % was used to test the hypothesis of normality or log-normality of exposure distribution. In addition, a simple correlation matrix was generated to identify parameters with collinearity in paired combinations of all the properties evaluated, which led to regression analyses for pairs of greatest interest.
Each property was separately evaluated in regard to spatial dependence through calculation of the simple semivariogram, based on the intrinsic stationary hypothesis, by gamma Design software
(GS+, 2004). Semivariogram sets were fitted in
accordance with their models and were carried out primarily by initial selection of the lowest sum of squared deviations (SSD), the highest coefficient of determination (R2), and the highest spatial
dependence estimator (SDE). Final decision on the model that represented the fit was carried out by cross-validation, as well as for definition of the size of the neighboring area that provided a kriging mesh with the largest range, made by block kriging. the nugget effect (Co), range (Ao) and sill (C + Co) were registered for each property. Analysis of the SDE was made by the following expression (GS+, 2004):
SDE = [C/(C + Co)] × 100
where SDE is the spatial dependence evaluator; C, the structural variance; and C + Co, the sill.
The proposed ranking was SDE≤20 % - very low dependence, 20 %<SDE≤40 % - low dependence, 40 %<SDE≤60 % - medium dependence, 60 %<SDE≤80 % - high dependence, and 80 %<SDE≤100 % - very high dependence (Dalchiavon and Carvalho, 2012).
Cross-validation is a tool to assess alternative models of simple semivariograms for kriging. In this analysis, each point within the space is removed individually, and its value is estimated as if it did not exist. The correlation coefficient (r) of such values shows the efficiency of fit, which is calculated by the sum of squared deviations, representing the linear regression equation in question. A regression coefficient of 1 represents a perfect fit, and the line of best fit would match the perfect model, i.e., with the linear coefficient equal to zero and the slope equal to 1 (GS+, 2004).
thus, seeking an ideal number of neighboring points, we obtained, via interpolation, kriging maps to analyze spatial dependence and correlation of the properties. the geostatistical components determined for that purpose were the simple semivariogram, cross-validation, and kriging.
reSultS anD DiScuSSion
compared to this study, which was considered very high for ECa (48.16 %). As for V, the value of the coefficient of variation was considered low (10 %). According to Pimentel-Gomes and Garcia (2002), the variability of a property may be classified according to the magnitude of its coefficient of variation, being designated as low (under 10 %), medium (from 10 to 20 %), high (between 20 and 30 %), and very high (above 30 %).
Soil chemical properties such as OM, K and CEC had a medium variability -17.41, 17.87, and 16.24 %, respectively (table 1). Alves et al. (2014), working with a Latossolo Vermelho-Escuro (Oxisol), also found medium values of 17 and 12 % for OM and CEC, respectively; however, they found a high variability of 28 % for K content. Dalchiavon et al. (2011), studying spatial variability of chemical properties in a Latossolo Vermelho distroférrico (Oxisol) found medium values of 13.9 % for OM; for K and CEC, they found results of 38.5 and 24.5 %, respectively, similar to the present study.
When a statistical variable has normal frequency distribution, the most appropriate measure of the central tendency to represent it should be its mean; otherwise, it should be represented by the median (Dalchiavon et al., 2011). therefore, we used the median as the measure of the central tendency to represent properties, since the properties had indeterminate frequency, with positive coefficients of asymmetry from 0.214 to 0.682; as well as a negative coefficient of symmetry of 0.290. In contrast, the coefficient of kurtosis was positive for V (0.589), and for the other properties, it was negative, with values from -0.812 to -0.115. however, the results were not significant by the Shapiro-Wilk test at 5 % normality, since no variation was observed, and all values were smaller than 0.0001 (table 1). thus, indeterminate frequency distribution of the properties, as well as the magnitude of the
coefficients of Kurtosis and asymmetry were generally in accordance with Dalchiavon et al. (2011), who observed indeterminate distribution for chemical properties in a Latossolo Vermelho distroférrico under a no-tillage system in Mato Grosso do Sul, Brazil.
ECa median values increased along with an increase in applied frequency, at -324.10 dS m-1 for
2 khz; -85.23 dS m-1 for 7 khz, and -34.39 dS m-1
for 15 khz. Molin et al. (2005), studying the ECa of a soil measured via electromagnetic induction in a Latossolo Vermelho (Oxisol), found a median value of -61.0 dS m-1 at 15 khz, in disagreement
with our study. For OM, K, V, and CEC, median values were 2.56 %, 3.64 mmolc dm-3, 69.08 %, and
132.67 mmolc dm-3, respectively (table 1). the
OM values are under the optimal value (2.5 %) as recommended by Raij et al. (2011). yet for K, the value was appropriate, at 3.64 mmolc dm-3. these
OM and K values are similar to those obtained by Dalchiavon et al. (2011), which were 2.5 % and 5.0 mmolc dm-3, respectively. For its part, the V
had a high median value of 69.08 %, corroborating Mattioni et al. (2013), who found a median of 70.7 % in a hapludox. For CEC, a median of 133 mmolc dm-3
was found, possibly due to the soil being a highly weathered Oxisol. Souza et al. (2006), Gomide et al. (2011) and Mattioni et al. (2013), studying the variability of chemical properties of Oxisols also found high median values of CEC of 106, 147, and 145 mmolc dm-3, respectively.
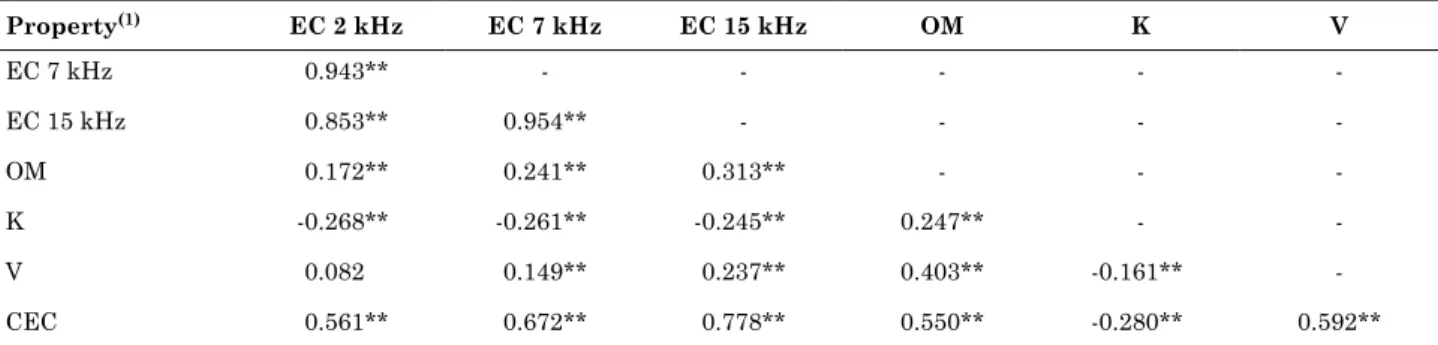
Correlations between ECa and soil chemical properties had greater significance for OM and CEC at 2, 7, and 15 khz (table 2). All ECa correlations were positive, except for those with available K, in which the correlation was inverted. As frequency increased, ECa correlation with the soil chemical properties also increased.
Castro (2004) found correlation coefficients of 0.74, 0.81, and 0.73 for CEC, K, and V, respectively, when assessing ECa correlation with physical and
table 1. Descriptive analysis of electrical conductivity of some chemical properties of a latossolo vermelho distroférrico (Oxisol) in Sidrolândia, MS
property(1) mean median value SD(2) Coefficient probability test
(3)
minimum maximum variation Kurtosis asymmetry pr<w fD
%
table 2. linear correlation matrix between electrical conductivity and some chemical properties of a Latossolo Vermelho distroférrico (Oxisol) in Sidrolândia, MS
property(1) EC 2 kHz EC 7 kHz EC 15 kHz om K v
EC 7 khz 0.943** - - - -
-EC 15 khz 0.853** 0.954** - - -
-OM 0.172** 0.241** 0.313** - -
-K -0.268** -0.261** -0.245** 0.247** -
-V 0.082 0.149** 0.237** 0.403** -0.161**
-CEC 0.561** 0.672** 0.778** 0.550** -0.280** 0.592**
(1) EC, OM, K, V, and CEC are electrical conductivity, organic matter, potassium, base saturation, and cation exchange capacity, respectively, collected at the 0-20 cm depth.) * and **: significant at 5 and 1 %, respectively.
CE 2 Hz
CEC (mmolc/dm
3)
CEC (mmolc/dm
3)
OM (%)
CEC = 490.6 + 1.108**CE2Hz
r = 0.560** 300
200
100 250
150
50
0
-345 -335 -325 -315 -305 -295
CE 7 Hz CEC = 364.5 + 2.752**CE7Hz
r = 0.672**
200
150
100
50
-95 -90 -85 -80 -75 -70
CE 15 Hz CEC = 278.5 + 4.327**CE15Hz
r = 0.778**
250
200
100 150
50
-40 -35 -30 -25 -20
CE 2 Hz OM = 4.926 + 0.007**CE2Hz
r = 0.414** 4.5
3.5
2.5
2 4
3
1.5
-350 -340 -330 -320 -310 -300 -290
OM (%)
CE 7 Hz OM = 4,358 + 0.020**CE7Hz
r = 0.241**
-95 -90 -85 -80 -75 -70
CE 15 Hz OM = 3.844 + 0.036**CE15Hz
r = 0.313** 4.5
3.5
2.5
2 4
3
1.5 4.5
3.5
2.5
2 4
3
1.5 -40
(a) (b)
(c) (d)
(e) (f)
-35 -30 -25 -20
chemical properties of a Latossolo Vermelho-Escuro distroférrico (Oxisol). there was agreement with the present study only for the CEC property; the other coefficients were higher than the ones found in this study. Salton et al. (2011), working with ECa data in an Oxisol under conventional tillage, found correlation coefficients of 0.059, 0.669, 0.546, and 0.160 for K, CEC, V, and MO, respectively, with values for the CEC properties and MO near those found in this study. Only for CEC, there was an agreement with our study, being the other properties higher than the ones found in this research. Salton et al. (2011), evaluating an Oxisol under conventional tillage, found correlation coefficients of 0.059, 0.669, 0.546, and 0.160 for K, CEC, V, and OM, respectively, with values for the CEC properties and OM near the ones found in this study.
Figure 1 shows the regression equations among the properties studied. For hopkins (2000), coefficients of correlation higher than 0.5 indicate strong correlation, and below this value they are regarded as weak. Thus, figures 1a, 1b and 1c indicate strong correlation, and figures 1d, 1e, and 1f shows correlations seen as weak, but still highly significant.
By geostatistical analysis, a spatial difference may be seen for all the properties studied (table 3). the semivariograms of ECa 2 and 7 khz were fitted to the spherical model, K was fitted to the exponential model, and ECa 15 khz, OM, V, and CEC were fitted to the Gaussian model. Freddi et al. (2009) found a Gaussian model for OM and V in a Latossolo Vermelho (Oxisol), corroborating this study. however, these authors found exponential and spherical models for K and CEC, respectively; which differed from the models listed in table 3. By comparing these models with those described by
Souza et al. (2006) in a Latossolo (Oxisol), there is only similarity for the K property, which also had a spherical model.
Regarding semivariogram performances, values of the spatial determination coefficient (R2) in
decreasing order were V (0.999), 2 khz (0.998), 7 khz (0.996), CEC (0.996), 15 khz (0.993), OM (0.993), and K (0.982). Concerning SDE, the strong dependence (SDE = 99.9 %) found in this study is similar to that observed by Dalchiavon et al. (2012), of 92.1 %, but it was best fitted to a spherical model.
table 3 shows the values of range, in decreasing order, which were 7 khz (1,229 m), 2 khz (1,095 m), 15 khz (1,002 m), K (954 m), CEC (905 m), OM (431 m), and V (363 m). Based on these results, further studies that use geostatistical meshes and distances between points similar to the ones used in this study are suggested. Moreover, range values to be used in geostatistical evaluations in precision agriculture, in general, should be from 431 to 1,229 m, since this variation represents the distance within which values of a given property are equal (Cambardella et al., 1994; Campos et al., 2007; Martins et al., 2009; Dalchiavon et al., 2011).
When comparing the kriging maps (Figure 2), a spatial similarity among ECa at 2, 7, and 15 khz can be noted. Thus, in figures 2a, 2b, and 2c, the lowest values of ECa (-43.5 -337 dS m-1) were seen
within the northern region. however, the highest values observed for OM were within the central region (Figure 2d). By comparing the maps of ECa, it can be concluded that the highest values of OM and ECa were seen separately for the southern region (Figures 2a, 2b, 2c, 2d). Yet in figure 2e, 2f, and 2g, the highest values were found in the western, eastern, and eastern regions of the maps, respectively, representing most of the area.
Table 3. Fit parameters of the semivariograms and cross-validation for electrical conductivity and some chemical properties of a Latossolo Vermelho distroférrico in Sidrolândia, MS
property(1) model c
o c+co ao r2 SSr(2)
SDe(3) Cross-validation
% class a b r
m
EC 2 khz Spherical 8.10 1.68 × 10² 1,095 0.998 1.34 × 10² 95.2 Vh -1.38 0.996 0.917 CE 7 khz Spherical 3.0×10⁻¹ 4.30 × 10 1,229 0.996 1.49 × 10 99.3 Vh -0.55 0.994 0.951 CE 15 khz Gaussian 2.32 2.34 × 10 1,002 0.993 8.06 90.1 Vh 1.95 1.058 0.947
483058 481606
7663968
7665573 2 Hz (dS m-1)
>-312 >-325 >-337 (a)
Distance (m)
483058 481606
7663968
7665573 15 Hz (dS m-1)
>-31.5 >-37.5 >-43.5 (c)
Distance (m) 483058
481606 7663968
7665573 K (mg dm-3)
>4.59 >3.44 >2.30 (e)
Distance (m)
Distance (m) 483058
481606 7663968
7665573 CEC (mg dm-3)
>156 >125 >93 (g)
483058 481606
7663968
7665573 7 Hz (dS m-1)
>-79.3 >-85.3 >-91.4 (b)
483058 481606
7663968
7665573 OM (%)
>3.19 >2.49 >1.80 (d)
Distance (m) 483058
481606 7663968
7665573 V (%)
>73.2 >63.7 >54.1 (f)
concluSionS
the properties of apparent electrical conductivity (ECa) at 2, 7, and 15 khz, organic matter, available K, base saturation, and cation exchange capacity did not vary at random and exhibited low to medium linear data variability.
CEC was the soil property with the greatest correlation with ECa, and among the frequencies studied, 15 khz had the highest correlation.
the properties ECa (2, 7, and 15 khz), OM, K, V, and CEC exhibited spatial variability of the data and spatial dependence ranges from 363 to 1,229 m.
The EMP-400 Profiler equipment was capable of detecting ECa’s at various frequencies simultaneously and, through correlation analysis with soil chemical properties, it was possible to establish homogeneous zones for site-specific soil management.
referenceS
Alves SMF, Queiroz DM, Alcântara GR, Reis EF. Variabilidade espacial de atributos físico-químicos do solo usando técnicas de análise de componentes principais e geoestatística. Biosci J. 2014;30:22-30.
Bernardi ACC, Rabello LM, Inamasu LY, Grego CR, Andrade
RG. Variabilidade espacial de parâmetros físico-químicas do solo e biofísicos de superfície em cultivo do sorgo. R Bras Eng Agríc Amb. 2014;18:623-30.
Brevik E, Fenton T, Lazari A. Soil electrical conductivity as a
function of soil water content and implications for soil mapping. Precision Agric. 2006;7:393-404.
Bronson K, Booker J, Officer S, Lascano R, Maas S, Searcy S,
Booker J. Apparent electrical conductivity, soil properties and spatial covariance in the U. S. Southern high Plains. Precision Agric. 2005;6:297-311.
Cambardella CA, Moorman tB, Novak JM. Field-scale variability of soil properties in central Iowa soils. Soil Sci Soc Am J. 1994;58:1501-11.
Caminha Junior IC, Seraphim OJ, Gabriel LRA. Caracterização
de uma área agrícola irrigada com efluente agroindustrial, através de análises químicas e da resistividade do solo. Energ Agric. 2000;13:40-54.
Campos MCC, Marques Júnior J, Pereira Gt, Montanari R, Siqueira DS. Variabilidade espacial da textura de solos de diferentes materiais de origem em Pereira Barreto, SP. R Ci Agron. 2007;38:148-57.
Castro CN. Definição de unidades de gerenciamento de solo por
meio de sua condutividade elétrica e variáveis físico-químicas
[dissertação]. Piracicaba: Escola Superior de Agricultura Luiz
de Queiroz; 2004.
Clark RL, Chen F, Kissel DE, Adkins W. Mapping soil hardpans
with the penetrometer and electrical conductivity. In: Proceedings of the 5th International Conference on Precision Agriculture [CD-ROM]; 2000; Minneapolis. Minneapolis: 2000.
Dalchiavon FC, Carvalho MP, Andreotti M, Montanari R.
Variabilidade espacial de atributos da fertilidade de um Latossolo
Vermelho Distroférrico sob Sistema Plantio Direto. R Ci Agron. 2012;43:453-61.
Dalchiavon FC, Carvalho MP, Freddi OS, Andreotti M, Montanari R. Variabilidade espacial da produtividade do feijoeiro
correlacionada com atributos químicos de um Latossolo Vermelho
distroférrico sob sistema de semeadura direta. Bragantia. 2011;70:1-9.
Dalchiavon FC, Carvalho MP, Montanari R, Andreotti M.
Strategy of specification of management areas: rice grain yield
as related to soil fertility. R Bras Ci Solo. 2013;37:45-54. Dalchiavon FC, Carvalho MP. Correlação linear e espacial dos componentes de produção e produtividade da soja. Semina: Ci Agron. 2012;33:541-52.
Doolittle JA, Sudduth KA, Kitchen NR Indorante SJ. Estimating depths to clay pans using electromagnetic induction methods. J Soil Water Conserv. 1994;49:572-5.
Empresa Brasileira de Pesquisa Agropecuária - Embrapa. Sistema brasileiro de classificação de solos. 3ª.ed. Brasília: Embrapa Solos; 2013.
Faulin GDC. Variabilidade espacial do teor de água, sua influência
na condutividade elétrica do solo [dissertação]. Piracicaba: Escola
Superior de Agricultura Luiz de Queiroz; 2005.
Freddi OS, Centurion JF, Duarte AP, Peres FSC. Compactação
do solo e produção de cultivares de milho em Latossolo Vermelho.
II - Intervalo hídrico ótimo e sistema radicular. R Bras Ci Solo. 2009;33:805-8.
Geophysical Survey Systems. Profiler EMP-400. Nashua, NH, [US]: The World Leader in Subsurface Imaging; 2006.
Gomide PHO, Silva MLN Soares CRFS. Atributos físicos,
químicos e biológicos do solo em ambientes de voçorocas no
município de Lavras - MG. R Bras Ci Solo. 2011;35:567-77.
GS+: Geostatistics for environmental sciences. 7th.ed. Plainwell: Gamma Desing Software; 2004.
Hopkins WG. Correlation coefficient: a new view of statistics. 2000.
[Accessed Apr 18, 2000] Available at: http://sportsci.org/resource/stats. Jaynes DB. Improved soil mapping using electromagnetic induction surveys. In: Proceedings of the 3rd International Conference on Precision Agriculture; 1996; Minneapolis. Minneapolis: 1996.
Kachanoski RG, Gregorich EG, van wesenbeck IJ. Estimating spatial variations of soil water content using noncontacting eletromagnetic inductive methods. Can J Soil Sci. 1988;68:715-22.
King J, Dampney P, Lark R, Wheeler H, Bradley R, Mayr T. Mapping potential crop management zones within fields: use
of yield map series and patterns of soil physical properties
identified by electromagnetic induction sensing. Precision Agric.
2005;6:167-81.
Martins MV, Carvalho MP, Andreotti M, Montanari R. Correlação linear e espacial entre a produtividade do feijoeiro e atributos
físicos de um Latossolo Vermelho distroférrico de Selvíria, Estado
de Mato Grosso do Sul. Acta Sci Agron. 2009;31:147-54.
Mattioni NM, Schuch LOB, Villela FA. Variabilidade espacial e efeito de atributos químicos de um Latossolo na população de
Mcbride SD, Nguyen ML, Rickard DS. Implications of
ceasing annual superphosphate topdressing applications on pasture production. Proc New Zeal Grassland Assoc. 1990;46:199-202.
Molin JP, Couto HTZ, Gimenez LM, Pauletti V, Molin R, Vieira
SR. Regression and correlation analysis of grid soil data versus cell spatial data. In: Proceedings of the 3rd European Conference on Precision Agriculture [CD-ROM]; 2001; Montpelier. Montpelier: AgroMontpelier; 2001.
Molin JP, Gimenez LM, Pauletti V, Schmidhalter U,
hammer J. Mensuração da condutividade elétrica do solo por indução e sua correlação com fatores de produção. Eng Agríc. 2005;25:420-6.
Montanari R, Carvalho MP, Andreotti M, Dalchiavon FC,
Lovera LH, Honorato MAO. Aspectos da produtividade do feijão
correlacionados com atributos físicos do solo sob elevado nível tecnológico de manejo. R Bras Ci Solo. 2010;34:1811-22.
Netto AOA, Gomes CCS, Lins CCV, Barros AC, Campeche LFSM, Blanco FF. Características químicas e salino-sodicidade
dos solos do perímetro irrigado Califórnia, SE, Brasil. Ci Rural. 2007;37:1640-5.
Pimentel-Gomes FP, Garcia Ch. Estatística aplicada a
experimentos agronômicos e florestais. Piracicaba: FEALQ; 2002.
Raij B van, Andrade JC, Cantarella h, Quaggio JA. Análise química para avaliação da fertilidade de solos tropicais. Campinas: Instituto Agronômico de Campinas; 2001.
Raij Bvan. Fertilidade do solo e manejo de nutrientes. Piracicaba: IPNI, 2011.
Salton JC, Tomazi M, Comunello E, Zanatta JÁ, Rabello L.
Condutividade elétrica e atributos físicos e químicos de um
Latossolo após 15 anos sob sistemas de manejo em Mato Grosso do Sul. In: Inamasu RY, Naime JM, Resende AV, Bassoi LH,
Bernardi ACC, editores. Agricultura de precisão: um novo olhar. São Carlos: Embrapa Instrumentação, 2011. p.254-60.
Schlotzhaver SD, Littell RC. SAS system for elementary statical
analysis. 2nd.ed. Cary: SAS Institute; 1997.
Souza ZM, Marques Júnior J, Pereira Gt, Montanari M.
Otimização amostral de atributos de Latossolos considerando
aspectos solo-relevo. Ci Rural. 2006;36:829-36.