1 INTRODUCTION
Several instruments and standards have been introduced in the last decades to assess environ-mental management performance and efficiency of products and companies, such as life cycle assessment (LCA), eco-labels, environmental management systems (EMS) and environmental certificates and register (ISO 14001 and EMAS standards).
Global Reporting Initiative (GRI) has been working on a common framework for environ-mental, social and economic voluntary reports. It has published guidelines to promote compara-bility of sustainacompara-bility reports and to support benchmarking (GRI, 2002, GRI, 2006). The World Business Council for Sustainable Development has also published a list of selected indicators, focusing on eco-efficiency (WBCSD, 2000).
Existing standards are much more management-directed than environment-directed. The re-sult is that, although there is abundant literature on environmental performance, it is far from standardized and little of it is actually applied on day-to-day management (Melo, 2002).
Many countries have regulations imposing environment-related information on specific cate-gories of products, such as energy consumption in appliances and vehicles. Technical notices will have more or less detailed data, but usually the label on the product only bears qualitative information. Typically, labels and technical notices provide little information on environmental effects caused by manufacture, use or disposal of the product. Most eco-labels do not provide quantitative environmental information at all – either the logo is there, or it is not – which makes it difficult to distinguish between two labelled products.
More precise information about environmental effects related to a product can be obtained through LCA which is commonly used for product and process design and for eco-labeling. However, this method is very expensive because it is data-intensive and time-consuming, thus limiting its use; another limitation is that broader issues such as impact acceptability are not usually taken into account (Curran, 1996; Das, 2005).
Application of the EcoBlock method to eco-design – electric hand
dryers versus paper towels
J. Joanaz de Melo, L. Macedo & A. Galvão
New University of Lisbon, Caparica, PortugalIn short, no method currently in use allows an easy comparison of environmental perform-ance of different products and organizations, nor an easy link between company performperform-ance and product labelling.
This paper introduces a method for environmental performance evaluation throughout the supply-demand chain – the EcoBlock method.
2 THE ECOBLOCK METHOD 2.1 General principles
The EcoBlock method aims to answer the following brief: to assess the environmental influence of a company or a product with a quantified and life-cycle oriented approach, following a clear and standardized method in a cost-effective way.
EcoBlock indicators were defined under the following general principles: − Focus on environmental pressure;
− Small number of indicators covering a wide range of environmental issues;
− Correlation with relevant environmental effects, although not pretending to evaluate envi-ronmental impacts as such;
− Expression in easily recognizable physical units;
− Ability to describe environmental performance both at product level (goods or services) and at organization level (company or institution);
− Applicability to a wide range of activities and products;
− Data easily gathered from common organization-level EMS or from public record;
− Additive, that is, the sum of indicator values for two separate activities should be equal to the indicator value computed for both activities managed together.
These features are essential to define a method that can be widely applied, standardized and – very important – that allows the transfer of comparable environmental performance information along the supply-demand chain.
The method should be able to support a number of practical applications: − Standardize environmental labelling of products (goods or services);
− Simplify LCA, because comparable environmental information comes attached – as an “EcoBlock label” – to the products acquired to manufacture the product under study (this will not be as accurate as full LCA, but will be enough for many applications);
− Benchmarking or environmental reporting;
− Implement environmental performance control of suppliers; − Compare different design solutions for new projects.
2.2 The EcoBlock indicators
The literature shows three main types of indicators to assess environment-related performance: management efficiency, environmental impact and environmental pressure. The EcoBlock method adopts pressure indicators because they are environmentally significant and relatively easy to measure and standardize, although they integrate less local or impact information.
The selected indicators are water abstraction, resource extraction, land use, greenhouse gases, polluting emission to water and to air and waste committed to long-term storage. Data to com-pute EcoBlock indicators can be easily obtained from typical EMS records, such as water and energy use, waste sampling, raw materials listings.
Each indicator is computed from directly measured variables, weighted by an equivalence factor (feq) that conveys the environmental significance of each variable. The equivalence fac-tors are always based on objective criteria, preferably technical or legal standards when avail-able, and reject subjectivity.
EcoBlock indicators are given by the following general equation: I = Σ Qi . feq i
fac-tor for gas i). All equivalence facfac-tors are based on objective criteria, as far as possible based on comparable effects (Macedo, 2005).
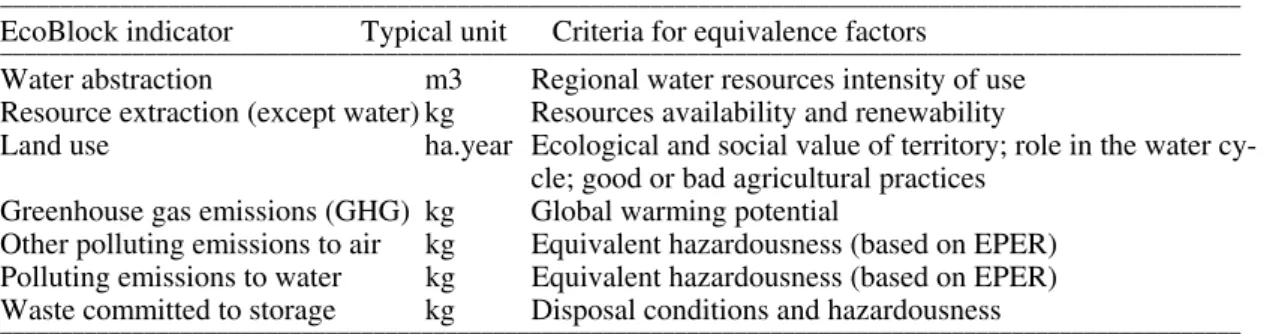
Table 1 presents the criteria for equivalence factors for each indicator. Table 1. EcoBlock indicators and estimation criteria
_______________________________________________________________________________________________________ EcoBlock indicator Typical unit Criteria for equivalence factors
_______________________________________________________________________________________________________
Water abstraction m3 Regional water resources intensity of use
Resource extraction (except water) kg Resources availability and renewability
Land use ha.year Ecological and social value of territory; role in the water cy-cle; good or bad agricultural practices
Greenhouse gas emissions (GHG) kg Global warming potential
Other polluting emissions to air kg Equivalent hazardousness (based on EPER) Polluting emissions to water kg Equivalent hazardousness (based on EPER) Waste committed to storage kg Disposal conditions and hazardousness
_______________________________________________________________________________________________________
It should be noted that the EcoBlock set does not include energy consumption as such. This is of course an important indicator, widely used in management performance. However, energy-related environmental impact is widely variable as a function of energy source and, in current energy systems, it is highly correlated to GHG emissions; it can also easily be expressed as EcoBlock indicators. Therefore we use energy as a proxy to compute the EcoBlock indicators as appropriate.
The EcoBlock method is highly compatible with GRI and WBCSD guidelines. The three sys-tems use environmental performance indicators, especially pressure indicators, and all of them need identical data, allowing companies to reach the objectives of several methodologies with almost the same data. The EcoBlock method has the advantage of simplifying data presentation and comparison because of the reduced number of indicators.
2.3 EcoBlock Index
When dealing with eco-design or supplier environmental performance, the seven-indicator EcoBlock vector is not enough: a single index may be called for. It should be noted that this in-dex will not be as consistent as the seven individual indicators.
To express the EcoBlock global index, we have chosen the “global area” under the Ecologi-cal Footprint (EF) concept, because it is rather intuitive and well known, and compatible with the EcoBlock logic of standardizing information.
The major differences between the EcoBlock and EF methods are: (i) the EF has a top-down approach, directed at countries and life-styles, while the EcoBlock is aimed at products and or-ganisations; (ii) the EF does not account for variables that are essential in product and organisa-tion environmental performance, such as polluorganisa-tion, water abstracorganisa-tion or mineral resource extrac-tion (Venetoulis, 2004, WWF, 2004). These differences represent as many difficulties when converting EcoBlock indicators into “global area”.
Here we propose a tentative approach to this difficult issue: The “resource” EcoBlock indica-tors – water abstraction, resource extraction and area – will be converted into global area by as-suming that the land available for biological production serves simultaneously those three func-tions; The GHG indicator is directly converted with the world average of carbon capture assumed in the EF method; The water and air pollution indicators are converted using the con-cept of the virtual global area theoretically needed to absorb such pollution, in the same way that it is applied in the GHG indicator. We are aware that part of the pollution is actually ab-sorbed or rendered innocuous by real land, already accounted for. For simplicity, we have com-pared GHG and other pollution according to the report limits of EPER – the European Pollutant Emissions Register. The long-term waste storage is converted by relating it to an estimation of land influenced by such storage.
Table 2. Conversion coefficients to compute the EcoBlock index
_______________________________________________________________________________________________________ Water Resources Land use GHG Oth.air pollut. Water pollut. Solid waste (glob m2/m3) (glob m2/kg) (glob m2/m2) (glob m2/kgCO
2) (glob m2/gNO2) (glob m2/gCOT) (glob m2/kg)
_______________________________________________________________________________________________________ 4.5 5.5 0.16 3.0 3.0 2.8 0.1 _______________________________________________________________________________________________________
Because mineral extraction and most of the pollution are not accounted for in the EF, when we convert all EcoBlock indicators into “global area”, the final result will usually be higher than using the classical EF method. This is, indeed, an intended feature of the EcoBlock global in-dex, although research is underway to establish a more robust relationship.
2.4 Case-studies
The EcoBlock method has been extensively tested in Portugal, with several types of case-studies. A national survey was conducted among the construction business in Portugal, covering the whole life cycle of materials and buildings. Results from this survey have been reported be-fore (Melo, 2002).
3 CASE STUDY: ELECTRIC HAND DRYERS VERSUS PAPER TOWELS 3.1 Scope and general criteria
The aim of this case study was to compare the environmental performance of electric dryers and paper towels in the sanitary facilities of shopping centers. Data were provided by the shopping center operator, Sonae Sierra, and from available literature.
Several shopping centers were analyzed, although one of them, located in Lisbon, was se-lected as the main case study due to overall consistency of available data and because it uses both paper towels and electric dryers. Data on visitors to shopping centers were available. It was assumed that one out of three visitors will use the W.C. and hence will wash and dry his/her hands.
Environmental performance data, relevant for the life cycle assessment of both technologies (electric dryers and papers towels) were gathered from Portuguese national statistics, reports and literature. The results are deemed to be representative for Portugal. The analysis and aggre-gation of environmental information followed the EcoBlock method as described above.
3.2 Electricity generation
Environmental pressure from electricity production and distribution was computed from the fol-lowing sources and criteria: official national data on atmospheric pollution from thermal power plants and oil refineries (APA, 2007); official electricity production and distribution data, in-cluding amount of fuels consumed (DGEG, 2007); pollutant emissions from coal extraction from Australia (one of the major coal exporters to Portugal); atmospheric emissions from the maritime transport of coal and oil; water consumption in power plants (INAG, 2004); water evaporated from reservoirs used for electricity generation and land occupied by reservoirs (INAG, 2007); waste generated by power plants.
Power plant construction, general maintenance and non-consumptive uses of water were not in-cluded in the analysis.
The results are shown in Table 3.
Table 3. Environmental pressures from electricity as acquired from the public electrical grid in continen-tal Portugal (EcoBlock indicators)
_______________________________________________________________________________________________________ Water Resources Land use GHG Oth.air pollut. Water pollut. Solid waste (dm3/kWh) (g/kWh) (dm2/kWh) (g CO2/kWh) (g NO2/kWh) (g COT/kWh) (g/kWh)
_______________________________________________________________________________________________________
14.5 196 7.10 589 7.11 0.0282 0.760
3.3 Electric dryers
Only the electric dryer model in use in the shopping centers selected was analyzed. An estima-tion of composiestima-tion of the apparatus and environmental implicaestima-tions of its manufacturing was performed, based on technical specifications and available literature on materials extraction and production. Major materials are steel, copper, aluminum and plastics. An average of five years life time for a dryer was assumed, based on maintenance registers.
Electricity consumption of the dryer was assumed as nominally declared by the manufacturer, per cycle of operation. “Phantom consumption” at idle time due to the electrical wiring was not measured or considered.
3.4 Paper towels
The paper towels were traced back to paper and pulp manufacturing and raw material origin, both wood and recycled paper. Environmental management data from industry and forestry op-erations were used (Renova 2005, CELPA 2005, Portucel Soporcel 2005, Baluarte 2004, APA 2007). The following environmental pressures were thus computed: water consumption, emis-sions of GHG, other atmospheric pollution, water pollution, wastes, fuel consumption and elec-tricity consumption on the industrial plants; primary extraction of woods, mostly eucalyptus, in terms of land use and biomass extraction. Packaging, transport and waste disposal of the towels were included in the analysis, as was maritime transport of imported raw materials; percentages of wood pulp and recycled paper pulp are real.
The steel towel case manufacturing was also considered.
Energy consumption of forestry operations, raw material transportation within Portugal, in-dustrial plant construction and maintenance, were not considered.
Based on a limited inquiry to users, it was assumed that, on average, each user consumes two towels per usage.
4 RESULTS OF CASE STUDY
4.1 Comparing electric dryers and paper towels
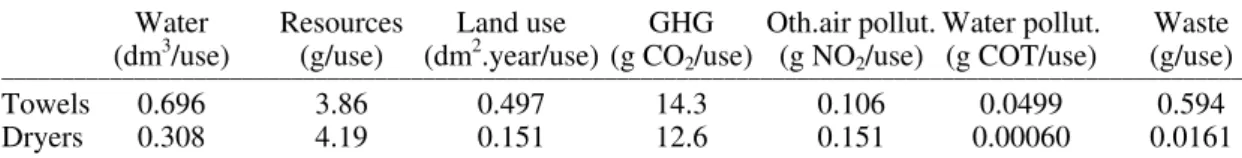
The environmental pressures of electric dryers and papers towels were aggregated throughout the life cycle according to the seven EcoBlock indicators and expressed per use (that is, per dryer cycle or per two towels). The results are presented in Tables 4 and 5.
Table 4. Environmental pressures per use of electric dryer or water towels (EcoBlock indicators) _______________________________________________________________________________________________________
Water Resources Land use GHG Oth.air pollut. Water pollut. Waste
(dm3/use) (g/use) (dm2.year/use) (g CO2/use) (g NO2/use) (g COT/use) (g/use)
_______________________________________________________________________________________________________
Towels 0.696 3.86 0.497 14.3 0.106 0.0499 0.594
Dryers 0.308 4.19 0.151 12.6 0.151 0.00060 0.0161
_______________________________________________________________________________________________________
Table 5. Environmental pressures per use of electric dryer or water towels (EcoBlock index, all values expressed as “global dm2.year/use”)
________________________________________________________________________________________________________ Water Resources Land use GHG Air pollut. Water pollut. Waste TOTAL ________________________________________________________________________________________________________
Towels 0.31 2.1 0.08 4.3 31.8 14.0 0.01 53
Dryers 0.14 2.3 0.02 3.8 45.3 0.17 0.00 52
________________________________________________________________________________________________________ Results indicate that, for a typical usage, the environmental pressure of electric dryers and paper towels is very similar — a difference of less than 2%.
4.2 Comparing phases of life cycle
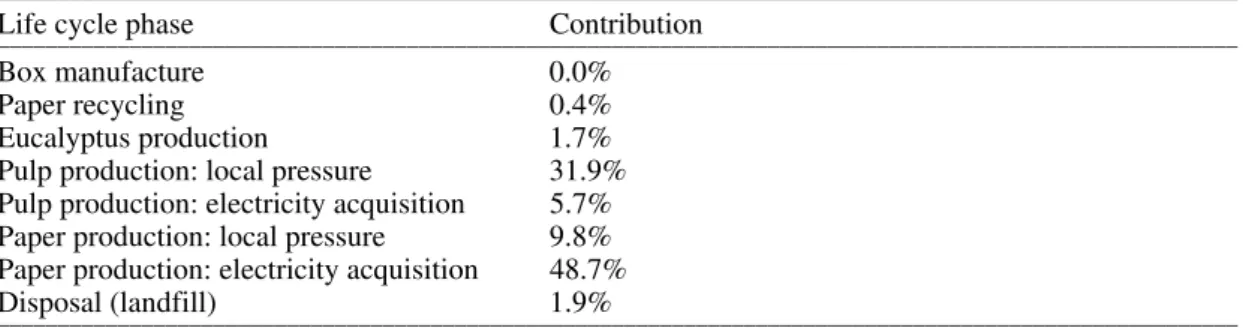
The method allows for a simple comparison between the pressures caused by different phases of the life cycle. Results are shown in Tables 6 and 7.
Table 6. Relative weight of different phases of life cycle of paper towels.
_______________________________________________________________________________________________________
Life cycle phase Contribution
_______________________________________________________________________________________________________
Box manufacture 0.0%
Paper recycling 0.4%
Eucalyptus production 1.7%
Pulp production: local pressure 31.9%
Pulp production: electricity acquisition 5.7%
Paper production: local pressure 9.8%
Paper production: electricity acquisition 48.7%
Disposal (landfill) 1.9%
_______________________________________________________________________________________________________
Table 7. Relative weight of different phases of life cycle of electric dryers
_______________________________________________________________________________________________________
Life cycle phase Contribution
_______________________________________________________________________________________________________
Dryer manufacture 0.1%
Electricity consumption in use 99.9%
Maintenance 0.0%
_______________________________________________________________________________________________________
Results show that the main contributor to environmental pressures is electricity production, followed by air and water pollution on site for pulp and paper manufacture.
4.3 Sensitivity analysis to user’s practice
Because there was no information available on actual user’s practice, we have performed a sen-sitivity analysis to different uses of towels and dryers. We also considered the possibility of us-ing dryers with half the dryus-ing time, because the dryers tested were of fixed dryus-ing time, and apparently many users do not use the full drying period. Results are shown in Table 8. Note that our previous assumption was that the average user would spend one dryer cycle or two towels. Table 8. Sensitivity analysis to user’s practice and equipment efficiency
_________________________________________________________________________
No. of towels per use 1 2 3 4
EcoBlock index (global dm2.year/use) 26 53 79 105
_________________________________________________________________________
No. of dryer cycles per use 0.5 1 1.5 2
EcoBlock index (global dm2.year/use) 26 52 78 103
_________________________________________________________________________
Results show that the environmental performance is highly dependent on both the equipments efficiency and the user’s practice. A comparison between actual consumption of dryers with or without sensors would be interesting. A “softer” electricity source, such as solar energy, would greatly decrease the environmental pressure, especially of the electric dryer.
4.4 Sensitivity analysis to conversion coefficients
As referred above, the conversion coefficients used to compute a global index from the seven indicators are tentative. To test the robustness of the coefficients assumed in this exercise, a sen-sitivity analysis was performed by doubling and halving in turn each coefficient.
5 CONCLUSION
EcoBlock indicators have the advantage of being clearly defined, easily measurable and verifi-able.
The major innovation and advantage of EcoBlock method relies on two aspects: (i) the con-cept of environmental performance transfer over the productive chain, relating complementary data at organization and product level; and (ii) an objective method of data aggregation that al-lows standardization and diminishes the total number of indicators while encompassing a large range of environmental issues. Sensitivity analysis in this and other case studies suggests a good robustness and reliability of the method.
The application of the method becomes more reliable as data availability increases, both at organization level (with e.g. environmental management systems) and with official statistics. Because the EcoBlock method relies heavily on standard organization and public information, rather than specific inventories, its usability may be expected to improve as such sources of in-formation become more available and standard.
On the case study at hand, a number of interesting conclusions may be drawn.
First, in the current state of technology and practice, paper towels and electric dryers have very similar environmental effects.
Second, the single largest contributor to the environmental pressure is electricity production. This is obvious in the case of electric dryers but is also true in the case of paper towels.
Third, the factors that most affect the performance of one technique or the other are the actual practices of the user and the energy source. Hence, a cleaner source of electricity such as solar energy would go a long way towards the reduction of environmental pressures.
6 ACKNOWLEDGEMENTS
The authors would like to thank former colleague in the EcoBlock project, Cristina Pegado, and the support of Sonae Sierra, who commissioned the study on hand drying.
7 REFERENCES
APA. 2007. National inventories of GHG and EPER. www.iambiente.pt. Baluarte. 2004. Declaração Ambiental.
CELPA. 2005. Boletim Estatístico.
Curran, Mary Ann. 1996. Environmental Life-Cycle Assessment. McGraw-Hill. USA.
Das, Tapas K. 2005. Towards Zero Discharge. Innovative Methodology and Technologies for Process Pollution Prevention. Wiley Interscience. Jonh Wileu & Sons, Inc., Publication. New Jersey.
DGEG. 2007. Energy statistics. www.dgge.pt.
GRI. 2002. Sustainability Reporting Guidelines. Global Reporting Initiative. Amsterdam.
GRI. 2006. Sustainability Reporting Guidelines – version 3.0. Global Reporting Initiative. Amsterdam. INAG 2004. Plano Nacional da Água.
www.inag.pt/inag2004/port/a_intervencao/planeamento/pna/pna.html
INAG. 2007. Large dams in Portugal. http://cnpgb.inag.pt/gr_barragens/gbingles.
Macedo, L., Melo, J. Joanaz 2005. Environmental performance evaluation through the “EcoBlock label”. Sustainable Management in Action - SMIA 05, Geneva, Switzerland.
Melo, J. Joanaz, Pegado, C. 2002. EcoBlock – A method for integrated environmental performance evaluation of companies and products. In: Proceedings of the Fifth International Conference on Eco-Balance, 399-402. The Society of Non-traditional Technology, Tsukuba, Japan. November 2002. Portucel Soporcel. 2005. Relatório de Sustentabilidade.
Renova. 2005. Declaração Ambiental.
Venetoulis, J., Chazan, D., Gaudet, C. 2004. Ecological Footprint of Nation. Redefining Progress. Oak-land.
WBCSD. 2000. Measuring Eco-efficiency. A Guide to Reporting Company Performance, World Busi-ness Council for Sustainable Development. Geneva.
WWF. 2004. Living Planet Report 2004. Switzerland.