Licenciado em Ciências de Engenharia Química e Bioquímica
Development of chitosan-based
microparticles for pulmonary drug
delivery
Dissertação para obtenção do Grau de Mestre em Engenharia Química e Bioquímica
Orientadora: Prof. Doutora Ana Isabel Nobre Martins Aguiar de Oliveira
Ricardo, FCT-UNL
Co-Orientadora: Doutora Teresa Maria Alves Casimiro Ribeiro, FCT-UNL
Júri:
Presidente: Prof. Doutora Maria da Ascensão Carvalho Fernandes Miranda Reis Arguente: Doutor Márcio Milton Nunes Temtem
Vogais: Prof. Doutora Ana Isabel Nobre Martins Aguiar de Oliveira Ricardo Doutora Teresa Maria Alves Casimiro Ribeiro
iii
Development of chitosan-based microparticles for pulmonary
drug delivery
Copyright© Renato Manuel Pereira Cabral, FCT/UNL, FCT
v
extremely thankfully for having them with me along this journey.
First of all I would like to thank my supervisor, Professor Doctor Ana Aguiar-Ricardo for giving me the opportunity to develop my MSc project in her laboratory and for all the support and orientation she gave through this year. Also, to my co-supervisor, Doctor Teresa Casimiro, for always supervising me with such sympathy and enthusiasm.
Funding from Fundação para a Ciência e Tecnologia (FC&T-Lisbon) through contracts PEst-C/EQB/LA0006/2011, PTDC/EQU-EQU/116097/2009, Conselho de Reitores das Universidades Portuguesas (CRUP) through Luso-German Agreement A - 13/ 10 and from Fundação Calouste Gulbenkian is acknowledged.
I would like to thank to Ana Sousa, who worked directly with me in SAA, for all the friendship and support.
To all my colleagues from 510 Group: Vanessa Correia, Patrícia Morgado, Telma Barroso, Rita Restani, Raquel Viveiros, Tiago Reis, Anita Lourenço, Ana Silva and Vasco Bonifácio. Thank you all for the support, companionship and for making the laboratory work much more relaxed and fun!
I would like to thank Cláudia Moura for giving great advice and ideas and Ana Paninho for teaching me the basic steps.
I would also like to thank Dr. Isabel Nogueira for the SEM images and Nuno Costa for the XRD, DSC and porosimetry assays. Mrs. Maria José Carapinha, Mrs. Conceição and Mrs. Idalina for all the help and assistance.
To my friends João Marum for keeping me in contact with current affairs, André Guerreiro for the walks we do together, Tiago Ferreira and Andreia de Almeida for all those dinners and movies we watched.
I would like to thank to my girlfriend Márcia for supporting me with all her goofiness during this hard working year and for hearing what I have to say, even if it is a complete nonsense. Thank you for making me see I was indeed too tired to keep writing and actually needed some hours of sleep.
vii
assisted atomization (SAA) and evaluated as potential carriers for sustained pulmonary drug delivery. CHT is a polysaccharide comprising of glucosamine and N-acetylglucosamine units, it is biodegradable, biocompatible and non-toxic being an interesting choice to be used as a drug carrier for inhalation therapy and belongs to the group of swellable polymers. By utilizing SAA, spherical microparticles containing a sharp particle distribution were successfully produced. Ibuprofen (IBP) and bovine serum albumin (BSA) were tested as a model small drug and as a model protein, respectively, to assess the effect on particle size and morphology when co-atomized with CHT on the SAA apparatus. The strategy developed in this work was to produce drug loaded microparticles with suitable aerodynamic characteristics that attain large geometric diameters when in contact with the lung physiological fluids by polymer swelling, reducing macrophage clearance. The microparticles produced by this method were characterized by using Morphologi G3 and Scanning electron microscopy (SEM) to assess their size distribution and morphology. To characterize the solid state properties of the particles X-ray diffraction (XRD), differential scanning calorimetry DSC and Fourier transform infrared (FTIR) were used. Porosity and surface area were determined by mercury and nitrogen porosimetry. In vitro
aerosolization studies using an Andersen Cascade Impactor (ACI) were performed to determine the average emitted fraction (EF%) and the fine particle fraction (FPF). Drug-release profiles were determined by in vitro experiments at physiological pH and temperature conditions.
The results obtained in this work show that SAA can be successfully used to prepare chitosan based formulations with adequate respirable fractions and sustained release of different bioactive molecules to be administered to the deep lung using dry powder inhalers (DPI).
Keywords: Microparticles; Chitosan; Supercritical assisted atomization; Pulmonary delivery;
ix
atomização assistida por fluídos supercríticos (SAA). As propriedades das partículas relativamente à sua aplicação para libertação controlada de fármacos, por administração via pulmonar, foram avaliadas in vitro.
O CHT é um polissacárido composto por unidades de glucosamina e N-acetilglucosamina, é biodegradável, biocompatível e não tóxico. Utilizando o SAA foi possível obter micropartículas esféricas. Os compostos ibuprofeno (IBP) e albumina do soro bovino (BSA) foram testadas como modelo de um fármaco de pequeno peso molecular e de uma proteína com elevado peso molecular, respectivamente, de forma a determinar o seu efeito no tamanho de partícula e na sua morfologia quando co-atomizadas com CHT. A estratégia desenvolvida neste trabalho foi a de produção de micropartículas carregadas com um fármaco que possuem características aerodinâmicas desejadas para inalação quando administradas utilizando inaladores de pós secos (dry powder inhaler, DPI) e que atinjam maiores diâmetros por inchamento, quando em contacto com os fluídos fisiológicos presentes no pulmão, reduzindo assim a sua eliminação por acção dos macrófagos.
A morfologia das micropartículas produzidas neste trabalho foi estudada utilizando o equipamento Morphologi G3 e por microscopia electrónica de varrimento (SEM). As propriedades de estado sólido foram investigadas por difracção de raio-X (DRX), calorimetria diferencial de varrimento (DSC) e por espectroscopia de infravermelho (FTIR). A porosidade e a área superficial das partículas foram determinadas por porosimetria de mercúrio e porosimetria de azoto.
Realizaram-se estudos in vitro de aerosolização usando o equipamento Andersen Cascade
Impactor (ACI) para determinar a fração média emitida (EF%) e a fração de partículas finas (FPF). Os perfis de libertação dos fármacos foram determinados por experiências in vitro, ao pH
e temperatura fisiológicos.
Este trabalho mostra que o processo SAA pode ser usado com sucesso para preparar formulações à base de quitosano com fracções respiráveis adequadas e libertação controlada de diferentes moléculas bioactivas, para administração pulmonar utilizando inaladores de pó seco (DPI).
Palavras-chave: Micropartículas; Quitosano; Atomização assistida por fluídos supercríticos;
xi
Abstract... vii
Resumo ... ix
Contents ... xi
Index of Figures ...xiii
Index of Tables ... xvii
List of abbreviations ... xix
Chapter 1. Introduction ... 1
1.1. Dry Powder Inhalers ... 3
1.2. Powder physical properties ... 4
1.3. Andersen Cascade Impactor ... 7
1.4. Drug Release ... 9
1.5. Chitosan ... 10
1.6. Particle production ... 12
1.7. Supercritical fluid technology... 13
1.8. Supercritical Assisted Atomization ... 16
Chapter 2. Experimental Section ... 19
2.1. Particle Production ... 19
2.1.1. Materials ... 19
2.1.2. SAA process and apparatus ... 19
2.2. Particle Characterization ... 21
Chapter 3. Results and Discussion ... 27
3.1. Preliminary studies on chitosan microparticles ... 27
3.1.1. Morphology and solid state properties of CHT microparticles ... 27
3.1.2. Particle swelling ... 37
3.1.3. In vitro biodegradation studies ... 38
3.2. Co-precipitation of chitosan and ibuprofen ... 39
3.2.1 Morphology and solid state properties of CHT-IBP microparticles ... 39
3.2.2 In vitro controlled release studies ... 48
3.3. Co-precipitation of chitosan and bovine serum albumin ... 50
xii
3.4.1. Morphology and solid state properties of CHT-IBP-BSA microparticles ... 59
3.5. Discussion ... 65
Chapter 4. Conclusions and Future Work ... 67
xiii
Symbicort[10]; (b) representation of the lungs and alveoli, adapted from the site wikicell[11] and
gridclub[12]. ... 2
Figure 1.2: Types of physisorption isotherms according to the IUPAC classification, adapted from F. Rouquerol et al. [18]. ... 5
Figure 1.3: Cross section of a porous grain: (C) closed pore; (B) blind pore; (T) through pore; (I) interconnected pore; (R) surface roughness, adapted from F. Rouquerol et al. [18]. ... 6
Figure 1.4: Schematic representation of the Andersen Cascade Impactor, adapted from the European pharmacopoeia [26] ... 8
Figure 1.5: Schematic representation of polymer swelling, adapted from D. Arifin et al. [30]. ... 9
Figure 1.6: Chitosan structure, where n is related to the DD % and m to (100 – DD %). Ideal chitosan would have m=0 and chitin would have n=0. Adapted from M. Dash et al. [32] and J. Kumirska et al. [34] ... 11
Figure 1.7: Phase diagram of CO2, adapted from W. Leitner et al. [76] ... 14
Figure 1.8: The density and solvent power of sc-CO2 as a function of temperature and pressure, adapted from W. Leitner et al. [76]. ... 15
Figure 1.9: Representation of the atomization mechanism, adapted from E. Reverchon et al. [101] ... 17
Figure 1.10: VLE of water-CO2-ethanol system, adapted from C. Duarte et al. [103] ... 18
Figure 2.1: Schematic representation of SAA apparatus: (CB) cooling bath; (P1) CO2 pump; (HB) heating bath; (PI) manometer; (Sol) liquid solution; (P2) liquid pump; (S) static mixer; (P) precipitator; (Gas) discharged gases; (C) cyclone; (PC) precipitated powder; (F) filter bag; (FI) flowmeter; (TI) temperature indicator; (TIC) temperature controller... 20
Figure 2.2: Laboratory scale SAA apparatus used to produce microparticles. ... 20
Figure 2.3: Morphologi G3 Essentials used to determine particle size distribution. ... 21
Figure 2.4: Schematic representation of the DUSA, adapted from Copley Scientific [111] ... 22
Figure 2.5: Andersen Cascade Impactor apparatus ... 23
Figure 2.6: Malvern Morphologi G3 apparatus measuring particle swelling. ... 24
Figure 3.1: Spray image of particle atomization using SAA. ... 28
Figure 3.2: ACI analysis for CHT microparticles produced by SAA. ... 30
Figure 3.3: Distribution of particles size from CHT microparticles with medium MW microparticles in a 150 μm diameter nozzle (black), medium MW microparticles in a 150 μm diameter nozzle with higher concentration (green), medium MW in a 300 μm diameter nozzle (red) and low MW in a 150 μm diameter nozzle (blue) obtained by Morphologi G3 analysis. ... 31
xiv
nozzle and high concentration (assay 2), (c) medium MW atomized with a 3000 μm diameter nozzle and
low concentration (assay 3), (d) low MW atomized with a 150 μm diameter nozzle and low concentration
(assay 4), the magnification used was 20,000 X... 32
Figure 3.6: X-ray diffraction patterns of (a) raw CHT and (b) CHT microparticles. ... 33
Figure 3.7: First run of the DSC of (a) CHT processed by SAA; (b) raw CHT from 25 oC to 200 oC with a flow rate of 10 oC/min. ... 33
Figure 3.8: Second run of the DSC of (a) CHT processed by SAA; (b) raw CHT from 25 oC to 300 oC with a flow rate of 10 oC/min. ... 33
Figure 3.9: Nitrogen adsorption isotherms of CHT microparticles... 34
Figure 3.10: BET surface area plot for CHT microparticles produced by SAA. ... 35
Figure 3.11: Pore area CHT microparticle processed by SAA. ... 36
Figure 3.12: FTIR analyses from (a) raw CHT and (b) CHT microparticles. ... 36
Figure 3.13: Morphologi images of the swelling of CHT microparticles in PBS at temperatures (a) 25 oC; (b) 37 oC; and (c)in pH=6.8 at 37 oC. Top: Dry particles, bottom: Wet particles. ... 37
Figure 3.14: Enzymatic degradation profiles of CHT microparticles in the presence of lysozyme. ... 38
Figure 3.15: ACI analysis for CHT-IBP microparticles produced by SAA. ... 41
Figure 3.16: Comparison of the distribution of particles size of CHT microparticles (black) and CHT-IBP microparticles (red). ... 42
Figure 3.17: SEM images of CHT-IBP microparticles (a) assay 5, (b) assay 6. ... 42
Figure 3.18: Morphologi G3 images of CHT-IBP microparticles (a) assay 5, (b) assay 6. ... 43
Figure 3.19: X-ray diffraction patterns of (a) raw IBP, (b) raw CHT, (c) CHT microparticles and (d) CHT-IBP microparticles. ... 43
Figure 3.20: First run of the DSC of (a) raw IBP; (b) raw CHT and (c) CHT-IBP microparticles from 25 oC to 200 oC with a flow rate of 10 oC/min. ... 44
Figure 3.21: Second run of the DSC of (a) raw IBP; (b) raw CHT and (c) CHT-IBP microparticles from 25 oC to 300 oC with a flow rate of 10 oC/min. ... 44
Figure 3.22: Nitrogen adsportion isotherms of CHT-IBP microparticles... 45
Figure 3.23: BET surface area plot for CHT-IBP microparticles produced by SAA. ... 46
Figure 3.24: Pore area of CHT-IBP microparticles processed by SAA. ... 46
Figure 3.25: FTIR analyses from (a) raw CHT; (b) raw IBP; (c) CHT microparticles and (d) CHT-IBP microparticles. ... 47
Figure 3.26: Release profiles on the first 60% of (a) IBP at pH=7.4 and (b) IBP at pH=6.8 adjusted with Korsmeyer and Peppas equation... 48
Figure 3.27: Release profiles of (a) IBP at pH=7.4 and (b) IBP at pH=6.8 and adjusted with Peppas and Sahlin equation. ... 48
Figure 3.28: ACI analysis for CHT-BSA microparticles produced by SAA. ... 51
xv
6.000X. ... 53 Figure 3.31: Morphologi G3 images of CHT-BSA microparticles (a) assay 7, (b) assay 8 and (c) assay 9, obtained with an objective of 50X. ... 53 Figure 3.32: X-ray diffraction patterns of (a) CHT-BSA microparticles, (b) CHT microparticles, (c) raw BSA and (d) BSA microparticles. ... 54 Figure 3.33: First run of the DSC of (a) raw CHT; (b) raw BSA and (c) CHT-BSA microparticles from 25 oC to 200 oC with a flow rate of 10 oC/min. ... 55
xvii
Table 1.2: Pore classification according to their diameter. ... 6 Table 1.3: Aerodynamic cut-off diameters for ACI at 28.3 L/min ... 8 Table 1.4: Relationship between structural characteristics and properties of CHT, adapted from M. Dash et al. [32] ... 11 Table 1.5: Typical order of magnitude of physical properties of gases, supercritical fluids and liquids, adapted from W. Leitner et al. [77] ... 14 Table 3.1: Operating parameters of SAA for different quantities of CHT (CHT %) in the liquid solution, CHT molecular weight (MW), nozzle diameter and particle recovery. Also shown are the mean volumetric diameter (Dv), span, shape, roughness and solid state. ... 28 Table 3.2: Properties of CHT microparticles produced by SAA in assay 1: BET specific surface area (aBET), pore diameter (Dp), volume occupied in the monolayer (νm), porosity, apparent density, bulk
density, true density and tapped density. ... 29
Table 3.3: Particles’ Reynolds number calculated for CHT microparticles obtained in assay 1. ... 29 Table 3.4: Aerodynamic diameters by Stokes equation and ACI, as well as FPF and GSD for CHT microparticles produced by SAA. ... 30 Table 3.5: Swelling degree and water uptake of CHT microparticles... 38 Table 3.6: Operating parameters of SAA for different quantities of IBP (IBP %) in the liquid solution co-atomized with 0.60% m/v CHT. Also shown are the drug encapsulation (E), mean volumetric diameter (Dv), span, shape, roughness and solid state. ... 39 Table 3.7: Properties of CHT-IBP microparticles produced by SAA in assay 5: BET specific surface area (aBET), pore diameter (Dp), volume occupied in the monolayer (νm), porosity, apparent density, bulk
density, true density and tapped density. ... 39
xviii
xix API: Active pharmaceutical ingredient.
BSA: Bovine serum albumin. CHT: Chitosan.
CHT-BSA: Chitosan co-atomized with bovine serum albumin. CHT-IBP: Chitosan co-atomized with Ibuprofen.
CHT-IBP-BSA: Chitosan co-atomized with Ibuprofen and bovine serum albumin. DA: Aerodynamic diameter.
Dp: Pore diameter.
Dv: Particle mean volumetric diameter.
DD: Degree of deacetylation.
DSC: Differential scanning calorimetry. FPF: Fine particle fraction.
GSD: Geometric standard deviation. IBP: Ibuprofen.
MMAD: Mass median aerodynamic distribution. MW: Molecular weight.
νm: Volume adsorbed in the monolayer
PSD: Particle size distribution. Rep: Particle Reynolds number.
RESS: Rapid expansion of supercritical solution. SAA: Supercritical assisted atomization.
SAS: Supercritical antisolvent. Sc-CO2: Supercritical carbon dioxide.
1
Chapter 1. Introduction
The lungs are, probably, the most historic route for drug delivery. The ancient Egyptians used to inhale vapors to treat a wide variety of diseases, as early as 1,500 BC. However the use of lungs as a route for drug delivery was forgotten up until the 1950s with the introduction of metered dose inhalers to deliver albuterol for asthma treatment [1].
The route of administration significantly influences the therapeutic income of a drug. A drug delivery system should assure protection of a drug against degradation and ensure that the drug reaches proper permeability properties to subsequently provide a complex transportation and protection system against the natural barriers. Oral delivery remains dominant, however other routes of administration are becoming more and more popular for targeted drug delivery [2]. Recently, there has been an increasing interest in developing systems for the controlled delivery of therapeutic molecules to the lungs. This type of drug delivery to the lung evades primary metabolism through the liver, has a large surface area and allows less amounts of drug to be used.
The primary function of the lung is to exchange gas between the blood and the external environment, where there are approximately 300 million alveoli. These alveoli contain type I pneumocytes, which share a membrane with pulmonary capillaries, and type II pneumocytes which secrete a surfactant to prevent alveolar collapse [1].
Microparticles were usually regarded simply as carriers deprived of any special attributes, and the major concern with these particles were that they should have suitable sizes for inhalation purposes and be dry. Recently there are more advanced therapeutic approaches, which created more complex requirements that can only be met by particles designed for certain specific functions such as transport of the drug, targeted delivery, sustained drug release and stabilization of the drug [3].
There are many new inhalation products being studied, possessing new absorption mechanisms and rapid action for systemic therapies, however their effectiveness is related to their efficiency in drug delivery to the lungs [3].
2
A new focus is being done for swellable microparticles, having the desired aerodynamic diameters when dry, but upon contact with an aqueous solution the particles will grow in size as water enters in the polymeric matrix, evading the macrophage clearance in the deep lung while at the same time providing a controlled release of the API. Many formulations have been tested, microparticles comprised of only one polymer, microparticles comprised of co-polymers to have good characteristics of both polymers and nanoparticles inside microparticles allowing a better control over the drug release [4].
Recently, there have been increasing incidences of lung diseases, such as asthma, tuberculosis, cystic fibrosis, chronic obstructive pulmonary disease and lung cancer decreasing the quality of life of many people. Lung cancer is one of the most common cancers, along with colorectum, breast and prostate, showing the highest mortality rate among them and constituting a major public health problem in the world [5,6].
Controlled release of pharmaceutical drugs offer an effective way to optimize the bioavailability of drugs, offering several advantages over conventional methods [7]. Also, advances in inhalation therapy led to the development of novel technologies for the delivery of such mechanisms via pulmonary routes, by using inhalers as in Figure 1.1 (a), for treatment of both local or systemic diseases [3]. Delivery of drugs to the lungs, schematized in Figure 1.1 (b), has many advantages, such as large alveolar surface area, thin and permeable epithelial barrier, extensive vascularization and low enzymatic metabolic activity, providing an alternate route to enter systemic circulation [8,9].
Figure 1.1: Schematic representation of (a) a person using an inhaler, adapted from the site of
Symbicort[10]; (b) representation of the lungs and alveoli, adapted from the site wikicell[11] and gridclub[12].
3
1.1. Dry Powder Inhalers
First generation of dry powder inhalers (DPI) exhibited low efficiency in fine particle fraction (FPF), so pressurized metered dose inhalers (pMDI) are used more frequently these days. However, pMDIs are more expensive and, since they are easier to develop, more generic pMDIs can appear in the market. Also it is necessary to have a suspension of the drug on hydrofluoralkanes in order for pMDIs to function properly, which may cause environmental problems [3,13,14].
The incorrect use of inhalers by patients is still a common occurrence, reaching as high as 50% of the patients due to many reasons and has been attributed to poor coordination. The incorrect use of the inhalation device leads to a poor compliance of the treatment, and in some cases even
to failure, despite the API being successful for the treatment of the patient’s disease [13,15]. In order to bypass the problems posed through the incorrect use of inhalers, an appropriate design of the inhaler must be made during its development that can improve the patients comfort when using, leading to a more successful inhalation [13].
Despite exhibiting low efficiency, DPIs are also hard and expensive to develop, however they have been the subject of recent improvement. These developments are mainly due to the optimization of process technologies allowing better product consistency, dispersibility and sustained release, while at the same time reducing manufacturing complexity and costs as well as being environmentally friendly [3,13,14].
There are many types of DPIs, as shown in Table 1.1, and can be divided as “single-dose”
devices, where a single dose is provided in a capsule; “multiple unit dose” devices, which contains a small amount of doses in capsules or blisters; or “multidose” devices; where the
powder is stored in a reservoir and the doses are metered [13,14].
Table 1.1: Breath-Actuated DPIs, adapted from S. Newman and W. Busse [13].
Single Dose Multiple Unit Dose Multidose
Spinhaler® Diskhaler® Turbuhaler®
Rotahaler® Diskus® Easyhaler®
AerolizerTM Aerohaler® Novolizer®
Inhalator® Twincaps® Clickhaler®
Eclipse MicroDose DPI Pulvinal®
Turbospin Delsys DPI Ultrahaler®
AIRTM Inhaler Technohaler® Taifun®
MAGhaler Cyclovent
4
inhaler in lifting the particles from the chamber or capsule, fluidizing the powders from a static state, turning them into an aerosol. In order for fluidization to occur, cohesive and adhesive forces of the particles must be overcome, so it can be easily seen that the inspiratory flow rate affects the efficiency of particle deagglomeration and the amount reaching the lung [13,14].
1.2.Powder physical properties
Particle interactions also have a significant effect in flowability, deaggregation and dispersion,
and are comprised by “long-range forces”, with forces weaker than chemical bonds but that extend to a greater range; and “short-range” bonds such as chemical bonding. For particles with
sizes less than 10 μm, weaker forces, such as cohesion or adhesion forces, generally comprised
by van der Waals forces, electrostatic forces or capillary forces, become significant, since gravitational forces lose their significance at such small sizes [14].
Since inter-particle interactions between the drug and excipient are not fully understood, improving the dispersion of these particles has been more pragmatic than derived from a theoretical model [14].
In order to successfully reach the deep lung, particles should have sizes ranging from 0.5-5 μm
aerodynamic diameters, to be able to pass through the mouth, throat, and conducting airways
and reach the deep lung. If the particles are larger than 5 μm they will be trapped in the upper airawys. On the other way, if they are below 0.5 μm they are exhaled during the breathing cycle
[14,16].
However, even when in the inhalable range, the particles are subjected to high inter-particulate forces lowering their flow properties. So many alternatives have been made in the ways of either forming controlled aggregation or agglomeration of the particles, or adhesion to excipient carrier particles [14].
Due to the efficiency of local clearance mechanisms, designing microparticles suitable for sustained drug delivery to the lungs with adequate aerodynamic properties is one of the major challenges in pulmonary drug delivery [16].
Microparticles with sizes suitable for inhalation are small enough to have rapid clearance from lungs by alveolar macrophages. Increasing particle size reduces macrophage phagocytosis, however this is an unpractical choice for pulmonary drug delivery. So a promising strategy has been proposed by developing swellable microparticles that have aerodynamic sizes suitable for inhalation when dry but, when deposited in the lungs, attain larger sizes by particle swelling, bypassing macrophage clearance [4,16].
5
Increasing the elongation of carriers has been shown to improve both dispersibility and FPF of the microparticles. However, this has also shown to reduce powder flow by inducing a poor content uniformity. So a balance must be sought when engineering microparticles suitable for inhalation purposes [14].
There have been reports that surface roughness affects powder performance. Microparticles with smooth surface or macroscopic roughness have shown low respirable fractions. On the other hand, microscopic roughness seems to yield higher respirable fractions, due to the smaller contact area and reduced drug adhesion, promoting a better drug release while at the same time increasing the distance between particles, which will reduce interparticulate forces, improving their performance[14].
Particle surface area is then an important parameter when we envisage the production of particles suitable for the controlled release of pharmaceutical compounds. This parameter is determined by gas adsorption, giving information not only on powder surface area and energy, but also on the pore structure of the solid [17,18].
When a solid surface is exposed to a fluid, either a liquid or a gas, these molecules adsorb on its surface, increasing in the density of the fluid in the vicinity of an interface. This effect is dependent on the interfacial area [18].
Adsorption occurs due to the interactions between the solid and the fluid phase involving two main forces. They can either be physical forces, in which small forces such as van der Waals are present, usually called physisorption; or chemical adsorption, where chemical bonding between molecules occurs, commonly named chemisorptions [18].
The isotherms are grouped into six classes by the IUPAC classification, shown in Figure 1.2.
Figure 1.2: Types of physisorption isotherms according to the IUPAC classification, adapted from F.
6
The Brunauer – Emmett – Teller (BET) equation was obtained from the Langmuir mechanism, which is only valid for monolayer adsorption, in order to include multilayer adsorption. In this manner it became possible to explain Type II isotherms, common for multilayer adsorption [19]. According to the BET model, the molecules adsorbed in one layer can act as further adsorption sites for molecules, which in turn will form the next layer. As long as saturation vapour pressure po does not occur, many layers of randomly stacked adsorbed molecules can cover the solid
surface [19].
Pores can have a very big size distribution as well as various shapes even within the same particle and are usually determined by mercury porosimetry [17,20,21]. A classification of pores based on their size was proposed by B. Bering et al., as shown in Table 1.2, and is currently adopted by the IUPAC [22].
Table 1.2: Pore classification according to their diameter.
Classification Width
Micropores < 1.5 nm
Mesopores 1.5 nm<d<50 nm
Macropores > 50 nm
Each range of pore size corresponds to the adsorption effects observed in the isotherm.
In micropores, the entire pore volume represents a space where adsorption can occur, having a high interaction potential due to the proximity of the walls, and the amount adsorbed is correspondingly enhanced; in mesopores, both monolayer and multilayer occurs in their surface, and at certain relative pressures, capillary condensation takes place with a characteristic hysteresis loop; in the macropore range, the pores are so big that the filling of these pores by capillary condensation only occurs at relative pressures close to unity, being very difficult to map out the isotherm in detail [17,22].
Besides their size, pores can also be classified due to their form, as shown in Figure 1.3.
Figure 1.3: Cross section of a porous grain: (C) closed pore; (B) blind pore; (T) through pore; (I)
interconnected pore; (R) surface roughness, adapted from F. Rouquerol et al. [18].
Porosity is defined as the ratio of pores and voids to the volume occupied by the solid. One must bear in mind that the value of porosity depends upon the method used. The pore volume is usually regarded as the volume of open pores, but it may also include closed pores [18].
R B
I
7
It is usually hard to distinguish between surface roughness and pores or voids, so conventionally an irregularity is considered a pore if it is deeper than wide [18].
Although mercury porosimetry is a useful technique for determining particle porosity, it is also able to give information on skeletal and apparent density of the particles [20,21]. The apparent density is determined by the volume occupied by the particles obtained by liquid displacement. Since the liquid does no enter all the pores it is necessary to report the liquid used in the measurement, because different liquids yields different results, due to the different capacities of penetrating smaller holes between different liquids [23]. Another method of determining particle density is through the use of a pycnometer which, in this case, measures the true density of the particles under the principle of gas displacement. True density only considers the volume occupied by the solid material, neglecting the volume of void spaces [23].
The bulk density is an important parameter, as it affects aerodynamic diameter, being characterized as the volume occupied by the solid and the voids for a given mass [3,23,24]. Electrostatic charge influences powder performance in the various stages of the process. Triboelectrification is known to be inversely proportional to particle size; however this parameter becomes more complex when the API is present [14].
Relative humidity has been shown to influence powder performance by reducing the electrostatic charge and also by decreasing the stability of amorphous compounds. However, this effect induces capillary forces which, at relatively high humidity (over 50%) dominates
particles’ adhesion forces that cannot be reversed by lowering the relative humidity [25]. Amorphous particles have many advantages, such as increased dissolution. However, it comes with a big disadvantage in decreased chemical stability. Also, amorphous particles possess a higher water adsorption capacity [14]. In order to maintain chemical stability, the API must be in a crystalline form but so it will show a poor dissolution. So, in order to bypass these limitations, an amorphous carrier, possessing good dissolution rates impregnated with crystalline API, in order to maintain the product stability have been given attention [3]
1.3.Andersen Cascade Impactor
8
Figure 1.4: Schematic representation of the Andersen Cascade Impactor, adapted from the European
pharmacopoeia [26]
It is stated by both pharmacopoeias that the air flow rate through an inhaler must provide a pressure drop of 4 kPa in a time consistent with the withdrawal of 4 liters of air, due to the different resistances offered by different inhalers, however this can change due to limitations imposed by the condition of the lungs [24,26,28].
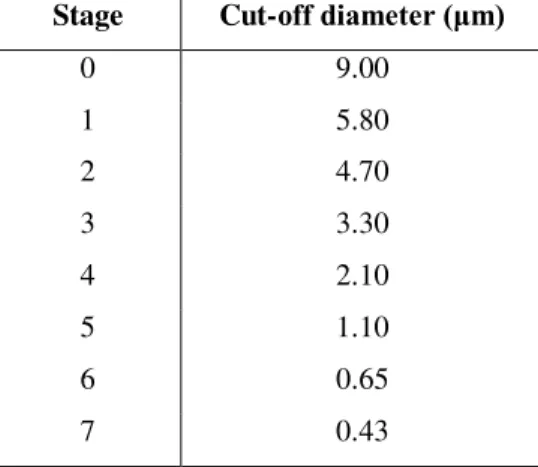
Cascade impactors classify aerosol particles and droplets on the basis of their aerodynamic diameters by separating the aerosolized particles from the airstream based on their inertia [27]. The aerosolized particles pass through decreasing orifices openings leading to the next stages which, if possessing sufficient inertia, will impact on the collection plate and subsequently deposited over the 8 stages of the ACI. In order to prevent bouncing of the particles, the stages are usually coated with a viscous solution. Each stage provides a determined cut-off diameter, as shown in Table 1.3 [24,29].
Table 1.3: Aerodynamic cut-off diameters for ACI at 28.3 L/min
Stage Cut-off diameter (μm)
0 9.00
1 5.80
2 4.70
3 3.30
4 2.10
5 1.10
6 0.65
9
Particle size is estimated based on the mass distribution determined by either UV or HPLC analysis in order to discriminate between the API and the carrier. Another important parameter measured is the FPF, which is the mass of particles below a cut-off diameter of 5 μm [24]. The aerodynamic diameter is a crucial parameter in any aerosol measurement, as well as respiratory drug delivery, being defined as the diameter of spheres with unit density, able to reach the same velocity in the air stream as particles of arbitrary shape and density. From this
measurement comes another important parameter, the MMAD, which is the particles’
aerodynamic diameter found at 50% of the cumulative PSD [24].
1.4.Drug Release
Sustainable drug release could reduce the frequency that patients use their inhalers, reducing in this way the risk of damaging the lungs and developing pulmonary fibrosis [8].
In order to provide a better control over the drug release, many groups proposed the use of swelling polymers, where water could be able to imbibe the polymeric matrix, causing polymer disentanglement, while at the same time releasing the drug. The different phases of polymer disentanglement for swelling devices can be observed in Figure 1.5 [30].
Figure 1.5: Schematic representation of polymer swelling, adapted from D. Arifin et al. [30].
Water entering the polymeric matrix decreases polymer concentration and raises polymer disentanglement. At the same time, the polymeric disentanglement causes particle swelling and the relaxation of the polymeric matrix, resulting in the rubbery region where drug mobility increases. At the interface with the bulk solution there is also polymer dissolution due to the decreased polymer concentration in this region. Since drug release is not only controlled by
diffusion, it is expected to observe a deviation from Fick’s diffusion model, as polymer swelling
has a huge influence in the release of the drug [30].
Center Dry Glossy
core Swollen Glassy Layer Gel Layer Diffusion Layer Bulk
Unhidrated
10
The swelling occurs to achieve thermodynamics equilibrium when water penetrates the crosslinked region inside the polymer matrix due to a water concentration gradient. As water penetrates and swelling takes place, the polymer changes from a glassy state into a rubbery state, creating a gel layer which increases drug diffusivity. So, during particle swelling, two states coexist in the polymer matrix, the glass core and gel layer. In this situation there are two moving fronts, the glassy-rubbery front (GR) and the rubbery-solvent front (RS) [30].
During particle swelling, front GR moves inward, while at the same time front RS moves outward, and drug diffuses out through interface RS due to a concentration gradient. When the front RS reaches thermodynamic equilibrium with the medium, it will start to dissolve, and this front starts to move inwards. At this stage both fronts will move inwards until front GR ceases to exist as the glassy core disappears. Then only polymer dissolution controls the particles’ shrinking process [30].
If there is little or no water penetration, there is no polymer relaxation and drug is released by Fickian diffusion through the glassy polymer. On the other hand, if water penetration is the
dominant step, a “Case-II transport” of drug release occurs, characterized by a sharp advancing interface at constant velocity, resulting in a zero-order drug release [31].
Usually, drug release is encountered between these two cases, where “anomalous transport” is
defined. It is usually found where swelling controls drug delivery, since both diffusion and relaxation transport are present and happening at the same time [30].
The most common excipient used is lactose, but since it has a sugar-reducing function, it is not suitable for use with certain APIs. Many alternatives to lactose have been proposed, such as fructose, galactose, raffinoze, trehalose, xylitol, sucrose, mannitol, maltodextrins, dextrans, arginine, cyclodextrins, glycine, lysine, glutamic acid, aspartic acid, gelatin and human serum albumin [14].
1.5.Chitosan
CHT is a cationic linear polysaccharide, illustrated in Figure 1.6. It is a co-polymer comprising N-acetyl-2-amino-2-deoxy-ᴅ-glucopyranose and 2-amino-2-deoxy-ᴅ-glucopyranose, being obtained by partial deacetylation of chitin and is already being used in cosmetics [8,32–34]. Many applications of CHT have been proposed for therapy and theranostics, such as for the delivery of therapeutic agents [35–37], bioimaging [37], tissue engineering [36], wound healing [38,39] and stimuli-responsive materials [40]. CHT has been proposed for other uses, such as waste water treatment [41], heavy metal chelation [42], biosensors [43] and as natural fungicides [44].
For the delivery of therapeutic agents, CHT has been successfully applied to gene delivery [45–
11
Chitin is the second most occurring polysaccharide in nature, next to cellulose and is present in crustaceous shells. Several millions of tons of chitin are harvested each year as the shell waste of crustaceans, making it a relatively cheap and readily available source [32,34].
Figure 1.6: Chitosan structure, where n is related to the DD % and m to (100 – DD %). Ideal chitosan
would have m=0 and chitin would have n=0. Adapted from M. Dash et al. [32] and J. Kumirska et al. [34]
CHT is obtained by thermochemical deacetylation of chitin in an alkaline solution, usually an aqueous 40-45% w/v NaOH solution at 90-120 oC during 5 hours. The conditions used in this process determine the degree of deacetylation (DD) of CHT [32].
CHT is soluble in acid solutions with pH below 6.2 because due to the protonation of their amine groups, which have a pKa between 6.2 and 7.0. At pH higher than 6.0, the amines become deprotonated, rendering CHT a neutral charge and water insoluble. It has been suggested that the pKa of CHT is dependent on the DD, so the solubility of CHT is also dependent on the DD [32,33,36].
Many factors are affected by the DD and MW of CHT, as can be seen on Table 1.4.
Table 1.4: Relationship between structural characteristics and properties of CHT, adapted from M. Dash
et al. [32]
Property Structural characteristics*
Solubility ↗DD
Crystallinity ↘DD
Biodegradability ↘DD, ↘MW
Viscosity ↗DD
Biocompatibility ↗DD
Mucoadhesion ↗DD, ↗MW
Analgesic ↗DD
Antimicrobial ↗DD, ↗MW
Permeation enhancing effect ↗DD
Antioxidant ↗DD, ↘MW
Hemostatic ↗DD
*↗-directional proportional to property; ↘-inversely proportional to property
CHT can be eliminated by renal clearance, unless its MW is too large. If that is the case, then CHT must be degraded by enzymes capable to hydrolyze glucosamine-glucosamine, glucosamine-N-acetyl-glucosamine and N-acetyl-glucosamine-N-acetyl-glucosamine linkages, such as lysozyme, which is also present in the lung mucosa [1,16,32,36,57,58].
12
CHT-based biomaterials show that there are no inflammatory or allergic reactions due to its application and possesses a LD50 in laboratory mice similar to sugar and salt. It is characterized
by molecular attractive forces due to electrostatic interactions between positively charged CHT and negatively charged mucosal surfaces, promoting drug transmucosal absorption [7,16,32,36,58–60].
CHT microparticles can be used as carriers, the drug is released due to the gelling ability of CHT because when it contacts with aqueous solutions, the polymeric chain begins to swell as water enters the small holes between each chain. Also, it has recently been confirmed that CHT has a drug adsorption-enhancing effect in pulmonary tissues by opening of the intercellular junction of the lung epithelium, as well as improving drug targeting and dissolution rate of drugs [7,16,32,59].
Since CHT is soluble in weak acidic solutions, the production of microparticles offers the possibility of avoiding hazardous organic solvents. Also, CHT has a good ability to control the release of APIs, making it a material of interest to produce and develop drug release systems[32].
1.6.Particle production
The majority of currently commercially available inhalation products consist of a micronized drug in either agglomerated or blended form. Generally, such particles are produced by batch crystallization, which then are filtered, dried and finally micronized by applying pressure, friction, attrition, impact or shear forces [3].
Common methods for manufacturing dry powders for inhalation are vibration milling, ball milling and jet-milling. These techniques can be disruptive methods that may generate hot-spots during micronization, reducing the stability of the particles by generating amorphous domains in the particles, and in some cases must operate in cryogenic conditions [3].
In jet-milling process, the material suffers many impacts before achieving a suitable size, which then are separated from the larger ones by inertial impaction. Although a suitable particle size will eventually be obtained it is a time-consuming method, prone to induce many alterations upon the micronized material, such as on its surface, solid-state properties and inducing electrostatic charges. Even more, this method will not be able to produce porous or hollow particles, composites nor encapsulated materials. This type of micronization may also produce hot-spots, which will generate amorphous domains and reduce particle stability. However, this particular problem may be overcome by milling the material suspended in a fluid propellant in a cryostat, and later by the evaporation of the propellant [61–63].
13
technique is particle size control, because small molecules tend to form large crystals. In order to prevent this, high concentrations of growth retarding excipients must be used which must be removed from the final material due to toxicity issues, and then a further drying process is required. This drying process is complicated and may induce cake formation and reduced powder dispersibility [3,64–66].
Spray drying technology has been widely applied, due to its simplicity, scale-up, ease of operation and the ability to produce composite materials. This process comprises the atomization of the feed solution into a spray, then the spray will contact with air at elevated temperatures leading to particle drying, and finally, dry particles are separated from the air through a cyclone and/or a filter bag. Particle atomization can be optimized by a choice of several types of atomizers, such as rotary atomizers, pressure nozzles and two-fluid nozzles. Particle recovery can be further optimized, by replacing the filter unit with a vacuum system, allowing a better drying at lower operating temperatures, and by designing high efficiency cyclones. Also, this technique allows the optimization of particle characteristic by changing the operating parameters, such as atomization pressure, feed rate, drying temperature, feed concentration and nozzle orifice diameter. This technique has been successfully used in processing many types of drugs, excipients, biological compounds and producing porous particles [3,67–72].
1.7.Supercritical fluid technology
The supercritical state of matter was first identified in 1822 by engineer and physicist baron Charles Cagniard de La Tour in his cannon barrel experiments by the discontinuities of the sounds made by a rolling ball inside cannon filled with various fluids [73].
14
Figure 1.7: Phase diagram of CO2, adapted from W. Leitner et al. [76]
Supercritical fluids have properties between those of liquids and gases, as seen in Table 1.5 [76,77].
Table 1.5: Typical order of magnitude of physical properties of gases, supercritical fluids and liquids,
adapted from W. Leitner et al. [77]
Property Gas Supercritical Fluid Liquid
Density (g.cm-1) 10-3 0.3 1
Viscosity (Pa.s) 10-5 10-4 10-3
Diffusivity (cm2.s) 0.1 10-3 10-6
At the “near-critical” region, the properties of the compound start to gradually change. In the
area around the critical point, the compressibility of the fluid is much greater that what is predicted from the ideal gas law, approaching to infinity. Due to this effect the sound velocity in the fluid becomes minimum, so this has been one way of determining the critical data of mixtures[76–79].
15
Figure 1.8: The density and solvent power of sc-CO2 as a function of temperature and pressure, adapted
from W. Leitner et al. [76].
There can be density fluctuations in the fluid, especially near the critical point due to the large fluid compressibility. If the fluctuations have the same order of magnitude as the wavelength of visible light it leads to opalescence due to light scattering, being this fact often used to determine the critical point [76].
16
Carbon dioxide is the fluid of choice due to its low critical temperature (31.1 °C) and moderate pressure (73.8 bar), being non toxic, readily available and inert [74,75]. The use of sc-CO2 as a
solvent is a very interesting approach, as it allows recycling waste CO2, reducing its emission to
the atmosphere while at the same time replacing other organic solvents which are environmentally damaging [76]. Supercritical carbon dioxide (sc-CO2) offers an efficient
extraction and separation of organic solvents, enabling production of particles in a pure dry form. Its high compressibility can be used to promote efficient atomization of solutions, while at the same time reduce the manufacturing complexity, energy used and solvents requirements, affording a more environment friendly process [3].
A common method for obtaining microparticles by using sc-CO2 is the Rapid Expansion of
Supercritical Solutions (RESS), which is comprised by two steps, first the solid material is dissolved in sc-CO2, and then the solution is rapidly expanded by lowering the pressure,
promoting a rapid cooling rate and inducing supersaturation, which leads to microparticle formation. The morphology of the materials depend on the operating temperature, pressure drop, impact distance of the jet to a surface and nozzle diameter [88–92].
Another method commonly used for obtaining microparticles using sc-CO2 is supercritical
antisolvent (SAS), where particles are produced when a drug solution is brought into contact with sc-CO2 in a semi-continuous method. This process has the advantage of controlling the
physical form of drug powders by varying the working conditions of temperature, pressure or solution flow rate. A very important parameter in this process is the injector, which is designed to break up the liquid jet, forming small droplets that expand in the precipitator. The major drawback of SAS is that the solvent must be completely miscible in sc-CO2, which is a problem
when aqueous solvents are used, since water is not miscible with sc-CO2 [3,91–97].
1.8.Supercritical Assisted Atomization
Since CHT is not soluble in sc-CO2, a process based on its solvent effect cannot be used.
However, a process based on the anti-solvent effect of CO2 cannot also be applied, since a 1%
acetic acid aqueous solution is used [7,59,94–96].
Supercritical Assisted Atomization (SAA) is a process patented by E. Reverchon in US 7,276,190 B2, based on the solubilization of controlled quantities of sc-CO2 in liquid solutions.
SAA offers many advantages over conventional methods, the possibility of operating in a continuous method in mild operating conditions and being able to use both organic and inorganic solvents while at the same time providing a good control over particle size and distribution [7,75,95,96,98,99].
The apparatus mainly consists of two pumps to deliver liquid CO2 and the liquid solution, a
17
saturator and to pump liquid CO2, attained through a cryostat. Liquid CO2 is then heated and the
pressure is raised until supercritical conditions are reached [98,99].
The mixing takes place in a saturator containing high-surface packing and ensuring long residence times in order to achieve near-equilibrium conditions. The solution will then be atomized through a nozzle by a two-step atomization: first primary droplets are obtained due to pneumatic atomization at the nozzle exit; then a secondary atomization process takes place by decompressive atomization due to CO2 expansion from inside the primary droplets, shown in
Figure 1.9. This implies that the smallest particle size that can be achieved is the size of the smallest droplet achieved during the first atomization. The droplet size is determined by the viscosity, surface tension and the amount of sc-CO2 dissolved in the liquid solution, while
temperature and chemical characteristics of the solute determines whether the particle is crystalline or amorphous [7,75,95–100].
Figure 1.9: Representation of the atomization mechanism, adapted from E. Reverchon et al. [101]
The solubility of sc-CO2 depends on the properties of the solvent and on operating temperature
and pressure, being related to high-pressure vapor liquid equilibria (VLEs) of the system [101,102].
The data on the solubility of acetic acid-water mixtures in sc-CO2 are only available in a limited
range of temperatures, being difficult to take into account the effect of acetic acid in the VLE. On the case of ethanol-water, there is much more information available in the literature [103]. Since there are only small amounts of acetic acid (1 % v/v) it became convenient to see where the operating conditions fall in the VLE for the ternary system water-ethanol-CO2. However, the
possibility that acetic acid can influence the VLE must be taken into account.
Fixing pressure and temperature, the mass flow ratio between CO2 and the solvent determines
the operating point the ternary system as depicted in Figure 1.10 [101].
Solution Sc-CO2
P>74 bar Pneumatic atomization
P≈1 bar
18
Figure 1.10: VLE of water-CO2-ethanol system, adapted from C. Duarte et al. [103]
At relatively low pressures and temperatures, the solubility of CO2 in aqueous solutions is low,
and the operating point always falls in a two-phase gas-liquid region [101,104]. However, using small amounts of ethanol as co-solvent may significantly improve the miscibility of sc-CO2 in
water increasing the process efficiency [102,105,106]. Although this improves the solubility of sc-CO2 in aqueous solutions, the operating point still falls in a two-phase region, so there is no
effect of the gas to liquid ratio on the composition of the phases [101,104].
During particle formation, dissolved CO2 reduces the viscosity and surface tension of the
solution, while non-dissolved CO2 enhances the pneumatic effect, improving primary
atomization [74,107].
Many compounds have already been successfully atomized using SAA, such as cromolyn sodium [108], BSA [74], asthma drug HMR1031 [75], gentamicin sulfate [109], lysozyme [96], tetracycline [97], rifampicine [97], yttrium acetate [98], sodium chloride [98], zinc acetate [98], aluminum sulfate [98], zirconyl nitrate hydrate [98], carbamazepine [98], ampicilin trihydrate [98], triclabenzadol [98], dexamethasone [98], chitosan [7,101], PMMA and PLLA [110] among others.
In this work it was used supercritical assisted atomization process in order to produce CHT microparticles to be used as excipients of new formulations for the controlled delivery of drugs to the lung. IBP and BSA were used as a small model drug and mode protein, respectively, in order to assess the effects of co-precipitation in particle size, size distribution, morphology, crystallinity and specific surface area. These effects were also assessed by varying operating parameters, such as saturator pressure, precipitator temperature, mass flow rate and concentration. Drug release profiles of particles loaded with IBP were also made in order to assess the pharmaco-kinetic performance of loaded CHT-based microparticles.
C2H5OH
CO2
19
Chapter 2. Experimental Section
2.1.Particle Production
2.1.1. Materials
Chitosan (viscosity 5-20mPa.s, 0.5% in 0.5 acetic acid at 20 C) was purchased from Tokyo Chemical Industry. (s)-(+)-Ibuprofen (99% purity) and bovine serum albumin (98% purity) were purchased from Sigma Aldrich. Acetic acid glacial (99.7% purity) was purchased from Carlo Erba Reagents. Ethanol absolute anhydrous (99.9% purity) was purchased from Scharlau. Carbon dioxide UN1013 was obtained from Air Liquide. All components were used as received without any further purification.
2.1.2. SAA process and apparatus
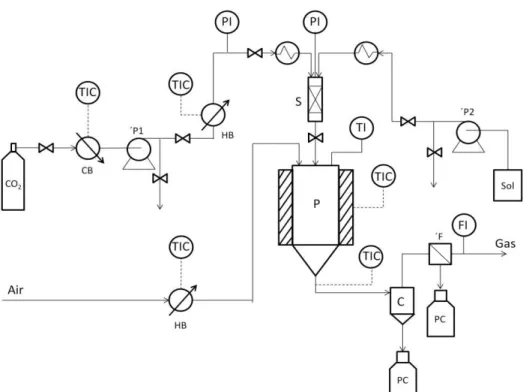
Before the atomization takes place, the formulations to be tested were dissolved in a 1% (v/v) acetic acid solution prepared with Milli-Q water with stirring until dissolved. This solution was fed to a laboratory scale SAA apparatus [99], schematically represented in Figure 2.1. After liquefying in a cryogenic bath, liquid carbon dioxide is pumped through a high-pressure pump (HPLC pump K-501, Knauer) into a heated bath and then mixed and solubilized within the liquid solution in the static mixer. The polymeric liquid solution is pressurized through a high-pressure pump (HPLC Pump 305 Gilson). The static mixer promotes the mixture between supercritical carbon dioxide and the liquid solution at near-equilibrium conditions. A kinetics static mixer 3/16, model 37-03-075 from Chemieer was used (internal diameter 4.8 mm, length 191 mm and 27 helical mixing elements). The mixture liquid solution-CO2 obtained is sprayed through a spray nozzle (I.D. 150 μm) to produce atomization in the precipitator. The precipitator
20
Figure 2.1: Schematic representation of SAA apparatus: (CB) cooling bath; (P1) CO2 pump; (HB)
heating bath; (PI) manometer; (Sol) liquid solution; (P2) liquid pump; (S) static mixer; (P) precipitator; (Gas) discharged gases; (C) cyclone; (PC) precipitated powder; (F) filter bag; (FI) flowmeter; (TI) temperature indicator; (TIC) temperature controller
Calibrated thermocouples, manometers, check valves, high pressure tubing and connections complete the apparatus as seen in Figure 2.2.
21
2.2.Particle Characterization
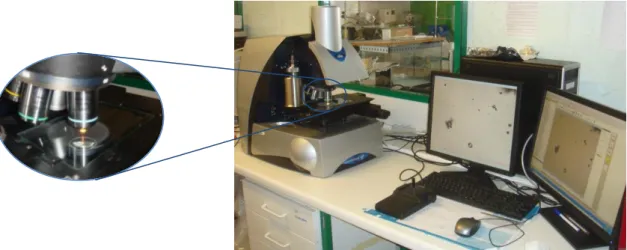
Particle size analysis was performed by a particle analyzer system (Morphologi G3 Essentials, from Malvern Instruments Ltd) shown in Figure 2.3. More than 20000 particles were considered in each particle size distribution calculation. The statistical analysis representing the particle size distribution was performed using the software OriginPro 8.7. The span, a measurement of the width of particle distribution was calculated as follows:
Where dV,90, dV,50 and dV,10 are the particle diameter in volume corresponding to 90, 50 and 10%
of the population, respectively.
Figure 2.3: Morphologi G3 Essentials used to determine particle size distribution.
The morphology of the atomized particles was investigated using Scanning Electron Microscopy (SEM) equipment from Hitachi, S-2400 instrument, with an accelerating voltage set to 15 kV and at various amplifications. All the samples were mounted on aluminum stubs using carbon tape and were gold coated before analysis.
Particles specific surface area was determined in a Micromeritics ASAP 2010 – Physisorption Analyzer in nitrogen using 50 mg of powder sample. The analysis was performed in two phases, first by heating the sample up to 320 K for 42 h, in order to release all adsorbed gases in the particle. Secondly, the temperature was lowered and maintained at 77.35 K during the time of the analysis. The results were treated using the software OriginPro 8.7.
The pore size distribution and bulk density was determined in a Micromeritics Auto Pore IV 9500 mercury porosimeter using 3 to 5 cm3 for each analysis. These analyses were performed in
22
True densities of microparticles were determined in a Micromeritics AccuPyc 1330 Pycnometer apparatus by measuring the pressure change of helium in a calibrated volume. The assays were performed at Faculty of Pharmacy, University of Lisbon.
Tapped density of microparticles was determined by compressing a known mass of powder in a volumetric container, and measuring the final volume.
In order to determine the aerodynamic diameter of the particles an equation based on the
Newton’s general dynamic equation for non-spherical particles with volume-equivalent diameter (dV) is used as follows:
Where ρ0 is the unit density (of spherical calibration spheres) and ρ is the particle density. CC is
the Cunningham slip correction. Cd is the particle drag coefficient which is generally a function
of particle sphericity and particle Reynolds number:
Where ρA and μ are the air density and viscosity, v is the particle velocity relative to the air
stream. ReA and ReV denote particles with diameters dA and dV respectively.
For the spherical particles in Stokes flow regime (Re<1), the drag coefficient assumes the well-known relationship: Cd=24/Re. Therefore, the aerodynamic diameter is calculated by a
simplified expression for Stokes aerodynamic diameter:
Where χ is the dynamic shape factor, defined as the ratio of the drag force on a particle to the drag force on the particle volume-equivalent sphere at the same velocity. Thus non-spherical particles tend to have a smaller aerodynamic diameter.
To calculate the Shot Weight, which is the amount of particles that can be released from capsule, it was used the Dosage Unit Sampling Apparatus (DUSA) (Copley), schematically represented in Figure 2.4.
Figure 2.4: Schematic representation of the DUSA, adapted from Copley Scientific [111]
23
powder in each HPMC capsules nº3 (Aerovaus) from an AerolizerTM dry powder inhaler. Air flow was regulated in a Critical Flow Controller model TPK (Copley) until a pressure drop of in P1 was 4kPa was achieved, and the flow of air was measured using a flow meter model DFM3 (Copley) and the time for each run were determined by applying the following equation:
Where Qair is the flow of air measured from the flow meter. Critical flow must be guaranteed by
checking if the ration P3/P2 ≤ 0.5. Then each capsule was released from an AerolizerTM inhaler
under the tested conditions for the duration determined as reported in the European Pharmacopoeia[112].
The emitted fraction (EF%) corresponds to the total loaded powder exiting the capsule, and is
calculated as follows:
Where mfull and mempty are the weights (mg) of the capsule before and after simulating the
inhalation and mpowder is the initial weight (mg) of the powder in the capsule.
The aerodynamic assessment of fine particles was determined by using an aluminum Andersen Cascade Impactor apparatus (ACI) (Copley), as shown in Figure 2.5, by using the same air flow determined in the Shot Weight.
Figure 2.5: Andersen Cascade Impactor apparatus
The air was drawn by using a High Capacity Pump model HCP5 (Copley) and air flow was regulated in a Critical Flow Controller model TPK (Copley). The capsules were prepared in the same way as for the Shot Weight for the same amount of time determined previously following the protocol of de European Pharmacopoeia [26]. The Fine Particle Fraction (FPF) was
determined by the interpolation of the percentage of the particles containing less than 5 μm. The Mass Median Aerodynamic Diameter (MMAD) was determined as the particle diameter
corresponding to 50% of the cumulative distribution. The Geometric Standard Deviation (GSD)
was determined by the following equation:
24
Where d84 and d16 are the diameters corresponding to 84% and 16% of the cumulative
distribution, respectively.
The X-ray diffraction patterns were obtained by treating the samples in a RIGAKU X-ray diffractometer, model Miniflex II. Samples were placed in a holder and analyzed through CuKα radiation (30 KV/15 mA), with a 2θ angle ranging between 2o and 55o with a scan rate of
1o/min.
The differential scanning calorimetry patterns were obtained by treating the samples in a differential scanning calorimeter Setaram DSC 131. The samples were placed in a holder were the temperature was raised from 25 oC to 300 oC in a heating rate of 10 oC/min.
FT-IR was performed in order to study the interactions between CHT and IBP, CHT and
TAC-β-CD. The FT-IR spectra of the materials were done using potassium bromide (KBr) tablets (1% w/w of powder in KBr) with resolution of 1 cm-1 and 16 scans per sample on a Tensor 27
FTIR (Bruker) coupled with Opus Spectroscopy Software.
The swelling degree was measured in aqueous solution of PBS at pH=7.4 or at a solution of pH=6.8 using Malvern Morphologi G3 equipment, Figure 2.6, at 25, 33 and 37 oC and was
evaluated using the following equation:
Where SD is the swelling degree, and Vs and Vd are the volumes of the swollen and the dry
polymer coatings, respectively. Since the swelling is directly related to the water uptake, it is possible to determine the volume of water adsorbed in the particles.
Figure 2.6: Malvern Morphologi G3 apparatus measuring particle swelling.
25
(S)-IBP and BSA present in each sample was quantified by UV spectroscopy at its absorbance maximum (at 264 and 278 nm, respectively) by external standard calibration. The corresponding drug-release profiles were represented through plots of percentage ( )
(calculated from the total amount of drug/protein contained in each matrix) vs. time. The total mass of released drug in each moment of the experiment was calculated taking into account the aliquots collected and the dilution produced by addition of fresh buffer.
Drug release from swelling-controlled systems for the first 60% of release is determined by the Korsmeyer-Peppas equation as follows:
Here, k is a constant and n is the diffusional exponent. The power-law equation can be observed
as the superposition of two processes of Fickian diffusion (n=0.43 for spherical geometries) and Case-II transport (n=0.85 for spherical geometries).
A modification of Korsmeyer’s semi-empirical equation was performed by Peppas and Sahlin by decoupling diffusion and “Case-II transport” with the following expression:
Where Kd, Kr and m are constants. The first term of the right-hand side is the diffusional
contribution, whereas the second term is the “Case-II transport” contribution, associated with
polymer relaxation.
The drug encapsulation was determined by milling a fixed amount of co-atomized powders and then adding a known amount of PBS. The solution was agitated for 2 h and then was centrifuged at 15 000 rpm for 5 min. The supernatant was then collected and the amount of drug was determined by UV spectroscopy at 264 for IBP and 278 nm for BSA. The drug encapsulation (E%) was determined by:
Where mr is the remained mass and mi is the initially uploaded mass.
Biodegradation of particles was carried out in the presence of 2 mg/mL of lysozyme dissolved in PBS at 37 oC. 20 mg of particles are incubated with 1 mL of lysozyme solution under agitation at 100 rpm for 10 min until swelling equilibrium is achieved. The solution is centrifuged at 15 000 rpm for 5 min and the supernatant removed. Then the particles are weighed and the process is repeated. Samples are weighted periodically and the percent weight remaining of the particles (Wr%) due to enzymatic degradation was calculated as follows:
where Wo is the weight of sample after 1 h swelling in lysozyme solution and Wt is the weight of


![Figure 1.7: Phase diagram of CO 2 , adapted from W. Leitner et al. [76]](https://thumb-eu.123doks.com/thumbv2/123dok_br/16476601.732065/34.892.205.689.106.445/figure-phase-diagram-adapted-w-leitner-et-al.webp)

![Figure 1.10: VLE of water-CO 2 -ethanol system, adapted from C. Duarte et al. [103]](https://thumb-eu.123doks.com/thumbv2/123dok_br/16476601.732065/38.892.208.689.105.409/figure-vle-water-ethanol-adapted-c-duarte-et.webp)