SUMMARY – CT perfusion (CTP) is part of the initial evaluation of stroke patients, allowing dif-ferentiation between infarcted tissue and the ischaemic penumbra and helping in the selection of patients for endovascular treatment. This study assessed the reliability of the qualitative evaluation CTP maps in defining the ischemic penumbra and identified potential pitfalls associated with this technique. We reviewed CTP scans of 45 consecutive patients admitted to our institution with ante-rior circulation acute ischaemic stroke. Two neuroradiologists performed qualitative evaluations of cerebral blood volume (CBV) and mean transit time (MTT) maps, using 24h follow-up non-contrast CT as surrogate marker for the area of definitive infarct. For each slice analyzed, the area of qualita-tive alteration in the CBV and MTT maps was classified as either being inferior, equal or superior to the area of infarct on the follow-up CT. Three out of 45 (7%) patients had admission CT CBV abnor-malities larger than follow-up lesions; 34/45 (76%) patients had infarct areas smaller than initial MTT prolongation. In the group of patients with no recanalization 12/19 (63%) had infarct areas smaller than initial MTT lesion. CBV abnormality is a reliable marker for an irreversible ischaemic lesion, although rarely it may overestimate the ischaemic “core”, possibly due to delay in contrast arrival to the brain. In the majority of patients without recanalization, MTT overestimated final infarct areas, probably because it does not differentiate true “at risk” penumbra from benign oligae-mia. Qualitative evaluation of CBV and MTT maps may overestimate the real ischaemic penumbra.
Reliability of CT Perfusion in the Evaluation
of the Ischaemic Penumbra
JOSÉ EDUARDO ALVES, ÂNGELO CARNEIRO, JOÃO XAVIER Department of Neuroradiology, Centro Hospitalar do Porto; Porto, Portugal
Key words: CT perfusion, acute stroke, brain infarction, cerebral blood volume, endovascular treatment
Introduction
In recent years the management of acute is-chaemic stroke has changed from a time-guided to a more physiologic-based approach 1. The
cornerstone of this modification was a better understanding of the altered physiology and immediate haemodynamic changes that follow occlusion of a great vessel in the anterior cir-culation, which led to the definition of two dis-tinct regions in the affected brain: the ischae-mic core – irreversibly injured, non-savageable tissue – and an area of ischaemic penumbra – severely hypoperfused, clinically sympto-matic tissue that will eventually progress to irreversible infarct if not reperfused quickly 2,3.
Considering that final infarct volume is a major determinant of long-term functional out-come in stroke patients 4,5, intra-arterial therapy
(IAT) has emerged as one of the most promising weapons for rescuing ischaemic penumbra
ar-eas and improving the clinical end result. How-ever, it has also been shown that the size of the pretreatment infarct core is inversely correlated with the chance of a good IAT response 6 and
di-rectly related to the risk of reperfusion haemor-rhage 7. For these reasons, reliable determination
both infarct core and ischaemic penumbra sizes is essential to a correct selection of patients for IAT and the clinical success of recanalization.
Perfusion studies have been successfully used to assess the infarct core and ischaemic penumbra and in some studies have even re-placed the time-window as a major selection criterion for IAT 8-10. CT perfusion (CTP) is
gain-ing more widespread use because it is more widely available and less time-consuming than MRI and has the potential to provide similar information 11,12. Nevertheless, the great
hetero-geneity of CTP acquisition protocols and post-processing software in use 13-15 has prevented
for the quantitative definition of the ischae-mic penumbra to date. In daily clinical prac-tice, we rely mainly on qualitative interpre-tation of CTP maps to determine the extent of the infarct core, the total area of tissue “at risk” and the size of the ischaemic penumbra. The specific aims of the current study were: (i) to determine the reliability of the qualitative evaluation of CTP maps in the assessment of the ischaemic penumbra and (ii) to identify po-tential pitfalls associated with this technique.
Methods
Patient Selection
We reviewed the records of all consecutive patients admitted to our institution with a diagnosis of acute ischaemic stroke from May 2009 to August 2013. Patients who met the fol-lowing criteria were included in the analysis: 1) admission CTP scanning within eight hours of onset; 2) CTA confirmation of large vessel occlusion in the anterior circulation (top of in-ternal carotid artery, M1 and M2 segments of the middle cerebral artery); 3) no intravenous thrombolytic therapy; 4) CT follow-up imag-ing performed between 24 to 48 hours, but not between three to seven days to avoid fogging effects and substantial oedema. Cases were ex-cluded for poor quality of CTP acquisition (n=5) due to motion or truncated arterial or venous density curves.
Imaging Acquisition
CTP was performed on two multidetector helical scanners (either 16 section BrightSpeed or 64 section LightSpeed; GE Healthcare, Mil-waukee, WI, USA) as a 45-second cine series, beginning five seconds after power injection of 50 mL of contrast at 4 mL/s. Image acquisition was every half second for the total examination. Imaging parameters were 80 kVp, 120 mAs, 1-second rotation time. Coverage consisted of one slab positioned parallel and superior to the orbital roof, with the most caudal imaging ac-quired at the level of the basal ganglia. Each slab consisted of four sections (16 row CT) or eight sections (64 row CT) 5 mm thick.
Image Analysis
CTP maps were post-processed by using a standard deconvolution software package
(CTP3 “Std,” GE Healthcare). Two neuroradi-ologists (one of whom was blinded to the loca-tion of the thrombus and to the reperfusion sta-tus) carried out independent qualitative visual evaluations of CBV and MTT maps, using the follow-up non-contrast CT hypodensity area as a surrogate marker for the area of definitive infarct. For each section analyzed, the area of qualitative alteration in the CBV and MTT maps was classified as being inferior, equal or superior to the final infarct area on the corre-sponding section of the follow-up CT. When the observers’ classifications were divergent, the images were reanalysed and a final consensus classification was achieved.
Statistical Analysis
Descriptive statistics are presented for the baseline demographic data, occlusion location, recanalization outcome and results. Kappa sta-tistics were calculated to assess interobserver agreement.
Results
We identified 45 patients eligible for analysis; 26 (58%) were women and the mean age was 63 years (range 20-85 years). Occlusion locations were as follows: ICA terminus (14 patients), M1 (24), M2 (7). Thirty-five patients underwent mechanical thrombectomy and the recanaliza-tion status in this group was: none (TIMI score 0) in nine patients, partial (TIMI score 1 or 2) in ten patients and total (TIMI 3) in 16 patients. The remaining ten patients did not undergo any kind of acute recanalization therapy.
When comparing the initial CBV abnormal-ity to the final infarct area the interobserver agreement K value was 0.50 (p<0.05); three out of 45 patients presented final infarct areas smaller than the initial CBV abnormality while 42 patients had final infarct areas similar to or larger than the initial CBV defect.
Concerning the MTT vs final infarct com-parison, the interobserver agreement K value was 0.86 (p<0.05); in 34 out of the 45 patients (76%) the final infarct area was smaller than the initial MTT abnormality.
When analysing only the group of 19 pa-tients with no recanalization (ten without any recanalization treatment and nine with unsuc-cessful thrombectomy) 12 patients (63%) had infarct areas smaller than initial MTT prolon-gation.
Discussion
Visual inspection of CTP colour maps can be an effective, fast and relatively simple way of identifying areas of core infarct and penumbra and may even be sufficient to guide decisions on intervention 10,16,17. However, this qualitative
technique is dependent on user interpretation, so recognition of potential pitfalls and diagnos-tic challenges is essential 18.
Our results revealed that in a large majority of cases (93%) admission CBV lesions progressed to infarct areas on follow-up CT. However, we found three patients in whom admission CBV abnormalities were larger than follow-up infarct lesions (Figures 1 and 2), that could suggest a reversibility of the ischaemic cores. Schaefer et al. have shown that true reversibility of core le-sions is very rare 19. In most cases, it is actually
“pseudoreversibility” due to the use of software with delay-sensitive algorithms. In fact, there are a number of extracranial (atrial fibrillation, severe internal carotid artery stenosis, conges-tive heart failure) and intracranial (extensive thrombus, poor collateralization) conditions that cause a delay in cerebral tracer bolus ar-rival. CBV calculation is particularly sensitive to this delay, resulting in an overestimation of CBV lesion. Ultimately, overestimation of the ischaemic core may lead to underestimation of core/penumbra mismatch, unnecessarily ex-cluding otherwise eligible patients from IAT.
We hypothesize that this “delay-effect” ex-plains the findings in our three patients because all three had clinical conditions that could
ac-count for overestimation of initial CBV lesion: (1) simultaneous bilateral MCA occlusions; (2) atrial fibrillation; (3) hypertrophic cardiomyop-athy with paroxysmal atrial flutter.
In order to avoid this potential pitfall, special attention must be paid to the inspection of ar-terial, venous, and tissue time-density curves. Likewise, the use of longer acquisition times (to permit the full wash-in and wash-out of con-trast) and new delay-correction software may help overcome this problem 15,19,20.
MTT prolongation is generally accepted as the parameter that best correlates with tissue “at risk” of infarction 21,22. We found that in a
majority of patients (76%) the follow-up infarct was smaller than the admission MTT abnor-mality. In particular, considering only the group of patients with no recanalization, where one would expect the final infarct to approximately match the initial MTT lesion, we found that in more than half of the cases (63%) MTT overes-timated final infarct lesion (Figures 3 and 4).
This overestimation results from the fact that areas of MTT prolongation include not only true critical ischaemic regions (“at-risk” penumbra) but also hypoperfused tissue with a delay in contrast arrival but that is clinically silent and not destined for infarction – the so-called benign oligaemia. The concept of benign oligaemia is very recent and not taken into account by much previous literature regarding perfusion studies in acute stroke 23. New interesting reports
sug-gest benign oligaemia may be present even in patients with an initial “malignant MRI profile”
24 and may persist in the stroke subacute stage 25.
Figure 1 Initial CT-CBV map in a patient with acute left mid-dle cerebral artery occlusion (M1 segment) demonstrates a fronto-parieto-temporal area of CBV reduction, representing the ischaemic core.
Figure 2 24h follow-up CT in the same patient and at the same level as Figure 1 reveals no major parenchymal hypodensity matching the CBV defect, suggesting reversibility of the is-chaemic core.
Kamalian et al. have shown that appropriately thresholded MTT maps could differentiate true “at-risk” penumbra destined to infarct from non-critical benign oligaemia, but also that the spe-cific thresholds varied with the post-processing technique used 23. Moreover, to our knowledge,
visual qualitative differentiation between these two regions has not been demonstrated and might be impossible. For this reason, our results raise concerns if visual interpretation of MTT maps is actually a good marker for true “at-risk” tissue and if the qualitative CBV/MTT mismatch evaluation can create a false, overestimated, ischaemic penumbra, which may influence therapeutic decisions and the outcome of IAT.
Potential limitations of our study include the relatively small number of patients identified with large vessel occlusion and no recanaliza-tion. Additionally, the limited spatial coverage (2 cm and 4 cm slabs) may have decreased our power to detect more differences between CBV and MTT maps and the follow-up CTs.
Furthermore, a limitation inherent to all stroke imaging studies is that they represent a snapshot in time and we did not perform any follow-up angiographic study to assess vascular recanalization, particularly in the no recanali-zation group, which could potentially explain the differences between the MTT and follow-up CT lesions. However it has been shown that the
probability of acute spontaneous recanalization after large vessels occlusion is very low 26,27.
Conclusions
Our study has shown that qualitative evalu-ation of CTP-CBV abnormality is a reliable marker for an irreversible ischaemic lesion in the setting of acute anterior circulation vessel occlusion. Still, CBV overestimation of the is-chaemic “core” is a potential pitfall to be aware of when assessing these studies, and it usually results from a delay in the arrival of contrast to the brain.
Qualitative definition of CTP-MTT lesions seems to overestimate the final infarct area, even in patients with no recanalization. Visual interpretation of MTT maps may not be a suit-able method to optimally identify true “at-risk” penumbra and to differentiate it from benign oligaemia.
Further investigation is warranted for a more accurate determination of the volume and loca-tion of the true ischaemic penumbra in CTP studies. In the future, the employment of effec-tive, standardized perfusion imaging methods will probably be essential to a proper selection of patients for IAT and the successful manage-ment of acute ischaemic stroke.
↑
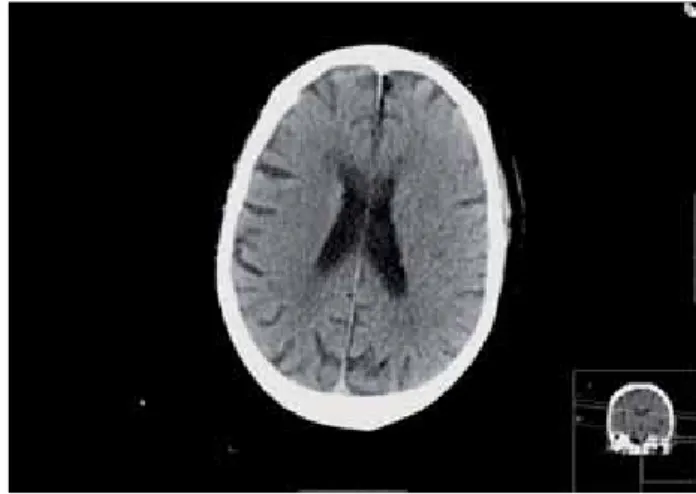
Figure 4 24h follow-up CT in the same patient and at the same level as Figure 3 demonstrates a small hypodense area of acute infarction at the left fronto-opercular region. No other areas of acute hypodensity were found in the remaining terri-tory of the middle cerebral artery.←
Figure 3 Admission CT-MTT map in a patient with acute occlusion of the top of the left internal carotid artery shows an extensive area of MTT prolongation, representing the total territory of the left middle cerebral artery. The patient was submitted to intra-arterial thrombectomy, which failed to re-move the thrombus.References
1 González RG. Imaging-guided acute ischemic stroke therapy: From “time is brain” to “physiology is brain”. Am J Neuroradiol. 2006; 27 (4): 728-735.
2 Baron JC. Mapping the ischaemic penumbra with PET: implications for acute stroke treatment. Cerebrovasc Dis. 1999; 9 (4):193-201. doi: 10.1159/000015955. 3 Alawneh JA, Jones PS, Mikkelsen IK, et al. Infarction
of ‘non-core-non-penumbral’ tissue after stroke: multi-variate modelling of clinical impact. Brain. 2011; 134 (Pt 6): 1765-1776. doi: 10.1093/brain/awr100.
4 Yoo AJ, Chaudhry ZA, Nogueira RG, et al. Infarct vol-ume is a pivotal biomarker after intra-arterial stroke therapy. Stroke. 2012; 43 (5): 1323-1330. doi: 10.1161/ STROKEAHA.111.639401.
5 Zaidi SF, Aghaebrahim A, Urra X, et al. Final in-farct volume is a stronger predictor of outcome than recanalization in patients with proximal middle cer-ebral artery occlusion treated with endovascular ther-apy. Stroke. 2012; 43 (12): 3238-3244. doi: 10.1161/ STROKEAHA.112.671594.
6 Lansberg MG, Straka M, Kemp S, et al. MRI pro-file and response to endovascular reperfusion after stroke (DEFUSE 2): a prospective cohort study. Lan-cet Neuro. 2012; 11 (10): 860-867. doi: 10.1016/S1474-4422(12)70203-X.
7 Lansberg MG, Thijs VN, Bammer R, et al. Risk factors of symptomatic intracerebral hemorrhage after tPA therapy for acute stroke. Stroke. 2007; 38 (8): 2275-2278. doi: 10.1161/STROKEAHA.106.480475.
8 Natarajan SK, Snyder KV, Siddiqui AH, et al. Safety and effectiveness of endovascular therapy after 8 hours of acute ischemic stroke onset and wake-up strokes. Stroke. 2009; 40 (10): 3269-3274. doi: 10.1161/ STROKEAHA.109.555102.
9 Jovin TG, Liebeskind DS, Gupta R, et al. Imaging-based endovascular therapy for acute ischemic stroke due to proximal intracranial anterior circulation occlu-sion treated beyond 8 hours from time last seen well: retrospective multicenter analysis of 237 consecutive patients. Stroke. 2011; 42 (8): 2206-2211. doi: 10.1161/ STROKEAHA.110.604223.
10 Turk AS, Magarick JA, Frei D, et al. CT perfusion-guided patient selection for endovascular recanaliza-tion in acute ischemic stroke: a multicenter study. J Neurointerv Surg. 2013; 5 (6): 523-527. doi: 10.1136/ neurintsurg-2012-010491.
11 Bivard A, Spratt N, Levi C, et al. Perfusion computer tomography: imaging and clinical validation in acute ischaemic stroke. Brain. 2011; 134 (Pt 1): 3408-3416. doi: 10.1093/brain/awr257.
12 Schaefer PW, Barak ER, Kamalian S, et al. Quan-titative assessment of core/penumbra mismatch in acute stroke: CT and MR perfusion imaging are strongly correlated when sufficient brain volume is im-aged. Stroke. 2008; 39 (11): 2986-2992. doi: 10.1161/ STROKEAHA.107.513358.
13 Dani KA, Thomas RG, Chappell FM, et al. Systematic review of perfusion imaging with computed tomogra-phy and magnetic resonance in acute ischemic stroke: heterogeneity of acquisition and postprocessing param-eters: a translational medicine research collaboration multicentre acute stroke imaging study. Stroke. 2012; 43 (2): 563-566. doi: 10.1161/STROKEAHA.111.629923. 14 Dani KA, Thomas RG, Chappell FM, et al. Computed
tomography and magnetic resonance perfusion imag-ing in ischemic stroke: definitions and thresholds. Ann Neurol. 2011; 70 (3): 384-401. doi: 10.1002/ana.22500. 15 Kudo K, Sasaki M, Yamada K, et al. Differences in CT
perfusion maps generated by different commercial soft-ware: quantitative analysis by using identical source data of acute stroke patients. Radiology. 2010; 254 (1): 200-209. doi: 10.1148/radiol.254082000.
16 Hellier KD, Hampton JL, Guadagno JV, et al.
Per-fusion CT helps decision making for thrombolysis when there is no clear time of onset. J Neurol Neu-rosurg Psychiatry. 2006; 77 (3): 417-419. doi: 10.1136/ jnnp.2005.067363.
17 Lui YW, Tang ER, Allmendinger AM, et al. Evalua-tion of CT perfusion in the setting of cerebral ischemia: patterns and pitfalls. Am J Neuroradiol. 2010; 31 (9): 1552-1563. doi: 10.3174/ajnr.A2026.
18 Best AC, Acosta NR, Fraser JE, et al. Recognizing false ischemic penumbras in CT brain perfusion studies. Radiographics. 2012; 32 (4): 1179-1196. doi: 10.1148/ rg.324105742.
19 Schaefer PW, Mui K, Kamalian S, et al. Avoiding “pseudo-reversibility” of CT-CBV infarct core lesions in acute stroke patients after thrombolytic therapy: the need for algorithmically “delay-corrected” CT perfusion map postprocessing software. Stroke. 2009; 40 (8): 2875-2878. doi: 10.1161/STROKEAHA.109.547679. 20 Konstas AA, Lev MH. CT perfusion imaging of acute
stroke: the need for arrival time, delay sensitive, and standardized postprocessing algorithms?. Radiology. 2010; 254 (1): 22-25. doi: 10.1148/radiol.09091610. 21 Wintermark M, Flanders A, Velthuis B, et al.
Per-fusion-CT Assessment of infarct core and penum-bra - receiver operating characteristic curve analy-sis in 130 patients suspected of acute hemispheric stroke. Stroke. 2006; 37 (4): 979-985. doi: 10.1161/01. STR.0000209238.61459.39.
22 Wintermark M, Fischbein NJ, Smith WS, et al. Ac-curacy of dynamic perfusion CT with deconvolution in detecting acute hemispheric stroke. Am J Neuroradiol. 2005; 26 (1): 104-112.
23 Kamalian S, Kamalian S, Konstas AA, et al. CT per-fusion mean transit time maps optimally distinguish benign oligemia from true “at-risk” ischemic penum-bra, but thresholds vary by postprocessing technique. Am J Neuroradiol. 2012; 33 (3): 545-549. doi: 10.3174/ ajnr.A2809.
24 Bang OY, Lee KH, Kim SJ, et al. Benign oligemia despite a malignant MRI profile in acute ischemic stroke. J Clin Neurol. 2010; 6 (1): 41-45. doi: 10.3988/ jcn.2010.6.1.41.
25 Li JJ, Chen XY, Soo Y, et al. Persistent benign oligemia causes CT perfusion mismatch in patients with intrac-ranial large artery occlusive disease during subacute stroke. CNS Neurosci Ther. 2013; 19 (8): 635-637. doi: 10.1111/cns.12133.
26 Ribo M, Molina CA, Rovira A, et al. Safety and ef-ficacy of intravenous tissue plasminogen activator stroke treatment in the 3- to 6-hour window using multimodal transcranial Doppler/MRI selection pro-tocol. Stroke. 2005; 36 (3): 602-606. doi: 10.1161/01. STR.0000155737.43566.ad.
27 De Silva DA, Fink JN, Christensen S, et al. Assessing reperfusion and recanalization as markers of clinical outcomes after intravenous thrombolysis in the echo-planar imaging thrombolytic evaluation trial (EPI-THET). Stroke. 2009; 40 (8): 2872-2874. doi: 10.1161/ STROKEAHA.108.543595.
José Eduardo Alves, MD Serviço de Neurorradiologia Hospital de Santo António Centro Hospitalar do Porto Largo Prof. Abel Salazar 4099-001 Porto, Portugal Tel.: + 351 222 077 500 E-mail: [email protected]