Genetic variation in oriental tobacco (Nicotiana tabacum L.) by
agro-morphological traits and simple sequence repeat markers
1Variação genética em tabaco oriental (Nicotiana tabacum L.) por marcadores
agro-morfológicos e traços simples de repetição de sequência
Reza Darvishzadeh2*, Leila Mirzaei3, Hamid Hatami Maleki4, Hernan Laurentin5 e Seyyed Reza Alavi6
ABSTRACT - The objectives of this study were to assess genetic diversity and determine differences between several oriental tobacco
genotypes by examining both agro-morphological traits and molecular markers. Simple lattice design with two replications was used to evaluate 100 oriental tobacco genotypes. Analysis of variance manifested that there is high level of genetic diversity in oriental-type tobaccos based on morphological traits including number of leaf, days to 50% flowering, leaf length, leaf width, leaf fresh weight, leaf dry weight, stem height and stem girth. Classification of genotypes using agro-morphological data by means of un-weighted pair-group method using arithmetic average (UPGMA) algorithm based on squared standardized Euclidean distances resulted four distinguishable groups that pursuit own geographical distribution. In the molecular marker investigations, a total of 13 simple sequence repeats (SSR) primer pairs were used to determine polymorphism of the test germplasm. Thirty five alleles were scored at 13 SSR loci. The average number of alleles per locus (na) and the effective allele number (Ae) were 2.69 and 2.34, respectively. By using SSR data, pair wise Jaccard’s similarity coefficients were produced. Grouping of genotypes via Jaccard’s similarity coefficients and using UPGMA clustering method lead to three groups that had not any accommodated with own origins. Results reveled that there is not completely agreement for classification based on agro-morphological and SSR loci in oriental-type tobaccos. Because of non influence of environmental effects on molecular marker, heterotic groups based on SSR markers could be closer to reality.
Key words: Cluster analysis. Euclidean distance. Genetic diversity. Jaccard’s similarity. Oriental tobacco.
RESUMO - Os objetivos deste estudo foram avaliar a diversidade genética e determinar as diferenças entre diversos genótipos de
tabaco oriental através tratos morfológicos e marcadores moleculares. O delineamento utilizado foi o látice simples com duas repetições e foram avaliados 100 genótipos de tabaco simples. As análises de variância mostarram que há pouca alto nível de diversidade genética nos tabacos to tipo oriental baseado nos tratamentos morfológicos incluindo número de folhas, dias para os 50% do florescimento, comprimento da folha, largura da folha, peso fresco da folha, peso seco da folha e maior comprimento e espessura do caule. A classificação dos genótipos usando o método de dados morfológicos por médias de grupos pareados não ponderados usando média aritmética (UPGMA) algoritmo baseado nas distâncias Euclidianas quadradas padronizadas resultou quatro grupos distintos de acordo co a própria distribuição geográfica. Nas investigações dos marcadores moleculares, um total de 13 repetições de sequências simples (RSS) de iniciadores pares foram utilizados para determinar o polimorfismo do germoplasma de teste. Trinta e cinco alelos foram marcados em 13 locos RSS. O numero médio de alelos por loco (na) e o número de alelo efetivo (Ae) forma 2,69 e 2,34, respectivamente. Utilizando os dados RSS, coeficientes de similaridade de Jaccard foram produzidos. O agrupamento de genótipos através dos coeficientes de similaridade de Jaccard e usando o método de agrupamento UPGMA que considera três grupos que não tiveram algum alojamento com suas próprias origens. Os resultados revelaram que revelaram que não estão completamente de acordo para classificação baseada em agro-morfológicas por loco e RSS em tabacos do tipo oriental. Por causa da não influencia dos efeitos ambientais no marcador molecular, grupos heteróticos com base em marcadores SSR poderiam estar mais próximos da realidade.
Palavras-chave: Análise de agrupamento. Diversidade genética. Distância Euclidiana. Similaridade de Jaccard. Tabaco oriental.
*Autor para correspondência
1Recebido para publicação em 05/11/11; aprovado em 03/10/12
Part of research project supported by the Institute of Biotechnology, Urmia University, Urmia, Iran
2Institute of Biotechnology, Urmia University, Urmia, Iran, r.darvishzadeh@urmia.ac.ir
3Department of Biology, Faculty of Science, Urmia University, Urmia, Iran, l.mirzaei_2009@yahoo.com
4Department of Agronomy and Plant Breeding, Faculty of Agriculture, University of Maragheh, Maragheh, Iran, hatamimaleki@yahoo.com 5Departamento de Ciencias Biológicas, Decanato de Agronomía, Universidad Centroccidental Lisandro Alvarado, Barquisimeto, Venezuela,
hlaurentin@ucla.edu.ve
INTRODUCTION
Nicotiana spp. is one of the most important nonfood
crops that are widely cultivated worldwide (MOON et al., 2009). It belongs to family Solanaceae which has more than 64 species, being Nicotiana tabaccum one of the most cultivated species among them (REN; TIMKO, 2001). It was proven that N. tabaccum is natural amphidiploid (2n = 4x = 48) arisen by hybridization of wild progenitor
species (N. sylvestris N. tomentosiformis). Numerous
types of tobacco are defined by different criteria such as region of production, intended use in cigar (i.e., filler, binder and wrapper) and cigarette manufacturing, method of curing (flue-, air-, sun- and fire-cured tobacco) as well as morphological and biochemical characteristics (i.e., aromatic fire-cured, bright leaf tobacco, Burley tobacco, Turkish or oriental tobacco) (REN; TIMKO, 2001). Turkish or oriental tobacco has a much milder flavor and contains less nicotine and fewer carcinogens than other varieties (DAVIS; NIELSEN, 1999). In order to get an American Blend type of cigarette, it is mixed with more robust tobacco such as Virginia and Burley tobacco.
The study of genetic diversity of tobacco is of interest for the conservation of genetic resources, broadening of the genetic base and practical applications in breeding programs. Several traits such as agro-morphological (WENPING et al., 2009; ZHANG, 1994; ZEBA; ISBAT, 2011), chemical and cytological traits (DARVISHZADEH et al., 2011; EL-MORSY et al., 2009; OKUMUS; GULUMSER, 2001) have already been used to study the genetic variation of tobacco germplasm. This is noticeable that agro-morphological traits usually vary with environment and the number of chromosomal characters is limited (LU, 1997). With the emergence of molecular markers such as amplified fragment length polymorphism (VOS et al., 1995), simple sequence repeat (THOMAS; SCOTT, 1993), and inter simple sequence repeat (PRADEEP REDDY et al., 2002), this is possible to evaluate genetic divergence of plant germplasm in greater detail. In this sense, several studies were used molecular markers (DAVALIEVA
et al., 2010; JULIO et al., 2006; REN; TIMKO, 2001;
YANG et al. 2007; YAO ZHANG et al., 2008) to reveal genetic diversity of N. tabaccum. Molecular markers are stable and detectable in all tissues, regardless of growth, differentiation and development or stage of the cell. They are not subject to environmental, pleiotropic or epistatic effects (AGARWAL et al., 2008; MOOSE; MUMM, 2008). With the advent of high-density SSR maps for tobacco it is feasible to estimate genetic variation with a large number of markers that are well distributed across the tobacco genome (BINDLER et al., 2007). Recently, SSR as a reproducible, codominant, wide genome coverage and multi allelic marker has been successfully
employed to reveal genetic variation of chewing tobacco genotypes (SIVA RAJU, 2011). Davalieva et al. (2010) could classify 10 tobacco genotypes into three groups using 24 microsattelite markers. The aim of this research was to employed SSR technique and agro-morphological traits simultaneously to assess the genetic variation of different local and exotic oriental tobacco genotypes belong to Urmia Tobacco Research Center of Iran.
MATERIAL AND METHODS
Field experimentOne hundred genotypes of tobacco (Nicotiana
tabacum L.) with different growth-type and origins were
investigated under filed conditions (Tabela 1).
Table 1- Name and origin of tobacco genotypes
Genotype Origin Genotype Origin C.H.T.269-12e Iran Pobeda 1 Russian
Ts 8 - Pl 7 Bulgaria
F.K.40-1 Iran L 17 Bulgaria
Samsun 959 Turkey Melnik 261 Bulgaria Samsun katenizi Turkey Triumph Yugoslavia
Try-Kula - B.S.31 Greece ss-289-2 - SPT 403 Iran B 12-2 Iran SPT 405 Iran B 16-10 Iran SPT 406 Iran B 104-1 Iran SPT 408 Iran B 181-1 Iran SPT 409 Iran K.B SPT 410 Iran G.D.165 Bulgaria SPT 412 Iran
Pobeda 2 Russian SPT 413 Iran
Kromograid Bulgaria SPT 420 Iran
Kramograd N.H.H. 565 Bulgaria SPT 430 Iran
Immni 3000 - SPT 432 Iran
kharmanli 163 Turkey SPT 433 Iran
Izmir Turkey SPT 434 Iran
Ploudive 58 Bulgaria SPT 436 Iran
T.K.23 - SPT 439 Iran
OR-205 Iran SPT 441 Iran
OR-379 Iran P.D.324 Iran
Trabozan Turkey P.D.325 Iran
Line 20 Iran P.D.328 Iran
Jahrom 14 Iran P.D.329 Iran
K.P.Ha - P.D.336 Iran
Mutant 3 Iran P.D.364 Iran
L 16 Iran P.D.371 Iran
C.H.T.209.12e Iran P.D.381 Iran
Xanthi Iran Mutant 4 Iran
C.H.T.283-8 Iran C.H.T.209.12e×F.K.40-1 Iran
C.H.T.266-6 Iran T-B-22 Iran
C.H.T.273-3b Iran Ohdarsuma Yugoslavia
Continuação Tabela 1
The ‘SPT’ and ‘Jahrom’ lines known as ‘Chopogh’ and water pipe tobacco respectively were selected from our local landraces. The ‘PD’ lines are recombinant inbred lines coming from the cross between Basma S. 31 and Dubec 566. Other genotypes used in this study are inbred lines from different countries introduced from the CORESTA (Cooperation Center for Scientific Research Relative to Tobacco, Paris, France) collection or pure lines kindly provided by Iranian Tirtash Tobacco Research Centre (ITTRC).
Tobacco seeds were sown at a rate of
approximately 5 g m-2 in bed. After sowing the seeds, a
fine layer of well fermented and sieved sheep manure was spread on top of beds. Then tobacco seedlings were transplanted to plots when plant averaged about 12 cm in height. The experiment was conducted in a simple square lattice design (10 10) with two replications. Each plot was comprised of three lines of 5m, with a
spacing of 65 20 cm. The plants were not topped
as is common with most other tobacco types (such as:
Virginia and Burley). The agro-morphological traits were plant height (PH), stem girth (SG), leaf number (LN), leaf length (LL), leaf width (LW) and day to 50% flowering (DF) that were recorded on 5 random plants in total competition per plot (KARA; ESENDAL, 1995). Dry leaf yield and fresh leaf yield were evaluated using total plants of plots with exception of border effects (KARA; ESENDAL, 1995).
DNA extraction and polymerase chain reaction
Considering to availability of leaf sample just for 70 genotypes out of 100 genotypes, total DNA was extracted from these 70 genotypes leaves following the method described by Doyle and Doyle (1987). Concentration of DNA samples was determined spectrophotometrically at 260 nm (BioPhotometer 6131; Eppendorf, Hamburg, Germany). The quality of the DNA was checked by running 1 l DNA in 0.8% (w/v) gels in 0.5X TBE buffer (45mM Tris base, 45mM boric acid, 1mM EDTA pH 8.0). DNA samples that gave a smear in the gel were rejected.
13 SSR primer pairs out of 278 from the tobacco SSR database (BLINDER et al., 2007) were used for DNA fingerprinting (Tabela2). The choice of SSR markers was based on clarity of produced bands. Polymerase chain reaction (PCR) was performed in a 20µl volume using a 96-well Eppendorf Mastercycler Gradient (Type 5331, Eppendorf AG, Hamburg, Germany). The reaction mixture contained 2.5mM of each primer (Tabela 2), 0.4 Unit of Taq DNA polymerase (Cinna Gen Inc., Tehran, Iran), 100µM of each dNTP (BioFluxbiotech, http://biofluxbiotech.com),
2µl 10X PCR buffer, 2mM MgCl2 (CinnaGen, Tehran,
Iran), ddH2O and 25ng template DNA. Amplification was
Table 2 - Name, sequence, linkage group and position of 13 SSR primers applied to 70 oriental tobacco genotypes
Name Sequence of primer F (5 ) Sequence of primer R (5 ) Linkag group Position (CM)a
PT30021 CATTTGAACATGGTTGGCTG CTCAACTCTCGTCGCTCTTG 4 22.7 PT30027 CCGAGAGTTGCATTTGAATTT AGGGTTCTACGCAAGAGATTG 13 98.6 PT30014 TGCCGTGTAAATTTCATTTGG AGGATTCCTAACGTGTATTATGTTCT 11 76.7 PT30241 AAGTCTCGTGTGGTTGCTTT AAAGGGCAATGTGTCTAGCTC 15 0 PT30250 GAACACACGTTCGTCATTGG ATAAGTCCCTTTAATTTAATTGCG 10 90.7 PT30202 TCGAAACCTCGAGGACAGTT TATCCAAATCTCCAAAGCCC 7 0 PT30285 CATCATGGCAAGTCACCATC TGCTGGAAATTAGCGAGGTT 18 55.3 PT20343 GGAACACCACCACCATAA GGAGCTCAGGTTCCAATG 4 0 PT30172 AAACAACGTCGAAGCATTTG ACGCATGAAATTGTAAGGGC 4 36 PT30165 ACCTCTGTGGCCGTAAGCTA CCTCTACTTCAACAGGGTAAGAAA 19 0 PT30008 CGTTGCTTAGTCTCGCACTG GGTTGATCCGACACTATTACGA 11 39.9 PT30126 GTGATTCCAGCGGAAGACAT TTCGAAATAAGTACCTAGAGTCGG 10 0 PT30034 GACGAAACTGAGGATATTCCAAA TGGAAACAAAGCCATTACCC 22 0.1
carried for 35 cycles consisting of a denaturation step at 94 ºC for 1 min, annealing at 55 ºC for 1 min and an extension step at 72 ºC for 1.5 min. An initial denaturation step at 94 ºC for 4 min and a final extension step of 10 min at 72 ºC were also included. The reaction products were mixed with an equal volume of formamide dyes (98% formamide, 10Mm EDTA, 0.05% bromophenol blue and 0.05% xylene cyanol) and resolved in a 3% (w/v) agarose
gel in 0.5X TBE buffer, stained with 1.0 g ml-1 ethidium
bromide and photographed under UV light using a Gel-Doc image analysis system (Gel Logic 212 PRO, USA).
Data analysis
Analysis of variance (ANOVA) followed by descriptive statistics were calculated for total genotypes based on agro-morphological traits using general linear model in the SAS 9.13 software (SAS Institute, Cary, NC). In order to comparing the classification results of agro-morphological data with marker data, 70 genotypes that had also marker data, were undertaken to clustering. Classification of genotypes using agro-morphological data was performed by means of un-weighted pair-group method using arithmetic average (UPGMA) algorithm based on squared Euclidean distances. Prior to squared Euclidean distance calculation, the data were standardized to have a mean of zero and a variance of one. Data processing was performed using SPSS 15.00 statistical software (SPSS/PC-15, SPSS Inc., Chicago, IL, USA; http://www.spss.com). The pseudo F statistic and the
pseudo T2 statistic (JOBSON, 1992) were examined to
establish the optimum numbers of morphological clusters by using SAS 9.13 software (data not shown).
About marker data, the amplification products were scored for the presence (1) and absence (0) of bands across the 70 genotypes to construct a binary data matrix. Several indices such as mean number of allele per locus (na), effective allele number (Ae), allele frequency, gene
flow (Nm), observed heterozygosity (Ho) and expected
heterozigosity (He) were estimated using GenAlEx 6.41
software (PEAKALL; SMOUSE, 2006) according to the following equations:
(1)
where na is the number of alleles at ith locus and n is the number of loci;
(2)
where Ae is the effective allelic number at a locus, and Pi is the frequency of the ith allele in a locus (HARTL; CLARK, 1997);
Allele frequency = (3)
which was calculated locus by locus, where NXX is
the number of homozygotes for allele X(XX), NXY is the
number of heterozygotes containing the allele X(Y can be any other allele), and N = the number of samples (HARTL; CLARK, 1997);
Nm = [(1/FST)-1]/4 (4)
where FST represents the degree of population
genetic differentiation (FRANKHAM et al. 2004); (5)
where Hoi represents the observed heterozygosity
of the ithlocus, and q
ij is the frequency of the j
th allele at ith locus (HARTL; CLARK, 1997);
(6)
where Hiis the expected heterozygosity of the ith
locus, and qij is the frequency of the jth allele at ith locus (LYNCH; MILLIGAN, 1994).
It was assumed that the gene frequency within a population was under Hardy-Weinberg equilibrium. Genetic similarity among individuals was calculated using Jaccard’s similarity coefficient (JACCARD, 1908). Dendrograms were constructed by the un-weighted pair group method using arithmetic average (UPGMA) algorithm. The efficiency-of-clustering algorithms and their goodness-of-fit were determined based on co-phenetic correlation coefficients by using NTSYS-pc version 2.11 software (ROHLF, 1998). The significance of co-phenetic correlation was tested using the mantel matrix correspondence test (MANTEL, 1967). All analysis was performed using the NTSYS-pc 2.11 software package (ROHLF, 1998).
RESULTS AND DISCUSSION
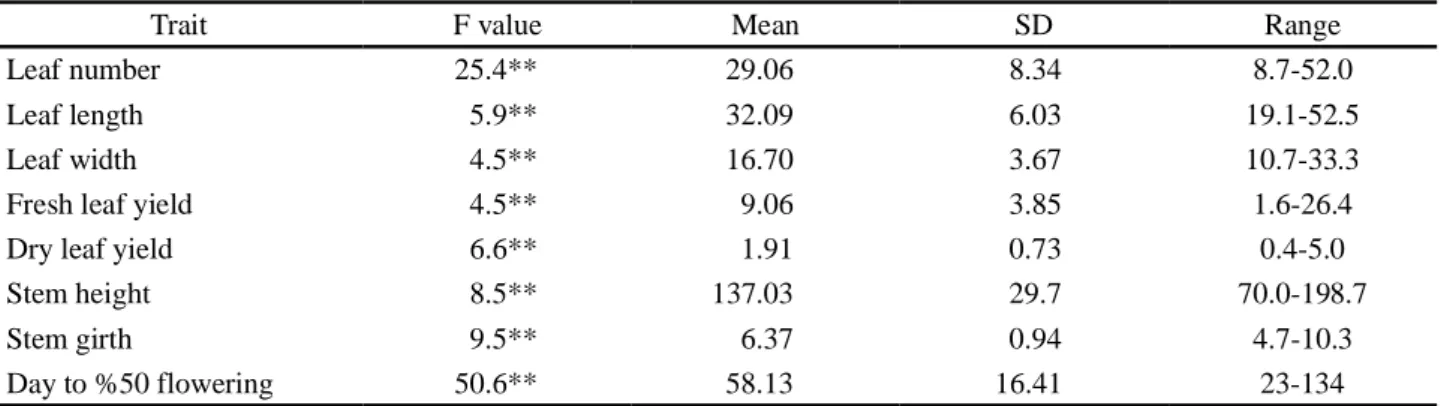
Agro-morphological traitsAccording to univariate statistical analysis (Tabela 3), there is wide ranges of genetic variation between oriental-type tobacco genotypes for all studied agro-morphological traits which show the possibility of selection among genotypes for improving tobacco.
Leaf number varied from 8.7 to 52 and leaf length ranged from 19.1 to 52.5 cm. Traits including leaf width, fresh leaf yield and dry leaf yield ranged from 10.7 to 33.3 cm, 1.6 to 26.4 kg and 0.4 to 5 kg, respectively. Stem height and stem girth fluctuated from 70 to 198.7 cm and 4.7 to 10.3, respectively. Days to 50% flowering ranged from 23 to 134 days.
Table 3 - Variation observed among the tobacco genotypes for the traits under study
Trait F value Mean SD Range
Leaf number 25.4** 29.06 8.34 8.7-52.0
Leaf length 5.9** 32.09 6.03 19.1-52.5
Leaf width 4.5** 16.70 3.67 10.7-33.3
Fresh leaf yield 4.5** 9.06 3.85 1.6-26.4
Dry leaf yield 6.6** 1.91 0.73 0.4-5.0
Stem height 8.5** 137.03 29.7 70.0-198.7
Stem girth 9.5** 6.37 0.94 4.7-10.3
Day to %50 flowering 50.6** 58.13 16.41 23-134
**Significant at a level of 1%
Maximum (29.7) and minimum (0.73) standard deviation corresponded to stem height and dry leaf yield, respectively. Relatively, large variation was detected for studied traits (Tabela 3). Utility of univariate statistical techniques in identification of tobacco genetic diversity has been reported by Wenping et al., (2009) and Zeba and Isbat (2011). Evaluation of fifteen diverse tobacco genotypes based on agro-morphological traits depicted that there is statistically significant differences between tobacco genotypes based on all studied morphological traits such as plant height, leaf number, leaf length, leaf width, stem girth and day to 50 flowering (ZEBA; ISBAT, 2011). Genetic variation for traits comprising leaf appearance, percent of dry matter, leaf area index, leaf number and
leaf length was also reported in F2 population of Burley
tobaccos (HONARNEJAD; SHOAIE-DEYLAMI, 2004).
There were some reports implying genetic variation of tobacco based on qualitative traits such as nicotine content (TSO et al., 1983), sodium, potassium and chlorine concentration in leaf (DARVISHZADEH
et al., 2011; TSO et al., 1983) as well as susceptibility
to disease such as stem rot (ELLIOT et al., 2007) and powdery mildew (DARVISHZADEH et al., 2010).
Classification of genotypes based on agro-morphological traits using UPGMA clustering algorithm separated them into four main groups (Figura1). Cluster I included two tobacco genotypes originated from Yugoslav that had distinguishable morphological performance in field conditions. Genotypes C.H.T.209.12.e and C.H.T.269.12.e that belong to Mazandran province of Iran established cluster II. Breeding lines known as SPT that
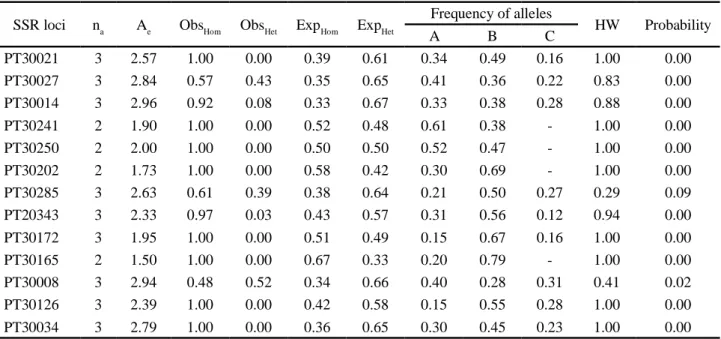
Table 4 - A summaries of genetic parameters across single sequence repeat loci in oriental tobacco germplasm
SSR loci na Ae ObsHom ObsHet ExpHom ExpHet Frequency of alleles HW Probability
A B C PT30021 3 2.57 1.00 0.00 0.39 0.61 0.34 0.49 0.16 1.00 0.00 PT30027 3 2.84 0.57 0.43 0.35 0.65 0.41 0.36 0.22 0.83 0.00 PT30014 3 2.96 0.92 0.08 0.33 0.67 0.33 0.38 0.28 0.88 0.00 PT30241 2 1.90 1.00 0.00 0.52 0.48 0.61 0.38 - 1.00 0.00 PT30250 2 2.00 1.00 0.00 0.50 0.50 0.52 0.47 - 1.00 0.00 PT30202 2 1.73 1.00 0.00 0.58 0.42 0.30 0.69 - 1.00 0.00 PT30285 3 2.63 0.61 0.39 0.38 0.64 0.21 0.50 0.27 0.29 0.09 PT20343 3 2.33 0.97 0.03 0.43 0.57 0.31 0.56 0.12 0.94 0.00 PT30172 3 1.95 1.00 0.00 0.51 0.49 0.15 0.67 0.16 1.00 0.00 PT30165 2 1.50 1.00 0.00 0.67 0.33 0.20 0.79 - 1.00 0.00 PT30008 3 2.94 0.48 0.52 0.34 0.66 0.40 0.28 0.31 0.41 0.02 PT30126 3 2.39 1.00 0.00 0.42 0.58 0.15 0.55 0.28 1.00 0.00 PT30034 3 2.79 1.00 0.00 0.36 0.65 0.30 0.45 0.23 1.00 0.00
na = observed number of alleles; Ae = effective number of alleles; ObsHet = observed heterozygosity; ExpHet = expected heterozygosity
derived from Iran`s northwest landraces by single seed descent method were located in cluster III. Other studied genotypes that had several sympatric origin grouped into cluster IV. Wenping et al. (2009) and Zeba and Isbat (2011) used multivariate statistical analysis such as cluster analysis and principle component analysis to grouping tobacco genotypes and identifying important agro-morphological traits. Identification of groups of genotypes with large distances could be effective in recognition of parental lines that might produce hybrid vigor in breeding programs. Several reports (ALEKSOSKI, 2010; KARA; ESENDAL, 1995) showed that there were heterosis for several agro-morphological traits in tobacco such as stem height, leaf number and dry leaf yield.
In this research, clustering of oriental-type tobacco based on morphological traits was in agreement with their geographical distribution and growth characteristics. Therefore, there is acceptable genetic diversity within oriental-tobacco genotypes that is accommodated by Darvishzadeh
et al. (2011) based on chlorine concentration in leaves. SSR markers
Similar to the agro-morphological traits, high molecular genetic variability was also observed among the genotypes studied which are in agreement with the finding of Ren and Timko (2001), Yang et al. (2007) and Davalieva et al. (2010) by means of AFLP, ISSR and SSR markers, respectively. The number of alleles detected for each SSR locus varied from 2 to 3 alleles per locus and a
total of 35 alleles were detected over all loci (Tabela 4). The mean number of allele per locus was 2.7, which was parallel with Davalieva et al. (2010) reports in Macedonian tobacco with average of 3 alleles per locus. There was not any rare allele (an allele that will be detected once in the 70 genotypes) in studied tobacco genotypes.
The effective number of alleles varied from 1.50 to 2.96 (Tabela 4). It was inferred from low differences among observed and effective number of alleles (Tabela 4), that there is low standard deviation between allele frequencies in each SSR loci. The observed homozygosity values ranged from 0.48 in locus PT30008 to 1.00 in PT30021, PT30241, PT30250, PT30202, PT30172, PT30165, PT30126 and PT30034 loci, with an average of 0.88 across all loci and the observed heterozygosity values ranged from 0.00 in loci PT30126, PT30034, PT30172, PT30165, PT30241, PT30250, PT30202, PT30021 to 0.52 in locus PT30008 with an average of 0.11 across all loci (Tabela 4). The expected homozygosity values ranged from 0.33 in locus PT30014 to 0.67 in locus PT30165, with an average of 0.43 across all loci (Tabela 4). The expected heterozygoty values also ranged from 0.33 in locus PT30165 to 0.67 in locus PT30014, with an average of 0.55 across all loci (Tabela 4).
The genetic similarity based on Jaccard similarity coefficient varied from a maximum of 0.92 (between Pobeda1 and C.H.T.209.12e genotypes) to a minimum of 0.00 (between C.H.T.269-12e and SPT 405 genotypes) with average of 0.32. So, there is a wide range of genetic variation among all oriental-type genotypes.
These diverse values of similarity between genotypes could validate that this collection is a valuable tobacco germplasm that already have not been exposed to degradation. The lowest value of similarity (0.0) was belong to two genotypes including C.H.T.269-12e and SPT 405 which were originated from two difference regions of Iran with very differed geographical conditions. SPT series genotypes are dwarf type with low flowering period that are distinguished dramatically them from others such as C.H.T.269-12e. Genotype C.H.T.209.12e belonged to Iran’s north province (Mazandaran) and had highest value of similarity with genotype Pobeda1 originated from Russian country near to north province of Iran.
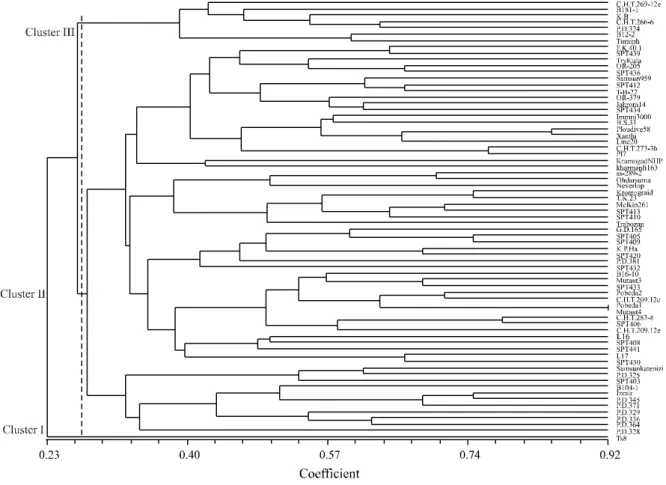
Classification of genotypes based on SSR data by using UPGMA clustering method separated them into three main clusters (Figura 2). The first, second and third clusters comprised 1.4%, 88.6% and 10% of genotypes, respectively. In this study, molecular marker data based clustering of oriental tobacco genotypes did not pursuit agro-morphological based grouping. This is similar to
finding of Yao Zhang et al. (2008). Since, 77% of the total genomic DNA in cultivated tobacco is composed of repetitive sequences (NARAYAN, 1987), therefore, there is low amount of non-repetitive DNA in the genome of tobacco that responsible for any morphological and quality traits variation. Therefore, recommended to use functional markers such as EST-SSR as barley (SALEM et al., 2010) to achieving precise evaluation of tobacco germplasm. In contrast to agro-morphological traits, there were not completely concurrences among geographical distribution of oriental-type genotypes and established clusters based on SSR marker data. Yao Zhang et al. (2008) also indicated that dendrogram constructed by using RAPD and AFLP markers in flue-cured tobaccos could not indicate any clear pattern of their geographical origins.
Considering both agro-morphological and SSR marker classifications, some genotypes trend to be located in the same group that is not unexpected because all of studied genotypes considered as oriental or semi oriental tobacco genotypes.
CONCLUSIONS
There were several studies in the genus Nicotiana that used growth characteristics and cytogenetic attributes to describing genetic diversity but there is little information about using agro-morphological traits accompanying with molecular markers data to reveal genetic variation within
N. tabaccum. Considering to agro-morphological traits
and SSR markers, there is significant variation within oriental-type tobacco germplasm. Structure of genetic diversity of oriental-type tobacco genotypes does not pursuit their geographical origins. There is not completely accommodation between classification based on agro-morphological traits and SSR markers. Regarding to reality of markers data, their information could be effectively used in tobacco heterosis breeding program.
ACKNOWLEDGEMENTS
The authors thank Urmia Tobacco Research Center for their practical help in field experiment and Urmia institute of biotechnology about lab facilities.
REFERENCES
AGARWAL, M. et al. Advances in molecular marker techniques and their applications in plant sciences. Plant
Cell Reports, v. 27, n. 04, p. 617-631, 2008.
ALEKSOSKI, J. Estimation of the heterotic effect in f1 generation of various tobacco genotypes and their diallel crosses. Biotechnology
& Biotechnological Equipment, v. 24, n. 02, p. 407-411, 2010.
BINDLER, G. et al. A microsatellite marker based linkage map of tobacco. Theoretical and Applied Genetics, v. 114, n. 02, p. 341-349, 2007.
DARVISHZADEH, R. et al. Genetic variability for chlorine concentration in oriental tobacco genotypes. Archive of
Agronomy and Soil Science, v. 57, n. 02, p. 167-177, 2011.
DARVISHZADEH, R. et al. Resistance to powdery mildew (Erysiphe cichoracearum DC.) in oriental and semi-oriental tobacco germplasms under field condition. Journal of Crop
Improvement, v. 24, n. 02, p. 122-130, 2010.
DAVALIEVA, K. et al. Genetic variability of Macedonian tobacco varieties determined by microsatellite marker analysis.
Diversity, v. 02, n. 04, p. 439-449, 2010.
DAVIS, D. L.; NIELSEN, M. T. Tobacco: Production, chemistry and technology. Oxford, UK: CORESTA, Blackwell Science, 1999. 480 p.
DOYLE, J.; DOYLE, J. A rapid DNA isolation procedure for small quantities of fresh leaf tissue. Phytochemical Bulletin, v. 19, n. 01, p. 11–15, 1987.
ELLIOTT, P. E.; LEWI, R. S. Evaluation of tobacco germplasm for seedling resistance to stem rot and target spot caused byThanatephorus cucumeris. Plant Disease, v. 92, n. 23, p. 425-430, 2008.
EL-MORSY, S. H. I. et al. Comparative studies on diploid and tetraploid levels of Nicotiana alata. Academic Journal of Plant
Sciences, v. 02, n. 03, p.182-188, 2009.
FRANKHAM, R. et al. A primer of conservation Genetics. Cambridge: Cambridge University Press, 2004. 234 p.
HARTL, D. L.; CLARK, A. G. Principles of population
genetics. 3rd ed. Sunderland, Massachusetts: Sinauer
Associates, Inc, 1997. 565 p.
HONARNEJAD, R.; SHOAI-DEYLAMI, M. Gene effect, combining ability and correlation of characterstics in F2 populations of Burley tobacco. Journal of Science and
Technology of Agriculture and Natural Resources, v. 08,
n. 02, p. 135-147, 2004. (In Persian).
JACCARD, P. Nouvelles recherches sur la distribution florale.
Bulletin de la Societe vaudoise des Sciences naturelles, v. 44,
p. 223-270, 1908.
JOBSON, J. D. Applied Multivariate Data Analysis. New York: Springer-Verlag, USA, 1992. 621 p. v. 2.
JULIO, E. et al. Detection of QTLs linked to leaf and smoke properties in Nicotiana tabacum based on a study of 114 recombinant inbred lines. Molecular Breeding, v. 18, n. 01, p. 69-91, 2006. KARA, S. M.; ESENDAL, E. Heterosis and combining ability analysis of some quantitative characters in Turkish tobacco.
Tobacco Research, v. 21, n. 02, p. 16–22, 1995.
LU, J. P. The application of PAGE in the cultivars identification of flue-cured tobacco. Seed, v. 05, p. 30-32, 1997. (In Chinese). LYNCH, M.; MILLIGAN, B. G. Analysis of population genetic structure with RAPD markers. Molecular Ecology, v. 03, n. 02, p. 91-99, 1994.
MANTEL, N. The detection of disease clustering and a generalized regression approach. Cancer Research, v. 27, n. 02, p. 209-220, 1967.
MOON, H. S. et al. Microsatellite-based analysis of tobacco (Nicotiana tabacum L.) genetic resources. Crop Science, v. 49, n. 06, p. 2149-2159, 2009.
MOOSE, S. P.; MUMM, R. H. Molecular plant breeding as the foundation for 21st century crop improvement. Plant Physiology, v. 147 n. 03, p. 969-977, 2008
NARAYAN, R. K. Nuclear DNA changes, genome differentiation and evolution in Nicotiana (Solanaceae). Plant Systematics
and Evolution, v. 157, n. 04, p. 161–180, 1987.
OKUMUS, A.; GULUMSER, A. Chiasma frequency chromosome pairing at tobacco genotypes in the Middle Black Sea region. Online
Journal of Biological Science, v. 01, n. 07, p. 612-613, 2001.
PEAKALL, R.; SMOUSE, P. E. GENALEX 6: genetic analysis in Excel. Population genetic software for teaching and research.
REN, N.; TIMKO, M. P. AFLP analysis of genetic polymorphism and evolutionary relationships among cultivated and wild Nicotiana species. Genome, v. 44, n. 04, p. 559-571, 2001. ROHLF, F. J. NTSYSpc: Numerical Taxonomy and
Multivariate Analysis System version 2.02. , Setauket, NY: Exeter Software, 1998.
PRADEEP REDDY, M. et al. Inter simple sequence repeat (ISSR) polymorphism and its application in plant breeding.
Euphytica, v. 128, n. 02, p. 9-17, 2002.
SALEM, K. F. M. et al. EST-SSR based estimates on functional genetic variation in a barley (Hordeum vulgare L.) collection from Egypt. Genetic Resource and Crop
Evolution, v. 57, n. 04, p. 515–521, 2010.
SIVA RAJU, K. Genetic diversity in Indian chewing tobacco (Nicotiana tabacum) as revealed by RAPD and SSR markers. The Indian Journal of Agricultural Sciences, v. 81, n. 01, p.15-19, 2011. THOMAS, M. R.; SCOTT, N. S. Microsatellite repeats in grapevine reveal DNA polymorphisms when analyzed as sequence-tagged sites (STSs). Theoretical Applied Genetics, v. 86, n. 08, p. 985–990, 1993.
TSO, T. C. et al. Simple correlation and multiple regression among leaf and smoke characteristics of burley tobaccos. Beitr
Tabakforsch International, v. 11, n. 03, p. 141-50, 1983.
VOS, P. et al. AFLP: a new technique for DNA fingerprinting.
Nucleic Acids Research, v. 23, n. 21, p. 4407-4414, 1995.
WENPING, L. I. et al. Correlation and path coefficient analysis and euclidean distance clustering for several characters in tobacco germplasm resource. Chinese Tobacco
Science, v. 30, p. 59-63, 2009.
YANG, B. C. et al. Assessing the genetic diversity of tobacco germplasm using intersimple sequence repeat and inter-retrotransposon amplification polymorphism markers. Annals
of Applied Biology, v. 150, n. 03, p. 393-401, 2007.
YAO ZHANG, H. et al. Genetic Diversity among Flue-cured tobacco cultivars based on RAPD and AFLP markers. Brazilian Archives of
Biology and Technology, v. 51, n. 06, p. 1097-1101, 2008.
YEH, F. C. et al. POPGENE version 1.31. Microsoft window based freeware for population genetic analysis. Canada: University of Alberta, 1999.
ZHANG, D. M. Study on surface structure scanning of some tobacco seeds with electrical-glass observing. Chinese Tobacco
Sinica, v. 02, p. 12-15, 1994. (In Chinese).
ZEBA, N.; ISBAT, M. Multivariate analysis for yield and yield contributing traits in F0 and F1 generations in tobacco (Nicotiana tabacum). Journal of Experimental Bioscience, v. 02, n, 01, p. 101-106, 2011.