3 2 3 2 3 2 3 2 3 2
Instituto de Biologia - UERJ, Departamento de Nutrição Aplicada - Escola de Nutrição - UNI-RIO
Mailing address: Márcia Barbosa Águila - Centro Biomédico/Instituto de Biolo-gia UERJ - Av. 28 de Setembro, 87 (fds) - 20551-030 - Rio de Janeiro, RJ, Brazil E-mail: [email protected]
English version by Stela Maris C. e Gandour
Objective - To assess the effect of different types of li-pid diets on the lili-pid metabolism of aging rats.
Methods - Fifty male Wistar rats were studied from the time of weaning to 12 and 18 months of age. Their diets were supplemented as follows: with soybean oil (S), canola oil (CA), lard and egg yolk (LE), and canola oil + lard and egg yolk (CA + LE). Blood pressure (BP) was measured every month, and the heart/body ratio (H/BR) was deter-mined. The rats were euthanized at the age of 12 and 18 months, and blood samples were collected for lipid analysis as follows: total cholesterol (TC), LDL-C, VLDL-C, HDL-C, triglycerides (TG), and glucose.
Results - The type of oil ingested by the animals signi-ficantly altered BP, H/BR, and serum lipid levels in rats at 12 and 18 months. No difference was observed in the survi-val curve of the animals in the different groups. The LE group had the highest BP, and the CA group was the only one in which BP did not change with aging. A reduction in the H/BR was observed in the LE and CA+LE animals. At the age of 12 months, differences in TC, HDL-C, LDL-C, VLDL-C, TG, and glucose were observed. At the age of 18 months, a significant difference in TC, HDL-C, and glucose was observed. The highest TC value was found in the CA group and the lowest in the S group.
Conclusion - No increase in BP occurred, and an improve-ment was evident in the lipid profile of rats fed a diet supple-mented with CA, in which an elevation in HDL-C levels was ob-served, as compared with levels with the other types of diet.
Key words: canola oil, lipoproteins, rats
Arq Bras Cardiol, volume 78 (nº 1), 32-8, 2002
Márci a Barbosa Águi l a, Carl a Cota Lourei ro, Al essandra da Rocha Pi nhei ro, Carl os Al berto Mandari m- de- Lacerda
Rio de Janeiro, RJ - Brazil
Lipid Metabolism in Rats Fed Diets Containing Different
Types of Lipids
Some experimental studies in animals have reported that an increase in cholesterol ingestion results in an elevation in the serum levels of cholesterol 1-3, with a resulting increase in the risk of cardiovascular diseases 4.
The n-3 fatty acids are long-chain polyunsaturated fatty acids naturally found in fish oils and in some plants. The fatty acids of the n-3 family are the following: eicosa-pentaenoic acid (EPA) (C20: 5n-3), docosahexaenoic acid (DHA) (C22: 6n-3), and α-linolenic acid (aLA) (C18: 3n-3) 5,6. The metabolic effects of EPA and DHA are already very well shown, but evidence of the metabolic effects of aLA is increasing. the aLA is a fatty acid derived from vegetables and is found in soybeans, canola, saffron, and peanut oils 7. After being ingested, aLA may be desaturated and altered into other forms of long-chain polyunsaturated fatty acids, such as EPA and DHA 8,9. Canola oil is an important option for dietary sources of the n-3 fatty acid family, mainly for vegetarians and individuals who do not eat fish 10.
Connor 11 reported the possible effects of the inges-tion of n-3 fatty acids on lipid metabolism: (1) inhibiinges-tion of VLDL synthesis, (2) decrease in apolipoprotein B synthesis, (3) increase in VLDL catabolism, (4) decrease in LDL synthesis, and (5) decrease in postprandial lipemia.
Lipoproteins are closely related to the risk of cardiovascular diseases, as follows: low-density lipoproteins (LDL) indicate an increased risk, and high-density lipoproteins (HDL) are conside-red a protective factor 12,13. When the risk of cardiovascular di-seases was considered a function of HDL-C and LDL-C, the inci-dence of cardiovascular diseases increased with the increase in the concentration of LDL-C and the decrease in the concentra-tion of HDL-C 14. Both LDL-C and HDL-C are independent risk factors for cardiovascular diseases 15. This is important in esta-blishing the conditions that influence the changes in LDL and HDL levels throughout life.
3 3 3 3 3 3 3 3 3 3 man inclusive 20. Despite the difficulty in producing
hyper-lipidemia and atherosclerosis in rats, special diets may indu-ce an increase in the serum levels of cholesterol, and also in-duce arterial hypertension or renal diseases 21, such as tho-se reported in our team’s previous studies 22-25.
The objective of this study is to investigate the possi-ble influence of 4 experimental diets with different types of fat on the cardiovascular indicators and on the lipid meta-bolism of rats during aging.
Methods
We studied 50 male Wistar rats obtained from colonies maintained by the Universidade do Estado do Rio de Janei-ro. The research followed the guidelines established in the Guide for Care and Use of Laboratory Animals published by the US National Institutes of Health (NIH Publication No. 85-23 revised in 1985).
The animals were placed in polypropylene boxes, in groups of 5, maintained at a controlled temperature (21±1°C) and humidity (60±10%). The environment underwent lightness-darkness cycles of 12 hours (artificial light from 7 AM to 7 PM) and cycles of air exhaustion (15 min/h). The groups received unrestricted water and the same baseline diet composed of casein, wheat flour, starch, egg white, and a mixture of vitamins and minerals. All diets had the same composition as follows: 47% carbohydrates, 29% lipids and 23% proteins with 11.5% dietary fibers, and 0.05% sodium (or 500 mg/kg of diet). The caloric values of the diets were practically the same. The diets were prepared once a week in the laboratory and stored at a temperature of +4°C. De-pending on the group, the diet was supplemented with dif-ferent types of lipids as follows: soybean oil (S group), nola oil (CA group), lard and egg yolk (LE group), and ca-nola oil + lard and egg yolk (CA + LE group).
The animals received their diets beginning at the time of their weaning at the age of 21 days. For each group, at le-ast 5 animals were euthanized at 12 and 18 months of life. Tail Blood pressure (BP) was measured with a pressure ple-thysmograph (RTBP1007, Kent Scientific Co., Litchfield, CT, USA) once a month. Total body mass was also asses-sed at the same frequency.
At the expected time, the animals were euthanized after they had fasted from 7 PM of the previous evening. They were anesthetized with diethyl ether. Their thorax was opened and a blood sample was collected from the right atrium. Then, 3 mL of 10% KCl was injected into the left ventricle until cardiac arrest in diastole occurred. The heart was withdrawn by sectioning the great vessels, as short as possible; cardiac volume and weight were determined by fluid displacement (Scherle’s method) 26. The heart/body ratio (H/BR) was determined by dividing the respective weights.
The following biochemical parameters were analyzed: total cholesterol (TC), triglycerides (TG), low-density lipoprotein cholesterol (LDL-C), high-density lipoprotein cholesterol (HDL-C), very-low-density lipoprotein
choles-terol (VLDL-C), and glucose. Plasma was separated from total blood by centrifugation at room temperature for 15 minutes with 120 grams of gravity, and, then, it was stored at a tem-perature of -80°C until being analyzed in the laboratory 1,27. Glucose was measured using the enzymatic method with i kit Art. 07.3757.7 (U.S.#42954); cholesterol was measured with the cholesterol kit 1.19738.0001 KgaA 64271, Multi-Test Calibration System, Merck Cat. nº 1.19720.0001 (Darmstadt, Germany); HDL was measured using the DIASYS kit Cat. nº 10.351.030; triglycerides were measured using the triglyce-ride kit 1.19706.0001 KgaA 64271, Multi-Test Calibration System, Merck Cat. nº 1.19729.0001 (Darmstadt, Germany). The LDL, VLDL, and chylomicron fractions were abundan-tly precipitated by the addition of phosphotungstic acid in the presence of magnesium ions. After centrifugation, HDL-C, which was maintained in suspension, was determined. LDL-C was calculated according to Friedwald’s formula 28. The Mantel-Haenszel test (T) was used for comparing the survival curves of the animals in the different groups. If the null hypothesis were true, T was analyzed with χ2 distri-bution (chi-square with 1 degree of freedom) 29. Descriptive statistics were calculated for all parameters. The differences between the groups were tested 2 by 2 using the nonparame-tric Mann-Whitney test with a significance level of 0.05 30.
Results
The results are summarized in table I and in figures 1 and 2. The type of oil ingested by the animals significantly altered BP, H/BR, and serum levels of lipids in rats at 12 and 18 months of age. No significant difference was observed in the survival curve of the animals considering the different groups.
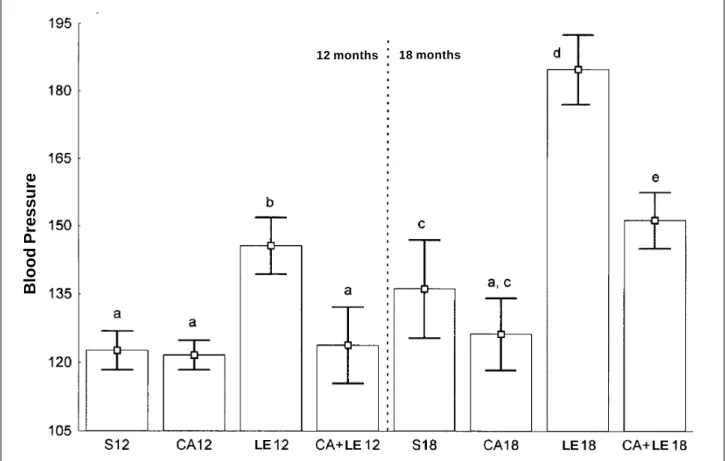
Variations in BP are shown in figure 1. At the age of 12 months, the LE group had the highest. The differences were significant in the following group comparisons: S versus LE (+17%), CA versus LE (+16%), and LE versus CA+PY (-18%). At the age of 18 months, the increase in BP in the LE group was even more marked, and the CA+ LE group also showed an increase in BP. The differences were significant in the following group comparisons: S versus LE (+29%), S versus CA+LE (+12%), CA versus LE (+32%), CA versus CA+LE (+15%), and LE versus CA+LE (-24%).
A comparison of the results at 12 and 18 months revea-led that the CA group was the only one in which a change in BP was not observed with aging. The other 3 groups sho-wed an increase in BP. The S group shosho-wed a 10% increase, the LE group a 23% increase, and the CA+LE group an 18% increase.
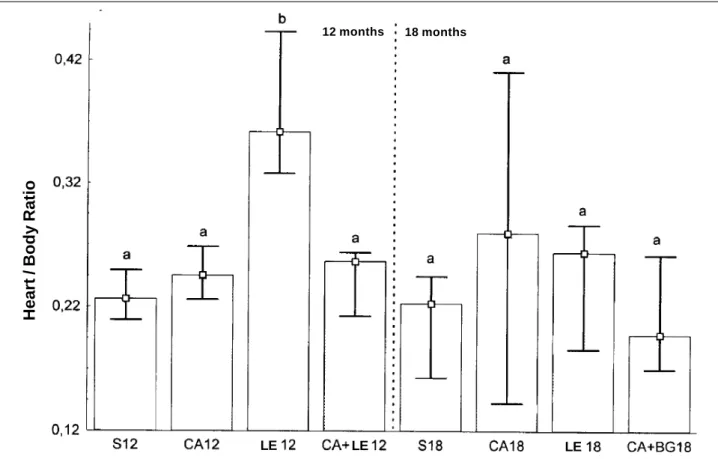
Variations in H / BR are shown in figure 2.
At the age of 12 months, no significant difference in H/ BR was observed in the following groups: S versus LE (+43%) and CA versus LE (+31%).
At the age of 18 months, no difference in H/BR was observed in the groups studied.
3 4 3 4 3 4 3 4 3 4
CA groups, no alteration in H/BR was observed with aging. A reduction in H/BR was observed in the LE and in the CA+LE groups. The LE group had an 86% reduction and the CA+LE group a 37% reduction in H/BR.
Variations in body weight are shown in table I. At the age of 12 months, a significant difference in body weight oc-curred in the S versus CA (-20%) groups and in the S versus LE (-34%) groups. At the age of 18 months, no difference in body weight occurred in the groups studied. Comparing the results at 12 and 18 months, no difference was observed.
Glucose and serum lipid levels are shown in table I. At the age of 12 months, differences in TC, HDL-C, LDL-C, VLDL-C, TG, and glucose were observed. Differen-ces were significant among the following groups: for TC, S versus CA+LE groups 22%), CA versus CA+LE groups (-27%), and LE versus CA+LE groups (-37%); for HDL-C, the highest value was in the CA group (+25% than in the S group, +103% than in the LE group, and +65% than in the
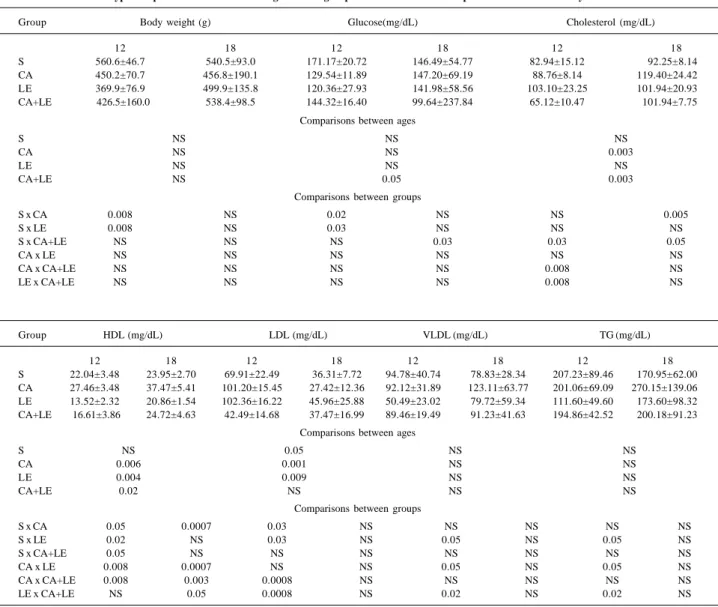
CA+LE group), the lowest HDL-C value was found in the LE group, and the differences between S versus LE groups (-39%) and S versus CA+LE groups (-25%) were also signifi-cant. At the age of 12 months, all groups, except the CA+LE group, had increased levels of LDL-C. LDL-C levels were hi-gher in the LE group and lower in the CA+LE group, but sta-tistically significant differences occurred in the following comparisons: S versus CA groups (+45%), S versus LE groups (+46%), CA versus CA+LE groups (-58%), and LE versus CA+LE groups (-59%). VLDL-C and TG also had the same pattern of variation; the highest values of VLDL-C and TG were found in the S group, and the lowest in the LE group. At the age of 12 months, the S group had the heavi-est animals. Significant differences occurred in the follo-wing comparisons: S versus LE groups (-47% for VLDL-C and -46% for TG), CA versus LE groups (-45% both for VLDL-C and TG), and LE versus CA+LE groups (+77% for Table I - Results (mean±SD) of the concentration of glucose and serum lipids at 12 and 18 months of age in rats fed diets supplemented with different
types of lipids. Differences between ages and the groups were tested with the nonparametric Mann-Whitney test.
Group Body weight (g) Glucose(mg/dL) Cholesterol (mg/dL)
12 18 12 18 12 18
S 560.6±46.7 540.5±93.0 171.17±20.72 146.49±54.77 82.94±15.12 92.25±8.14
CA 450.2±70.7 456.8±190.1 129.54±11.89 147.20±69.19 88.76±8.14 119.40±24.42 LE 369.9±76.9 499.9±135.8 120.36±27.93 141.98±58.56 103.10±23.25 101.94±20.93 CA+LE 426.5±160.0 538.4±98.5 144.32±16.40 99.64±237.84 65.12±10.47 101.94±7.75
Comparisons between ages
S NS NS NS
CA NS NS 0.003
LE NS NS NS
CA+LE NS 0.05 0.003
Comparisons between groups
S x CA 0.008 NS 0.02 NS NS 0.005
S x LE 0.008 NS 0.03 NS NS NS
S x CA+LE NS NS NS 0.03 0.03 0.05
CA x LE NS NS NS NS NS NS
CA x CA+LE NS NS NS NS 0.008 NS
LE x CA+LE NS NS NS NS 0.008 NS
Group HDL (mg/dL) LDL (mg/dL) VLDL (mg/dL) TG (mg/dL)
12 18 12 18 12 18 12 18
S 22.04±3.48 23.95±2.70 69.91±22.49 36.31±7.72 94.78±40.74 78.83±28.34 207.23±89.46 170.95±62.00 CA 27.46±3.48 37.47±5.41 101.20±15.45 27.42±12.36 92.12±31.89 123.11±63.77 201.06±69.09 270.15±139.06 LE 13.52±2.32 20.86±1.54 102.36±16.22 45.96±25.88 50.49±23.02 79.72±59.34 111.60±49.60 173.60±98.32 CA+LE 16.61±3.86 24.72±4.63 42.49±14.68 37.47±16.99 89.46±19.49 91.23±41.63 194.86±42.52 200.18±91.23
Comparisons between ages
S NS 0.05 NS NS
CA 0.006 0.001 NS NS
LE 0.004 0.009 NS NS
CA+LE 0.02 NS NS NS
Comparisons between groups
S x CA 0.05 0.0007 0.03 NS NS NS NS NS
S x LE 0.02 NS 0.03 NS 0.05 NS 0.05 NS
S x CA+LE 0.05 NS NS NS NS NS NS NS
CA x LE 0.008 0.0007 NS NS 0.05 NS 0.05 NS
CA x CA+LE 0.008 0.003 0.0008 NS NS NS NS NS
LE x CA+LE NS 0.05 0.0008 NS 0.02 NS 0.02 NS
3 5 3 5 3 5 3 5 3 5 VLDL-C and +75% for TG). At the age of 12 months,
glyce-mia was altered in the different groups. The highest glucose level was in the S group, and the lowest in the LE group; significant differences, however, occurred only in the S ver-sus CA (-24%) and in S verver-sus LE (-30%) groups.
At the age of 18 months, a significant difference was fo-und in the levels of TC, HDL-C, and glucose. The highest TC value was found in the CA group, and the lowest in the S group; significant differences occurred in S versus CA groups (+29%) and S versus CA+LE groups (+11%). For HDL-C, the highest value was in the CA group, and the lowest in the LE group; significant differences occurred in S versus CA groups (+57%), CA versus LE groups (-44%), CA versus CA+LE groups (-34%), and in LE versus CA+LE groups (+19%). Glucose was different only in S versus CA+LE groups (-37%). LDL-C, VLDL-C, and TG showed no significant differences.
Comparing the results obtained at 12 and 18 months, in regard to TC, no variation was found in the S and LE groups. The CA and CA+LE groups showed the following increases: +35% in the CA group and +57% in the CA+LE group. In regard to HDL-C values, the S group showed no variation. In the remaining groups, HDL-C levels increased as follows: +37% in the CA group, +54% in the LE group, and +49% in the CA+LE group. LDL-C levels decreased in all groups, except in the CA+LE group, as follows: -48% in the S group, -73% in the CA group, -55% in the LE group.
The CA+LE group was the only one to show a different pattern; LDL-C levels did not change in the ages studied. VLDL-C and TG levels did not change in the groups studied. For glycemia, the S, CA, and LE groups showed no varia-tion; in the CA+LE group, a reduction in glycemia was observed at the age of 18 months (-31%).
Discussion
We observed that the diets supplemented with diffe-rent dietary lipids influenced serum lipid levels. The experi-mental diets in our study contained 3 to 10 times the amount of lipids recommended for the normal diet of rats 31, which were required for determining alterations in the lipoproteins of rats, which are animals resistant to hyperlipidemia 21.
Aging by itself affects the metabolism of lipids. In rats, no difference was reported in total cholesterol levels between 2 and 12 months of age, but a significant increase in total cholesterol was observed at the age of 24 months 32, which is in accordance with our study that showed an elevation in serum levels of TC and HDL-C at the age of 18 months. Despite the great variations in the blood bioche-mistry of the animals of the different groups at different ages, the values found were within the 95% confidence inter-val of the inter-values considered normal for male Wistar rats 33.
Increased LDL-C levels and decreased HDL-C levels in Fig. 1 - Variations in blood pressure at the ages of 12 and 18 months in rats fed diets supplemented with different types of lipids. Nnonsignificant; TG-triglycerides. Groups: S-soybean group; CA-canola group; LE-lard and egg yolk; CA+LE-canola + group. The lower case letters on the bars indicate, when different, statistically significant differences (P<0.05).
18 months 12 months
Blood Pressure
3 6 3 6 3 6 3 6 3 6
the animals receiving pork fat and yolk were not unexpected when compared with those in the other groups, and this result is in accordance with a previous study on this subject 22. The differences in the serum lipid levels of the rats in the S and CA groups may result from the composition of the fatty acids of these 2 oils. The soybean oil has approximately 50% linoleic oil (LN) (18:2n-6), and the canola oil has a mixture of oleic and alpha-linolenic acid (aLA). The oleic acid does not compete with aLA in the conversion of long-chain polyunsaturated fatty acids (n-3). McLennan and Dallimore 8 reported that the elevated content of LN found in the soybean oil may reduce the efficiency of aLA and they suggested that the LN/aLA ratio might determine the efficacy of the conversion into eicosapentaenoic acid (EPA) and docosahexaenoic acid (DHA).
Baba et al 34 suggest that the presence of aLA in canola oil may contribute to its effect in reducing TG and TC levels. Glycemia does not usually change over time 33. In our study, the alterations in glycemia comprised an increase in the glucose levels in the S group at the age of 12 months, probably due to body mass gain that occurs at this age, and a reduction in the glucose levels in the CA+LE group at the age of 18 months. This group had no alteration in body mass during aging. The above-cited alterations in glycemia had no relation to the type of lipid ingested or to time.
Total cholesterol seems to be more influenced by time than by the type of lipid ingested. HDL-C, however, was the
lipoprotein most influenced by the type of dietary lipid. The CA group had the highest levels of HDL-C both at 12 and 18 months of age. This finding is supported by the study carried out by Kobatake et al 35, who assessed the lipid metabolism of rats ingesting a mixture of polyunsaturated fatty acids (PFA), n-3 FA inclusive. The other groups studied also had an increase in HDL-C levels over time; this increase, however, was not as marked as that in the CA group.
A significant increase in lipoprotein levels usually occurs during aging, particularly, in LDL-C levels. The progressive increase in the concentration of LDL-C during aging represents a higher risk for cardiovascular diseases 2,32, which was observed in this study with rats. In our study, the experimental diets with pork fat and yolk (LE group) and with canola oil + pork fat and yolk (CA+LE group) contained 3% and 1.5% dietary cholesterol, respectively; however, the most affected were LDL-C and HDL-C levels in the different groups and at both ages. Different from that which happens in humans, in the rats in the present study, a reduction in LDL-C and an increase in HDL-C occurred with age.
Another important aspect of the analysis of the influence of dietary oil on the lipid metabolism of rats is the polyunsaturated/saturated fatty acid ratio (PFA/SFA). An elevated PFA/SFA ratio is believed to reduce serum lipid le-vels 27. Monounsaturated fatty acids (MFA) have also been reported to reduce serum lipid levels as effectively as does PFA 6,37. The PFA+MFA/SFA ratio, however, has been con-Fig. 2 - Variations in the heart/body ratio at 12 and 18 months of age in rats fed diets supplemented with different types of lipids. NS- nonsignificant; TG-triglycerides. Groups: S-soybean group; CA-canola group; LE-lard and egg yolk; CA+LE-canola + group. The lower case letters on the bars indicate, when different, statistically significant dif-ferences (P<0.05).
LE LE LE
Heart / Body Ratio
3 7 3 7 3 7 3 7 3 7 sidered an even better indicator of the effect of dietary oil on
serum lipids 27. Canola oil, pork fat, and yolk contain a hi-gher amount of MFA than does soybean oil. In this study, the diets in the CA, LE, and CA+LE groups contained 58%, 50%, and 53% MFA, respectively. According to the PFA+ MFA / SFA hypothesis, the canola oil, which contains 92% MFA+PFA, may favor a significant increase in HDL-C when compared with that of other groups. Soybean oil has a small amount of MFA (26%), a high amount of PFA (61%), and a relatively high amount of MFA+PFA, which, however, is smaller than that in canola oil.
Huang and Chang 38 studied the effects of different types of dietary oils containing fixed ratios of fatty acids (PFA/SFA = 1, PFA+MFA/SFA = 5.7 and 4) in rats and ob-served that MFA may increase, instead of reduce, TC, TG, LDL-C, and hepatic cholesterol. A higher PFA/SFA ratio was reported to be possibly better 27. In the present study, however, the animals in the CA and S groups had differen-ces in serum lipids, despite the similar PFA/SFA ratios of their diets. A more detailed discussion about the composi-tion of the diets was reported in a previous study by this team 25. Of the lipids used in this study, the PFA+MFA/SFA ratio was higher in the CA group (11%) and lower in the LE group (2%), which may indicate the existence of a possible relation between PFA+MFA/SFA and HDL-C. The PFA content was lower in the LE (15%) and CA+LE (21%) groups, relatively high in the CA group (33%), and higher in the S group (61%). The PFA/SFA ratio was 4.4 in soybean oil and 4.1 in canola oil, indicating that no relation exists between PFA/SFA and serum lipids in rats. The PFA/SFA ratio in the S and CA groups was 5 times higher than that in the CA+LE (0.8) and LE (0.4) groups.
In regard to the biometry of the animals, diets supple-mented with different dietary lipids influenced BP and H/BR in rats at 12 and 18 months of age. The type of dietary lipid is known to affect BP. Diets with a great amount of saturated fat may increase BP, while diets with higher amounts of po-lyunsaturated and monounsaturated fat may reduce BP 39,40. A cholesterol-rich diet primarily causes pressure overload 40, which may explain the BP increase observed in animals fed a diet supplemented with lard and egg yolk. In our study, even though the sodium content was the same in the 4 expe-rimental diets, the animals in the LE group had higher BP levels at the age of 12 months, and this increase was even more marked at the age of 18 months. The animals in the CA+LE group, which had no BP alteration at the age of 12 months, had an increase in BP at the age of 18 months.
The animals’ body mass had great variations over time; the animals in the LE group were lighter at the age of 12 months than the rest of the animals, and those in the S group were the heaviest. However, at the age of 18 months, this difference in body weight no longer existed.
Finally, we may suggest that no increase in BP occurs, but the lipid profile of rats fed a diet supplemented with canola oil for a long time improves and the rats experience an elevation in the HDL-C levels as compared with rats fed the other types of diets.
Acknowledgements
We thank Prof José Firmino N. Neto (Chief of the Central Laboratory of Hospital Universitário Pedro Ernesto of UERJ) for his support with the biochemical analysis of the blood of the rats. This study was partially funded by CNPq and FAPERJ.
1. Schaefer EJ, Levy RI, Ernest ND, Van Sant F, Brewew HB Jr. The effects of low cholesterol high polyunsaturated fat, and low fat diets on plasma lipid and lipoprotein cholesterol levels in normal and hypercholesterolemic subjects. Am J Clin Nutr 1981; 34: 1758-63.
2. Hopkins PN. Effects of dietary cholesterol on serum cholesterol: a meta-analysis and review. Am J Clin Nutr 1992; 32: 1281-9.
3. Mensink RP, Katan MB. Effect of fatty acids on serum lipids and lipoproteins: a meta-analysis of 27 trials. Arterioscl Thromb 1992; 12: 911-9.
4. Kromhout D, Bosschteter EB, Coulander CL. The inverse relation between fish consumption and 20-year mortality from coronary heart disease. N Engl J Med 1985; 312: 1205-9.
5. Goodnight SH, Cairns JA. Therapeutic use of n-3 fatty acids for vascular disease and thrombosis. Chest 1995; 108: 302S-4S.
6. Stone NJ. Fish consumption, fish oil, lipids, and coronary heart disease. Circulation 1996; 94: 2337-40.
7. O’Keefe JH, Harris W. From Inuit to implementation: omega-3 fatty acids come of age. Mayo Clin Proc 2000; 75: 607-14.
8. McLennan PL, Dallimore JA. Dietary canola oil modifies myocardial fatty acids and inhibits cardiac arrhythmias in rats. J Nutr 1995; 125: 1003-9. 9. Salem N Jr, Wegher B, Mena P, Uauy RD. Arachidonic and docosahexaenoic
acids are biosynthesized from their 18-carbon precursors in human infants. Proc Natl Acad Sci USA 1996; 93: 49-54.
10. McLennan PL. Relative effects of dietary saturated, monounsaturated, and polyunsaturated fatty acids on cardiac arrhythmias in rats. Am J Clin Nutr 1993; 57: 207-12.
11. Connor WE. The impact of dietary omega-3 fatty acids on the synthesis and clearance of apo b and chylomicrons. Proceedings of the Scientific Conference on Omega-3 fatty acids in Nutrition, Vascular Biology, and Medicine, Houston, Texas, 1994: 19-32.
12. Berliner JA, Navab M, Fogelman AM, et al. Atherosclerosis: Basic mechanisms, oxidation, inflammation, and genetics. Circulation 1995; 91: 2488-96. 13. Stein Y, Stein O, Dabach Y, Hollander G, Ben-Naim M, Halperin G.
Anti-atherogenicity of high-density lipoprotein. Isr J Med Sci 1996; 32: 503-8. 14. Schaefer EJ, Lichtenstein AH, Lamon-Fava S, McNamara JR, Ordovas JM.
Lipoproteins, nutrition, aging, and atherosclerosis. Am J Clin Nutr 1995; 61(suppl): 726S-40S.
15. Assmann G, Schulte H, von Eckardstein A, Huang Y. High-density lipoprotein cholesterol as a predictor of coronary heart disease risk. The PROCAM experien-ce and pathophysiological implications for reverse cholesterol transport. Atherosclerosis 1996; 124: S11-S20.
16. Batra S, Rakusan K. Capillary length, tortuosity, and spacing in rat myocardium during cardiac cycle. Am J Physiol 1992; 32 (Heart Circulation Physiol 32): H1369-H76.
17. Cleutjens JPM, Kandala JC, Guarda E, Guntaka RV, Weber T. Regulation of collagen degradation in the rat myocardium after infarction. J Mol Cell Cardiol 1995; 27: 1281-92.
18. Katstura J, Cheng W, Sarangarajan R, et al. Necrotic and apoptotic cardiomyocy-te cell death in the aging heart of Fisher 344 rats. Am J Physiol 1996; 271 (Heart Circulation Physiol 40): H1215-H28.
19. Kalisnik M, Porenta OV, Mattfeldt T. Stereological and morphometric studies of mammalian myocardium: a review. Acta Stereol 1998; 17: 389-401.
3 8 3 8 3 8 3 8 3 8
20. Campbell SE, Gerdes AM, Smith TD. Comparison of regional differences in cardiac cardiomyocyte dimensions in rats, hamsters, and guinea pigs. Anat Rec 1986; 219: 53-9.
21. Gill III TJ, Smith GJ, Wissler RW, Kunz HW. The rat as an experimental animal. Science 1989; 21: 269-76.
22. Aguila MB, Apfel MIR, Mandarim-de-Lacerda CA. Stereology of the myocar-dium and blood biochemistry in aged rats fed with a cholesterol-rich and canola oil diet (n-3 fatty acid rich). Basic Res Cardiol 1998; 93: 182-91.
23. Aguila MB, Mandarim-de-Lacerda CA. Numerical density of cardiac cardiomy-ocytes in aged rats fed a cholesterol-rich diet and a canola oil diet (n-3 fatty acid rich). Virchows Arch 1999; 434: 451-453.
24. Aguila MB, Mandarim-de-Lacerda CA. Effect of different high-fat diets on the myocardium stereology and blood pressure in rats. Pathol Res Pract 2000; 196: 841-846.
25. Aguila MB, Mandarim-de-Lacerda CA. Blood pressure, ventricular volume and number of cardiomyocyte nuclei in rats fed for 12 months on diets differing in fat composition. Mech Ageing Dev 2001; 122: 77-88.
26. Scherle W. A simple method for volumetry of organs in quantitative stereology. Mikroskopie 1970; 26: 57-63.
27. Chen PR, Tsai CE. Various high monounsaturated edible oils might affect plasma lipids differently in man. Nut Res 1995; 15: 615-621.
28. Friedwald WT, Levy RI, Fredrickson DS. Estimation of the concentration of low-density lipoprotein cholesterol in plasma, without use of preparative ultracentrifuge. Clin Chem 1972; 8: 99-502.
29. Matthews DE, Farewell V. Using and understanding medical statistics. Basel: Karger, 1996; 246.
30. Zar JH. Biostatistical analysis. Upper Saddle River: Prentice Hall, 1999; 663.
31. Reeves PG, Nielsen FH, Fahey GC. AIN-93 purified diets for laboratory rodents: final report of the American Institute of Nutrition Ad Hoc Writing Committee on the Reformulation of the AIN-76A rodent diet. J Nutr 1993; 123: 1939-51. 32. Lacko AG, Davis JL. Age-related changes in rat and primate plasma cholesterol
metabolism. J Am Geriatr Soc 1979; 5: 212-7.
33. Tucker JT. Diseases of the Rat. Gunpower Square, London: Taylor & Francis, 1997: 1-22.
34. Baba NH, Antoniades K, Habbal Z. Effects of dietary canola, olive, and linolenic acid enriched olive oils on plasma lipids, lipid peroxidation and lipoprotein lipase activity in rats. Nutr Res 1999; 19: 601-12.
35. Kobatake Y, Hirahara F, Innami S, Nishide E. Dietary effect of n-3 type po-lyunsaturated fatty acids on serum and liver lipid levels in rats. J Nut Sci Vitaminol 1983; 29:11-21.
36. Becker N, Illingworth DR, Alaupovic P, Connor W, Sundberg E. Effects of saturated, monounsaturated and w-6 polyunsaturated fatty acids on plasma lipids, lipoproteins and apoproteins in humans. Am J Clin Nutr 1983; 37: 355-360. 37. Mattson FH, Grundy SM. Comparison of the effects of dietary saturated,
monounsaturated, and polyunsaturated fatty acids on plasma lipids and lipoproteins in man. J Lipid Res 1985; 26: 194-202.
38. Huang PC, Chang NW. Effects of dietary monounsaturated fatty acids on plasma lipids in humans (Abstract). 14th International Congress of Nutritional Sciences, 1989.
39. Iacono JM, Dougherty RM. Blood pressure and fat intake. In: Laragh J, Brener BM (Eds). Hypertension, Physiology, Diagnosis and Treatment. New York: Raven Press, 1990: 257-76.