ACPD
15, 1747–1868, 2015Effects of global change during the 21st century on the
nitrogen cycle
D. Fowler et al.
Title Page
Abstract Introduction
Conclusions References
Tables Figures
◭ ◮
◭ ◮
Back Close
Full Screen / Esc
Printer-friendly Version Interactive Discussion
Discussion
P
a
per
|
Discussion
P
a
per
|
Discussion
P
a
per
|
Discussion
P
a
per
|
Atmos. Chem. Phys. Discuss., 15, 1747–1868, 2015 www.atmos-chem-phys-discuss.net/15/1747/2015/ doi:10.5194/acpd-15-1747-2015
© Author(s) 2015. CC Attribution 3.0 License.
This discussion paper is/has been under review for the journal Atmospheric Chemistry and Physics (ACP). Please refer to the corresponding final paper in ACP if available.
E
ff
ects of global change during the 21st
century on the nitrogen cycle
D. Fowler1, C. E. Steadman1,2, D. Stevenson2, M. Coyle1, R. M. Rees3,
U. M. Skiba1, M. A. Sutton1, J. N. Cape1, A. J. Dore1, M. Vieno1,2, D. Simpson4, S. Zaehle5, B. D. Stocker6, M. Rinaldi7, M. C. Facchini7, C. R. Flechard8,
E. Nemitz1, M. Twigg1, J. W. Erisman9, and J. N. Galloway10
1
Centre for Ecology & Hydrology, Bush Estate, Penicuik, Midlothian, EH26 0QB, UK 2
School of GeoSciences, University of Edinburgh, Edinburgh, UK 3
Scotland’s Rural College (SRUC), West Mains Road, Edinburgh, EH9 3JG, UK 4
Norwegian Meteorological Institute, EMEP-MSC-W, P.O. Box 43, 0313 Blindern, Norway 5
Biogeochemical Integration Department, Max Planck Institute for Biogeochemistry, Hans-Knöll-Strausse 10, 07745 Jena, Germany
6
Imperial College, Department of Life Sciences, Silwood Park, Ascot, SL5 7PY, UK 7
ISAC-CNR, via P. Gobetti 101, 40129 Bologna, Italy 8
INRA, Agrocampus Ouest, UMR 1069 SAS, 35042 Rennes, France 9
Louis Bolk Institute, Hoofdstraat 24, 3972 LA, Driebergen, The Netherlands 10
ACPD
15, 1747–1868, 2015Effects of global change during the 21st century on the
nitrogen cycle
D. Fowler et al.
Title Page
Abstract Introduction
Conclusions References
Tables Figures
◭ ◮
◭ ◮
Back Close
Full Screen / Esc
Printer-friendly Version Interactive Discussion
Discussion
P
a
per
|
Discussion
P
a
per
|
Discussion
P
a
per
|
Discussion
P
a
per
|
Received: 25 November 2014 – Accepted: 26 November 2014 – Published: 20 January 2015
Correspondence to: D. Fowler ([email protected])
ACPD
15, 1747–1868, 2015Effects of global change during the 21st century on the
nitrogen cycle
D. Fowler et al.
Title Page
Abstract Introduction
Conclusions References
Tables Figures
◭ ◮
◭ ◮
Back Close
Full Screen / Esc
Printer-friendly Version Interactive Discussion
Discussion
P
a
per
|
Discussion
P
a
per
|
Discussion
P
a
per
|
Discussion
P
a
per
|
Abstract
The global nitrogen (N) cycle at the beginning of the 21st century has been shown to be strongly influenced by the inputs of reactive nitrogen (Nr) from human activities, estimated to be 193 Tg N yr−1in 2010 which is approximately equal to the sum of bio-logical N fixation in terrestrial and marine ecosystems. According to current trajectories,
5
changes in climate and land use during the 21st century will increase both biological and anthropogenic fixation, bringing the total to approximately 600 Tg N yr−1by around 2100. The fraction contributed directly by human activities is unlikely to increase sub-stantially if increases in nitrogen use efficiency in agriculture are achieved and control measures on combustion related emissions implemented.
10
Some N cycling processes emerge as particularly sensitive to climate change. One of the largest responses to climate in the processing of Nris the emission to the atmo-sphere of NH3, which is estimated to increase from 65 Tg N yr−
1
in 2008 to 93 Tg N yr−1 in 2100 assuming a change in surface temperature of 5◦C even in the absence of
in-creased anthropogenic activity. With changes in emissions in response to inin-creased
15
demand for animal products the combined effect would be to increase NH3 emissions to 132 Tg N yr−1. Another major change is the effect of changes in aerosol composition
combined with changes in temperature. Inorganic aerosols over the polluted regions especially in Europe and North America were dominated by (NH4)2SO4in the 1970s to 1980s, and large reductions in emissions of SO2have removed most of the SO24− from
20
the atmosphere in these regions. Inorganic aerosols from anthropogenic emissions are now dominated by NH4NO3, a volatile aerosol which contributes substantially to PM10 and human health effects globally as well as eutrophication and climate effects. The volatility of NH4NO3 and rapid dry deposition of the vapour phase dissociation prod-ucts, HNO3 and NH3, is estimated to be reducing the transport distances, deposition
25
footprints and inter-country exchange of Nrin these regions.
sub-ACPD
15, 1747–1868, 2015Effects of global change during the 21st century on the
nitrogen cycle
D. Fowler et al.
Title Page
Abstract Introduction
Conclusions References
Tables Figures
◭ ◮
◭ ◮
Back Close
Full Screen / Esc
Printer-friendly Version Interactive Discussion
Discussion
P
a
per
|
Discussion
P
a
per
|
Discussion
P
a
per
|
Discussion
P
a
per
|
stantial reductions of inputs of Nr to sensitive soils, waters and the atmosphere. How-ever, considering the magnitude of global Nr use, potential future increases, and the very large leakage of Nr in many forms to soils, waters and the atmosphere, there is a very long way to go before evidence for recovery from the effects of Nr deposition on sensitive ecosystems, or a decline in N2O emissions to the global atmosphere are
5
likely to be detected. Such changes would require substantial improvements in nitrogen use efficiency across the global economy combined with optimisation of transport and food consumption patterns. This would allow reductions in Nr use, inputs to the atmo-sphere and deposition to sensitive ecosystems. Such changes would offer substantial economic and environmental co-benefits which could help motivate the necessary
ac-10
tions.
1 Introduction
The global nitrogen (N) cycle has been perturbed extensively by human activity over the last 100 years with approximately two thirds of the annual flux of reactive nitrogen (Nr) entering the atmosphere at the beginning of the 21st century being anthropogenic in
15
origin (Galloway et al., 2004; Fowler et al., 2013). This has led to widespread negative consequences through directly contributing to radiative forcing of climate, reductions in biodiversity at regional scales in terrestrial ecosystems and in damage to human health through aerosols and ozone production (Erisman et al., 2013; Sutton et al., 2011). Human modification of the N cycle also has substantial benefits, through sustaining
20
the food supply to a global human population of seven billion and stimulating global CO2 sequestration by terrestrial and marine ecosystems (Zaehle, 2013; Sutton et al., 2013b).
The negative effects of human N fixation, are substantial and have been estimated to be 70–320 billion Euros annually for Europe (Sutton et al., 2011; Brink et al., 2011).
25
ACPD
15, 1747–1868, 2015Effects of global change during the 21st century on the
nitrogen cycle
D. Fowler et al.
Title Page
Abstract Introduction
Conclusions References
Tables Figures
◭ ◮
◭ ◮
Back Close
Full Screen / Esc
Printer-friendly Version Interactive Discussion
Discussion
P
a
per
|
Discussion
P
a
per
|
Discussion
P
a
per
|
Discussion
P
a
per
|
9 % of the total anthropogenic Nr fixed annually (193 Tg N yr− 1
). As the local hot spots of Nr use in North America and especially in East and South Asia, show values of emission and deposition similar to or larger than in Europe, it is likely that the global costs of human use of Nr are therefore an order of magnitude greater than those for Europe. This would be consistent with a preliminary estimate of global damage costs
5
associated with N pollution of 800 (200–2000) billion US dollars per year (Sutton et al., 2013b).
The damage by Nr to ecosystems, human health and climate result from leakage of N compounds from its use in agriculture, industry and transport (Erisman et al., 2013). A particular feature of the N cycle is the combination of the large number of
10
forms, both oxidised and reduced, in which Nr exists, with biological and chemical transformations allowing the same emitted molecule of Nr to take part in a series of effects, both negative and positive, before being transformed back to molecular nitrogen and returned to the atmospheric reservoir. This has been termed the nitrogen cascade (Galloway et al., 2003) and substantially complicates an assessment of the pathways
15
and effects of Nr in the environment.
Recent analyses of the global N cycle have focussed on the magnitude of current fluxes, effects of human activity on the processes and effects on human health, climate and ecosystems, especially in the European Nitrogen Assessment (ENA) and US as-sessments (Sutton et al., 2011, 2013b; Davidson et al., 2012; Fowler et al., 2013).
20
The extensive conversions of Nrin the environment mediated by biological and chemi-cal processes are sensitive to environmental conditions and thus are likely to respond to changes in climate over coming decades. Thus the current global N cycle is likely to change, regardless of future changes in human activities or human intervention to regulate losses to the environment.
25
ACPD
15, 1747–1868, 2015Effects of global change during the 21st century on the
nitrogen cycle
D. Fowler et al.
Title Page
Abstract Introduction
Conclusions References
Tables Figures
◭ ◮
◭ ◮
Back Close
Full Screen / Esc
Printer-friendly Version Interactive Discussion
Discussion
P
a
per
|
Discussion
P
a
per
|
Discussion
P
a
per
|
Discussion
P
a
per
|
The potential for consequences of changes in climate and land use on the global nitrogen cycle are considerable in both the range and magnitude of effects. The pro-cesses which regulate transfers between the atmosphere and terrestrial and marine reservoirs are generally sensitive to aspects of climate that are expected to change. Many of the major transfers are mediated by biological processes, especially microbial
5
transformations, which are very sensitive to changes in climate, especially in tempera-ture or humidity. The exchange fluxes of Nrcompounds at the Earth’s surface, including emission and deposition, are regulated by a combination of atmospheric transfer and surface reactions and biological regulation through stomatal exchange and soil microbi-ology. These processes therefore include physical, chemical and biological interactions
10
combining to regulate the overall process. Most of the components of the pathway are sensitive to climate, and while the response of some components to specific changes in the environment may be predicted, the overall process relies on measurements to constrain the potential range of effects (Fowler et al., 2009; Monks et al., 2009).
Some of the effects appear straightforward, such as increases in emission fluxes
15
of nitric oxide (NO) from soils and ammonia (NH3) from vegetation with temperature, but when the full range of expected changes in climate and the number and phase in which the Nr compounds reside are included, the responses become complex and harder to quantify. To consider the whole N cycle and interactions with climate and land use change requires a coupled global climate and global N cycle model, which to date
20
has not been achieved. While parts of the biogeochemistry have been incorporated in global climate models, especially those linked to ozone chemistry and emissions of oxidised N (Stevenson et al., 2006), many of the interactions of reduced nitrogen com-pounds have yet to be included (Sutton et al., 2013b). In the absence of the global mod-elling needed to quantify the interactions there have been a number of investigations
25
at regional scales. There have also been modelling studies of interactions between the carbon (C) and N cycles which provide useful insight to biogeochemical interactions.
ACPD
15, 1747–1868, 2015Effects of global change during the 21st century on the
nitrogen cycle
D. Fowler et al.
Title Page
Abstract Introduction
Conclusions References
Tables Figures
◭ ◮
◭ ◮
Back Close
Full Screen / Esc
Printer-friendly Version Interactive Discussion
Discussion
P
a
per
|
Discussion
P
a
per
|
Discussion
P
a
per
|
Discussion
P
a
per
|
available literature. Discussion of the likely consequences for the overall functioning of the global N cycle is provided to the extent that this is currently feasible. Consequences for human health, ecosystems and food production of these likely responses are briefly considered.
The structure of the review follows the pathway from fixation of atmospheric
nitro-5
gen, by both biological and industrial processes to emission of gaseous Nrcompounds through atmospheric processing and removal by dry and wet deposition. The review concludes with a discussion of the policy implications of climate-nitrogen cycle interac-tions.
2 Biological nitrogen fixation
10
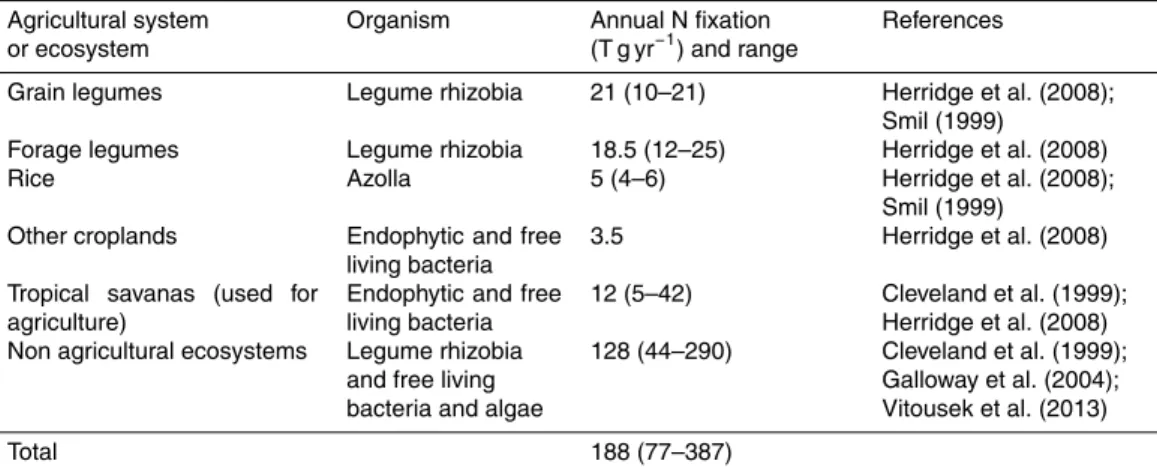
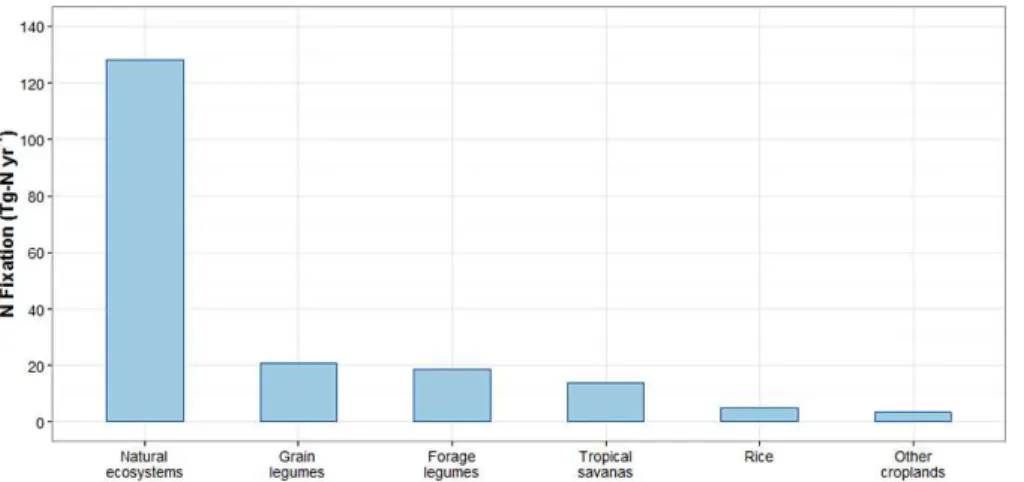
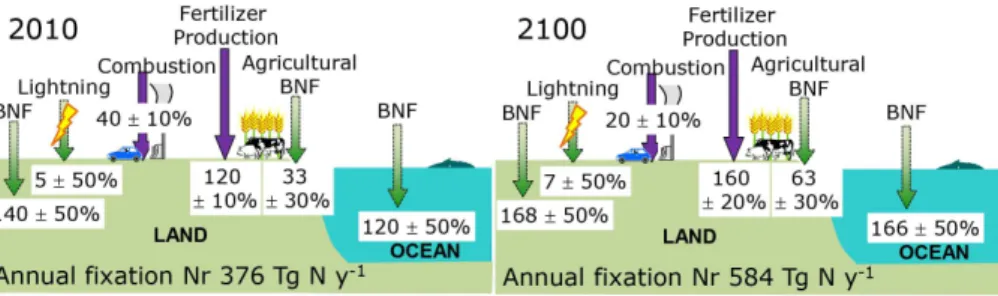
Biological nitrogen fixation (BNF) is currently estimated to provide a global annual input of approximately 300 Tg N yr−1to the biosphere making it the largest single global input of Nr, although there are significant uncertainties about the magnitude and spatial dis-tribution of fluxes (Fig. 1). If we assume that the global N cycle was in an approximate equilibrium prior to industrialisation, BNF would have been balanced by the reductive
15
processes of denitrification returning molecular nitrogen (N2) to the atmosphere, with estimates of around 260 Tg N yr−1 arising from terrestrial and oceanic sources
(Gal-loway et al., 2004). The process of fixation is undertaken by a very limited range of highly specialised microorganisms that share an ability to use the nitrogenase enzyme to split the triple bond present in atmospheric N2and combine it with hydrogen to
pro-20
duce a source of Nr. Although the process is highly energy demanding, it is performed at ambient temperature and pressure unlike the industrial Haber-Bosch process that requires the reactants to be combined in the presence of an iron catalyst at between 300–500◦C in a reaction vessel at 20 MPa. Two main groups of organisms are respon-sible; free-living bacteria and algae (which are widespread in fresh water, oceans and
25
ACPD
15, 1747–1868, 2015Effects of global change during the 21st century on the
nitrogen cycle
D. Fowler et al.
Title Page
Abstract Introduction
Conclusions References
Tables Figures
◭ ◮
◭ ◮
Back Close
Full Screen / Esc
Printer-friendly Version Interactive Discussion
Discussion
P
a
per
|
Discussion
P
a
per
|
Discussion
P
a
per
|
Discussion
P
a
per
|
and symbiotic bacteria (mostly belonging to the genusRhizobium) which form symbi-otic associations with the roots of plants (mostly belonging to the familyLeguminosae).
2.1 Terrestrial nitrogen fixation
In terrestrial environments, a wide diversity of both symbiotic and free-living N fixers contribute to BNF in non agricultural soils, but again a lack of measurements results
5
in large uncertainties in reported values. A meta-analysis of published data compiled from a large number of individual measurements of N fixation carried out in diverse ecosystems reported an average annual global flux of 195 Tg N with a range of 100– 290 (Cleveland et al., 1999), although this was later revised downwards to 128 Tg (Gal-loway et al., 2004). It is thought that tropical environments are particularly important
10
in contributing to terrestrial BNF, although these areas are associated with the least frequent measurements. Recent measurements of BNF by methanotrophs in pristine peatland by Vile et al. (2014) suggest appreciable inputs in these environments which have not been included in global estimates to date. Using an N balance approach in which the global N cycle is assumed to be in steady state, BNF can be estimated
15
as the difference between inputs and outputs of N within a global context. This ap-proach has suggested that preindustrial terrestrial BNF in natural ecosystems was only 44 Tg N yr−1
(Vitousek et al., 2013), however, such a low value questions whether cur-rent rates of natural BNF reported by Cleveland and others from up-scaling may be overestimated. The recent estimate of BNF in natural terrestrial ecosystems of 58 Tg N
20
annually by Vitousek et al. (2013) is substantially smaller than other recent synthe-ses of the literature, which are generally in excess of 100 Tg N annually but subject to large uncertainty. The most recent measurements of BNF in peatlands, which, al-though representing 3 % of the world’s land surface, contain approximately 25 % of the world’s soil carbon, suggest an additional source in these regions in the range of 4.8 to
25
ACPD
15, 1747–1868, 2015Effects of global change during the 21st century on the
nitrogen cycle
D. Fowler et al.
Title Page
Abstract Introduction
Conclusions References
Tables Figures
◭ ◮
◭ ◮
Back Close
Full Screen / Esc
Printer-friendly Version Interactive Discussion
Discussion
P
a
per
|
Discussion
P
a
per
|
Discussion
P
a
per
|
Discussion
P
a
per
|
and the values proposed by Galloway et al. (2004) of 128 Tg N yr−1 is used here for 2010.
Biological N fixation provides a significant input of fixed N to agricultural systems. Prior to the development of synthetic fertilizers at the beginning of the 20th century, most of the N used to produce crops and livestock would have been derived from
5
this source. The current input is estimated to be approximately 60 Tg N yr−1, taken as
the central value in the range 50–70 Tg yr−1 from Herridge et al. (2008). This value is divided mainly between the grain legumes (peas and beans) and forage legumes (such as clover and alfalfa) contributing 21 and 19 Tg yr−1respectively (Herridge et al.,
2008). Estimates of BNF by the grain legumes are generally considered to be more
10
reliable than those from forage crops since comprehensive records of the former are maintained by FAO (FAO 2012). Other minor inputs of N by BNF in agriculture include symbiotic N fixation from tropical savannas used for grazing (14 Tg) free living micro-organisms associated with rice paddies (5 Tg), and sugar cane (0.5 Tg).
The uncertainties associated with global estimates of BNF make predictions of
fu-15
ture changes particularly challenging. During the 20th century, there has been a rapid growth in the cultivation of leguminous crops contributing to an increase in associated BNF (Galloway et al., 2004). Future growth of legume crops will be constrained by the land area available to agriculture, and increases in production are most likely to occur when legumes are grown in place of other species. Emissions of nitrous oxide
20
(N2O) resulting from the growth of legume crops is generally low by comparison with other crops, and the IPCC guidelines on greenhouse gas reporting assumes that the N input resulting from legume production is not associated with any N2O emissions (IPCC, 2006). For this reason, increases in legume cultivation have been promoted as an opportunity to reduce N2O emissions from agricultural systems by reducing
emis-25
ACPD
15, 1747–1868, 2015Effects of global change during the 21st century on the
nitrogen cycle
D. Fowler et al.
Title Page
Abstract Introduction
Conclusions References
Tables Figures
◭ ◮
◭ ◮
Back Close
Full Screen / Esc
Printer-friendly Version Interactive Discussion
Discussion
P
a
per
|
Discussion
P
a
per
|
Discussion
P
a
per
|
Discussion
P
a
per
|
Biological N fixation associated with non-agricultural ecosystems is susceptible to changes in environmental conditions. A framework for understanding the environmen-tal controls determining the rates of BNF in the biosphere has been proposed in which there is a coupling between N, C and Phosphorus (P) cycling (Houlton et al., 2008; Vitousek et al., 2002). Free-living and symbiotic organisms with the potential to fix N
5
are at a selective advantage in environments with low P availability, however, the high energy costs of BNF require adequate supplies of available fixed C. Thus Net Primary Production (NPP) can be used as a proxy for changes in BNF, that can be useful for modelling purposes (Vitousek et al., 2002). The temperature sensitivity of the nitroge-nase enzyme responsible for the fixation process has been clearly demonstrated in a
10
global meta-analysis of fixation rates across dominant terrestrial biomes; the optimal temperature for fixation was found to be 25.2◦C with a very sharp decline in rates of fixation below 5◦C and above 40◦C (Houlton et al., 2008). Projected global increases in temperature are therefore likely to be associated with increases in BNF, providing that sufficient water is available to maintain NPP. However, other environmental changes
15
may counteract increases resulting from climate change. The process of BNF is often down regulated by the presence of fixed N. Agricultural experiments have consistently shown lower rates of fixation in the presence of high concentrations of soil mineral N and organic N inputs (Ledgard and Steele, 1992). The biological responses to tempera-ture are generally positive and Q10values are often in the range 1.5 to 3 in the range of
20
soil temperatures between 5◦C and 25◦C, outside which non-linearities are common. Taking a Q10 of 2 and temperature increases by 2100 of 4◦C, which appear probable (IPCC, 2013), the natural, terrestrial BNF in 2100 is likely to be 170 Tg N annually.
2.2 Marine biological nitrogen fixation in the 21st century
Marine N fixation is the biological conversion of dinitrogen gas (N2) into NH3, and is
per-25
ACPD
15, 1747–1868, 2015Effects of global change during the 21st century on the
nitrogen cycle
D. Fowler et al.
Title Page
Abstract Introduction
Conclusions References
Tables Figures
◭ ◮
◭ ◮
Back Close
Full Screen / Esc
Printer-friendly Version Interactive Discussion
Discussion
P
a
per
|
Discussion
P
a
per
|
Discussion
P
a
per
|
Discussion
P
a
per
|
blooms. Biological N fixation rates vary by species, and can be limited by temperature, light, oxygen, salinity, molybdenum, iron, and P. As a result, there is a great deal of variability in both the species composition of diazotrophs present in the various ocean basins, as well as the rate of N fixation, which changes regionally and seasonally.
Estimates have been made for global N fixation in the oceans, both by extrapolating
5
from biological measurements, and by modelling the biogeochemistry. However, there is a great deal of uncertainty, due to the difficulties in accounting for the large regional and seasonal differences. Recent reviews include Carpenter and Capone (2008), Moore et al. (2013) and Voss et al. (2013).
Future changes to the ocean including increasing carbon dioxide (CO2)
concen-10
trations, increasing stratification, and increasing temperatures, will likely result in an increase in marine nitrogen fixation. Nitrogen fixation leads to an increase in bioavail-able N present in the form of ammonium and dissolved organic N (Mulholland et al., 2006). An increase in N2fixation would therefore lead to an increase in the amount of Nr available to enable further processes in the N cycle.
15
The objective of this section is to characterise the current state of knowledge about marine BNF, as well as the major areas of uncertainty regarding BNF trends in the 21st century. The various factors limiting marine N fixation, the regional differences, and the predicted future impacts of changing conditions are discussed in more detail below.
2.2.1 Factors affecting marine nitrogen fixation
20
Light
Nitrogen fixers have strong preferences for specific light conditions. Depending upon the species, either light or darkness is required. Many non-heterocystous cyanobacte-ria fix nitrogen at night, however members of the genus Trichodesmium fix N only in the presence of light (Capone et al., 1997).Trichodesmiumare therefore present at the
25
decreas-ACPD
15, 1747–1868, 2015Effects of global change during the 21st century on the
nitrogen cycle
D. Fowler et al.
Title Page
Abstract Introduction
Conclusions References
Tables Figures
◭ ◮
◭ ◮
Back Close
Full Screen / Esc
Printer-friendly Version Interactive Discussion
Discussion
P
a
per
|
Discussion
P
a
per
|
Discussion
P
a
per
|
Discussion
P
a
per
|
ing solar irradiance due to the presence of more clouds, resulting in a decrease in N2 fixation.
Temperature
Enzyme activity generally increases with temperature, and this is true for nitrogen-fixing enzymes (nitrogenases). Staal et al. (2003) found that on short time scales, three
5
strains of cyanobacteria exhibited a Q10 ranging from 1.08 to 4.72. Trichodesmium exhibited a Q10 of 1.12 for N2 fixation in darkness from 20–35◦C, and a Q10 of 2.06 from 15–20◦C. In the presence of light,Trichodesmiumexhibited a Q
10of 1.64 for 15– 20◦C, and 1.84 for 20–35◦C. Fu et al. (2014) exposed strains ofTrichodesmium and Crocosphaerato varying temperatures in the laboratory and found maximum N fixation
10
to occur between 24–28◦C and 28–30◦C, respectively.
Increasing temperatures will likely cause the rate of N fixation to increase, both be-cause enzyme activity increases at higher temperatures, and bebe-cause the increase in sea surface temperatures will lead to an expansion of habitat suitable for diazotrophs (Hutchins et al., 2009). Boyd and Doney (2002) predict that habitat expansion will lead
15
to an increase in N fixation of 27 %.
Until recently, there was little evidence of marine diazotrophic activity in the cooler waters present at high latitudes (> 50 degrees) (Carpenter and Capone, 2008). A re-cent study found substantial N fixation in the surface of the Canadian Arctic (Blais et al., 2012). These recent discoveries suggest diazotrophs may be fixing N in areas
20
previously thought to be too cold for large levels of BNF.
Oxygen
Most nitrogen-fixing enzymes are inactivated by oxygen. Diazotrophs generally deal with this by performing N fixation either at night to avoid oxygen produced during pho-tosynthesis, or within thick walled cells called heterocysts which maintain a localised
25
ACPD
15, 1747–1868, 2015Effects of global change during the 21st century on the
nitrogen cycle
D. Fowler et al.
Title Page
Abstract Introduction
Conclusions References
Tables Figures
◭ ◮
◭ ◮
Back Close
Full Screen / Esc
Printer-friendly Version Interactive Discussion
Discussion
P
a
per
|
Discussion
P
a
per
|
Discussion
P
a
per
|
Discussion
P
a
per
|
Nitrogen fixation has generally not been considered in oxygen minimum zone (OMZ) systems (Carpenter and Capone, 2008). Due to the removal of Nr by denitrification and anaerobic ammonium oxidation, OMZs have low concentrations of Nr relative to P (Canfield, 2006), and the conditions in these sites may be suitable for N fixation. Modelling efforts have considered N2 fixation in OMZs (Canfield, 2006; Moore and
5
Doney, 2007).
Expanding OMZs may increase areas conducive to denitrification and anaerobic ammonium oxidation. If nitrogen-fixing bacteria exist in balance with denitrification (Deutsch et al., 2007), then the increase in denitrification may lead to a corresponding increase in N2fixation. Oxygen minimum zones may also lead to an increase in the
re-10
lease of trace metals (Noble et al., 2012) and P from sediments, which could stimulate increased N2fixation.
Salinity
Diazotrophs may be able to live in a variety of saline conditions. For example, a Tri-chodesmiumisolate was found to grow over a salinity range of 22–43 psu, but
maxi-15
mum growth and nitrogenase activity occurred over a narrow range of 33–37 psu (Fu and Bell, 2003). Changes in salinity are not expected to have a large effect on N fixa-tion.
Trace metals and phosphorus
Nitrogenase requires both iron and molybdenum. Nitrogen fixation is limited by iron in
20
approximately 35–75 % of the oceans, globally (Moore et al., 2002; Berman-Frank et al., 2001). Molybdenum is generally not growth limiting (Paerl et al., 1987; Paulsen et al., 1991) as it is readily present in seawater. However, sulphate may inhibit the uptake of molybdenum, because sulphate is also present, and is stereochemically similar to molybdate (Howarth and Cole, 1985; Marino et al., 2003).
ACPD
15, 1747–1868, 2015Effects of global change during the 21st century on the
nitrogen cycle
D. Fowler et al.
Title Page
Abstract Introduction
Conclusions References
Tables Figures
◭ ◮
◭ ◮
Back Close
Full Screen / Esc
Printer-friendly Version Interactive Discussion
Discussion
P
a
per
|
Discussion
P
a
per
|
Discussion
P
a
per
|
Discussion
P
a
per
|
Phosphorus is necessary for organisms, however surface waters today are thought to be more limited by N rather than P over much of the oceans (Moore et al., 2007). Approximately 4 % of the world oceans are limited by P (Moore et al., 2002).
Aeolian dust deposition leads to higher levels of iron reaching the subtropical North Atlantic Ocean. Under present day conditions, P may therefore be more limiting for
dia-5
zotrophs in the North Atlantic, and iron may be more limiting in the North Pacific Ocean (Prospero and Lamb, 2003). Climate change may affect the transport of aeolian dust. If drier areas become drier, or wind speed increases, the amount of dust transported from continents to the oceans may increase, which would increase nitrogen fixation in areas limited by iron. However, if the areas that receive the dust are limited by other
10
nutrients, then the increase in dust transport would have little effect.
Stratification
A strengthening of ocean stratification may lead to a decrease in nutrient upwelling, which would in turn lead to a shortage of N at the surface, which may cause an expan-sion of nitrogen-limited subtropical gyres (Sarmiento et al., 2004) and possibly
encour-15
age an increased rate of N fixation.
Carbon dioxide
Both model and laboratory studies ofTrichodesmiumisolates have shown an increase in N2fixation associated with increasing atmospheric CO2concentrations. Studies with Trichodesmiumcultures have reported a range of measurements for the increase in N2
20
fixation associated with increasing CO2 concentrations from present day levels (375– 380 ppm) to projected 2100 levels (∼750–1000 ppm). Studies have reported an
in-crease in rates of around 35–65 % (Hutchins et al., 2007; Barcelos e Ramos et al., 2007; Kranz et al., 2009), and as high as 100-121 % (Hutchins et al., 2007; Levitan et al., 2007). Barcelos e Ramos et al. (2007) predicted that N2 fixation rates for
Tri-25
ACPD
15, 1747–1868, 2015Effects of global change during the 21st century on the
nitrogen cycle
D. Fowler et al.
Title Page
Abstract Introduction
Conclusions References
Tables Figures
◭ ◮
◭ ◮
Back Close
Full Screen / Esc
Printer-friendly Version Interactive Discussion
Discussion
P
a
per
|
Discussion
P
a
per
|
Discussion
P
a
per
|
Discussion
P
a
per
|
by year 2100 with projected increases in CO2 concentrations under a business-as-usual emission scenario (scenario IS92a).
Hutchins et al. (2009) estimated that N2 fixation by Trichodesmium alone will rise from present day levels of 60 Tg N yr−1 (Mahaffey et al., 2005) to 80–100 Tg N yr−1by 2100, based on the response of a Trichodesmium isolate to increasing CO2 levels.
5
Hutchins et al. (2007) found that N2fixation rates forTrichodesmiumlevelled offat 1250 and 1500 ppm, suggesting that N2 fixation rates may stop increasing with increasing CO2levels by the year 2100.
Recent evidence indicates that unicellular cyanobacteria may fix at least as much N as Trichodesmium (Montoya et al., 2004). A laboratory study using the unicellular
10
cyanobacterium Crocosphaera watsonii found that elevating CO2 levels from 380 to 750 ppm increased N2fixation rates by 40 % (Fu et al., 2008), when not limited by iron. Based on measurements of the increase in N2 fixation rates associated with CO2 in-creases for seven strains ofTrichodesmiumand Crocosphaera, Hutchins et al. (2013) predict that over the next 100 years, N2fixation rates will increase by 4–23 % for these
15
seven strains. More evidence is needed to determine if other diazotrophs will be simi-larly affected by rising CO2concentrations.
Increasing CO2 concentrations will likely also lead to an increase in N fixation, al-though this increase may be offset by effects which decrease N2 fixation. Barcelos e Ramos et al. (2007) predicted that N2fixation rates would increase by 50 % by year
20
2100 with projected increases in CO2concentrations, providing a strong negative feed-back to increases in atmospheric CO2.
Anthropogenic N fertilization of the ocean leads to an increase in marine uptake of CO2, however this may lead to an increase in N2O emissions. Duce et al. (2008) applied Redfield stoichiometry to estimates of anthropogenic Nrdeposition of 54 Tg N yr−
1 and
25
anthropogenic CO2uptake by the ocean of∼2.2±0.5 Pg C yr− 1
ACPD
15, 1747–1868, 2015Effects of global change during the 21st century on the
nitrogen cycle
D. Fowler et al.
Title Page
Abstract Introduction
Conclusions References
Tables Figures
◭ ◮
◭ ◮
Back Close
Full Screen / Esc
Printer-friendly Version Interactive Discussion
Discussion
P
a
per
|
Discussion
P
a
per
|
Discussion
P
a
per
|
Discussion
P
a
per
|
increase in radiative forcing associated with an increase in the emissions of N2O (Duce et al, 2008). A decrease in pH due to ocean acidification from rising CO2 levels may lead to a decrease in the bioavailability of iron (Shi et al., 2010), which may in turn lead to a decrease in N2fixation for diazotrophs in areas where iron is limiting.
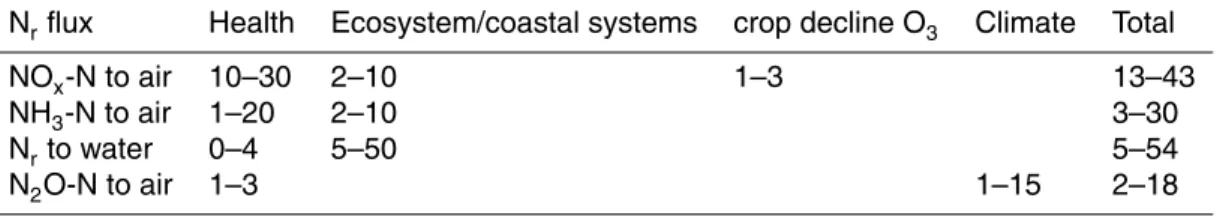
Table 2 provides a summary of the factors influencing marine N fixation, and the
5
expected effects on marine BNF in the 21st century.
2.2.2 Present-day and pre-industrial estimates
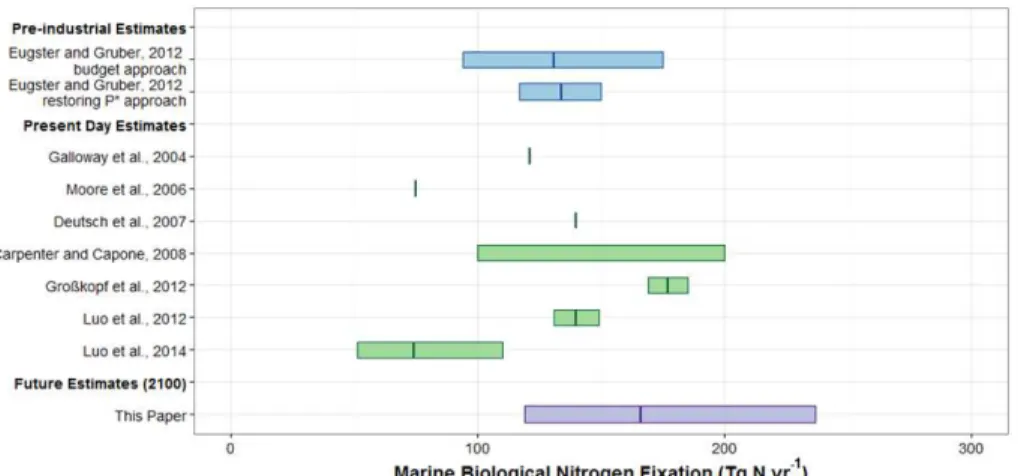
Estimates of global ocean N2fixation (shown in Fig. 2) range from 75 to 200 Tg N yr− 1
(Galloway et al., 2004; Carpenter and Capone, 2008; Moore et al., 2006; Deutsch et al., 2007; Eugster and Gruber, 2012; Luo et al., 2012), with recent estimates at around
10
130–140 Tg N yr−1 (Deutsch et al., 2007; Eugster and Gruber, 2012; Luo et al., 2012). Deutsch et al. (2007) estimated global ocean N fixation to be 140 Tg N yr−1, using
observed nutrient concentrations and an ocean circulation model. Eugster and Gru-ber (2012) used two methods to estimate the preindustrial global nitrogen fixation rate in the oceans to be 131 Tg N yr−1(94, 175) and 134 Tg N yr−1(117, 150), by combining 15
geochemical observations with a two-dimensional box model. Deutsch et al. (2007) and Eugster and Gruber (2012) found that the rates of N2fixation were higher in the Pacific Ocean than the Atlantic. Luo et al. (2012) compiled a global database of diazotroph abundances and N2 fixation rates, and estimated the global pelagic (open ocean) N2 fixation rate to be 140±9.2 Tg N yr−1(arithmetic mean±one standard error). One
pos-20
sible limitation of this data set is that 99 % of the data were collected within the range of 40◦S to 55◦N, and if substantial N2fixation is found to occur outside of this range, this estimate may be an underestimate. Luo et al. (2014) applied a multiple linear re-gression model to the same database of field observations and found an estimate of N2fixation of 74 (51–110) Tg N yr−
1
for the open ocean.
25
ACPD
15, 1747–1868, 2015Effects of global change during the 21st century on the
nitrogen cycle
D. Fowler et al.
Title Page
Abstract Introduction
Conclusions References
Tables Figures
◭ ◮
◭ ◮
Back Close
Full Screen / Esc
Printer-friendly Version Interactive Discussion
Discussion
P
a
per
|
Discussion
P
a
per
|
Discussion
P
a
per
|
Discussion
P
a
per
|
differences found between the 15N2 tracer bubble-addition and dissolution methods, Großkopf et al. (2012) estimate that the global marine N fixation rate measured using the new method would be 177±8 Tg N yr−1.
Although recent midpoint estimates appear to have coalesced at around 130– 140 Tg N yr−1, there is still a great deal of uncertainty due to the large variance in
5
measurements (5 to 8 orders of magnitude) (Luo et al., 2012), and recent measure-ments of nitrogen fixation rates in areas not previously thought to have high levels of diazotrophy.
2.2.3 Future impacts
Many factors will affect future rates of BNF. The most dramatic effects will likely be
10
due to temperature and increasing CO2concentrations. We estimate that marine BNF will increase from present day estimates of 140 (100–200) Tg N yr−1 to 166 (120– 240) Tg N yr−1 due to temperature effects alone. Present day BNF estimates were
scaled up using the Q10 of 1.64 for Trichodesmium (15–20◦C) found by Staal et al. (2003).
15
The implications of the various factors affecting BNF for the future are described in more detail below.
Diazotrophs have a competitive advantage over nondiazotrophs under conditions when there is a shortage of Nr relative to iron and P (Dutkiewicz et al., 2012). The projected increase in atmospheric deposition and river export of Nr to the ocean may
20
therefore lead to a decrease in N fixation.
In addition to the factors discussed above, estimates of N fixation may increase in the future even if the true rate remained constant. This is because the most common method for taking field measurements of marine N fixation has recently been found to underestimate the rate, so future estimates of N fixation may increase as the methods
25
ACPD
15, 1747–1868, 2015Effects of global change during the 21st century on the
nitrogen cycle
D. Fowler et al.
Title Page
Abstract Introduction
Conclusions References
Tables Figures
◭ ◮
◭ ◮
Back Close
Full Screen / Esc
Printer-friendly Version Interactive Discussion
Discussion
P
a
per
|
Discussion
P
a
per
|
Discussion
P
a
per
|
Discussion
P
a
per
|
that regions such as coastal, aphotic, and arctic regions may exhibit more N2fixation that previously thought.
Taken together, the factors discussed above suggest that N fixation may increase in the future, which will likely lead to an increase in ocean drawdown of CO2. Several feedbacks may offset this increase. Increasing rates of N2fixation may drive areas to P
5
and iron limitation, thereby limiting ultimate N2fixation rates. The many complex factors influencing N fixation make it difficult to draw strong conclusions about future rates of marine N fixation and its influence on the C cycle.
It appears likely that overall BNF will increase during this century in both managed and natural ecosystems. The total terrestrial natural N fixation by the end of this century
10
suggested from these arguments is 168 Tg N annually, approximately 17 % larger than the value at the beginning of the 20th century. Marine BNF is projected to increase from 120 to 166 Tg N yr−1by 2100, an increase of 38 % on 2010 values.
3 Anthropogenic fixation of nitrogen in the 21st century
The demand for fixed N through the 21st century will be driven by requirements for
15
food and industrial Nruse plus combustion related emissions and the extent of control measures to mitigate emissions and their effects. A range of authors have considered the available scenarios and possible development trajectories including most recently Winiwarter et al. (2013) and Bouwman et al. (2013). The scenarios and time scales used by these authors differ, with Bouwman et al. (2013) projecting trends only to
20
2050, rather than the end of the century. However, given the uncertainty in projections of this kind, they provide a useful guide for the likely trends. The projections from Wini-warter et al. (2013) are based on story lines and methodologies similar to those of the RCP (Representative Concentration Pathways) as used in the 2014 IPCC assess-ment of climate change through the 21st century. However, while based on the RCP
25
ACPD
15, 1747–1868, 2015Effects of global change during the 21st century on the
nitrogen cycle
D. Fowler et al.
Title Page
Abstract Introduction
Conclusions References
Tables Figures
◭ ◮
◭ ◮
Back Close
Full Screen / Esc
Printer-friendly Version Interactive Discussion
Discussion
P
a
per
|
Discussion
P
a
per
|
Discussion
P
a
per
|
Discussion
P
a
per
|
mineral fertilizer and industrial use of Nr, fixation is projected in the range 140 Tg N yr− 1
to 235 Tg N yr−1by 2100, depending on the RCP chosen and compares with their es-timate of 170 Tg N yr−1 in 2000. The year 2000 value is smaller than the estimate of
210 Tg N yr−1(Fowler at al., 2013), but within the uncertainties shown in each synthe-sis. The projections from Winiwarter et al. (2013) imply modest overall change in Nr
5
production by human activity through the 21st century as a consequence of gradual in-creases in efficiency compensating for increases in demand for fertilizer and industrial Nrapplications, combined with the considerable improvements expected for reductions in nitrogen oxide (NOx) emissions from combustion. Indeed there have been impor-tant reductions in emissions of combustion Nr, as NOx to the atmosphere throughout
10
Europe, North America and other highly developed economies. Typically these have reduced emissions by about 50 % over the last 30 years. Similar controls are likely for combustion emissions in the rapidly developing economies of Asia in the decades ahead. However, for reduced N, the global trend has been a monotonic increase in Nr fixation for most countries in the world outside Europe, and the social trends in rapidly
15
developing economies towards increased meat consumption seem likely to continue the trend. Given these historical trends and the unwillingness of governments through-out the world to regulate the supply of reduced Nr for agriculture and industry, the assumption that Nr production will remain constant through the 21st century seems implausible.
20
A substantial increase in nitrogen use efficiency (NUE) seems likely, as has been achieved in European agriculture over the last 30 years, but this is unlikely to prevent a continued increase in global agricultural nitrogen use. Given that human Nrproduction doubled between 1980 and 2010, a period in which global population increased by 2.5 billion, and medium estimates project a similar population increase by the later years
25
be-ACPD
15, 1747–1868, 2015Effects of global change during the 21st century on the
nitrogen cycle
D. Fowler et al.
Title Page
Abstract Introduction
Conclusions References
Tables Figures
◭ ◮
◭ ◮
Back Close
Full Screen / Esc
Printer-friendly Version Interactive Discussion
Discussion
P
a
per
|
Discussion
P
a
per
|
Discussion
P
a
per
|
Discussion
P
a
per
|
tween 2010 and 2100. This simplistic assumption would lead to 2100 Nr production of 273 Tg N yr−1
.
The global changes in fixation discussed above are summarised in Fig. 3, which show large increases in the total N fixed from 376 Tg N yr−1 in 2010 to 584 Tg N yr−1 in 2100 accompanied by substantial increases in the uncertainties of the component
5
fluxes.
The Nr fixed by BNF and human activity is then used by and transformed within ecosystems and products of the chemical and biological processing cascade through terrestrial and marine ecosystems and the atmosphere. It is important now to consider the effect of changes in the environment this century on the fate of the Nr.
10
4 Effects of environmental changes on the fate of Nr in terrestrial and marine
ecosystems
The total fixation of N through natural (BNF), combustion and Haber Bosch processes is projected to increase during the remainder of the 21st century, possibly to approxi-mately 600 Tg N, an increase of 50 % over values at the beginning of the century, but
15
subject to large uncertainties (Fig. 3). The subsequent fate of the Nrin terrestrial and marine ecosystems and the responses of the different pools of Nr to changes in cli-mate, and especially temperature and hydrology, are now considered for terrestrial and marine ecosystems.
The fixed N, whether by natural processes in soils and the oceans or by human
ac-20
tivities is predominantly in the reduced form as ammonia (NH3) or ammonium (NH + 4). Once formed, Nr is readily transformed in the environment and it is important to de-scribe the likely effects of changes in the environment on the fate of Nr, and quantify, where possible the probable impacts due to climate and land use changes this century. In short, which are the components of the N cycle that are most responsive to expected
25
ACPD
15, 1747–1868, 2015Effects of global change during the 21st century on the
nitrogen cycle
D. Fowler et al.
Title Page
Abstract Introduction
Conclusions References
Tables Figures
◭ ◮
◭ ◮
Back Close
Full Screen / Esc
Printer-friendly Version Interactive Discussion
Discussion
P
a
per
|
Discussion
P
a
per
|
Discussion
P
a
per
|
Discussion
P
a
per
|
4.1 Terrestrial ecosystems: emissions of NH3 from terrestrial ecosystems
through the 21st century
The global total emissions of NH3at the beginning of the 21st century have been esti-mated by Sutton et al. (2013b), at 59.3 Tg N yr−1
of which 33 Tg N yr−1
is from livestock and crops. The Nr fixed industrially through NH3 manufacture, mainly for fertilizers, is
5
currently 120 Tg N yr−1, thus the emissions to the atmosphere from livestock and crops represent roughly a quarter of the annual fertilizer production annually, effectively fer-tilizing the atmosphere. This substantial quantity is of course simply the unintentional leakage of the Nr from farming systems, due to the volatility of NH3. Also presented in this analysis of global emissions of NH3 are values for emissions from all other major
10
sources. Given the spatial and temporal variability in emission rates and the sensitiv-ity to climate, and especially temperature, the range of different emission estimates is small among the seven different estimates (35 to 65 Tg yr−1
) summarised, which re-flects the fact that these estimates are not fully independent. It is suggested by Sutton et al. (2013b) that overall uncertainty is around±30 %, pointing to an uncertainty range
15
for 2008 of 46 to 85 Tg N yr−1 .
The forces which have governed overall industrial production of fixed N have largely been economic, responding to the demand for food and the response functions be-tween crop productivity and fertilizer use (Jensen et al., 2011) in which the economic benefits of increased yields have driven global N fertilizer use demand. At the same
20
time, an increase in global meat consumption per capita (Erisman et al., 2008) will have magnified fertilizer requirements and NH3 emissions (Westhoek et al., 2014). This includes both the NH3 emissions from fertilizer in growing animal feeds and the ammonia emissions from livestock manures, in animal houses, manure storage, land application and from grazing animals, where the use of housed livestock substantially
25
increases emissions compared with pasture-only systems.
ACPD
15, 1747–1868, 2015Effects of global change during the 21st century on the
nitrogen cycle
D. Fowler et al.
Title Page
Abstract Introduction
Conclusions References
Tables Figures
◭ ◮
◭ ◮
Back Close
Full Screen / Esc
Printer-friendly Version Interactive Discussion
Discussion
P
a
per
|
Discussion
P
a
per
|
Discussion
P
a
per
|
Discussion
P
a
per
|
There are exceptions, in the case of the Netherlands and in Denmark, where poli-cies to reduce the leakage of Nr to the environment led to substantial reductions in atmospheric emissions (EMEP, 2014). Although first NUE estimates have now been provided for each country in the world (Sutton et al., 2013a), it is a matter for ongo-ing and future analysis to show how these have evolved over time and to demonstrate
5
the quantitative relationships between reduction between N emissions, including NH3, and improvement of NUE. In the global projections of Nruse through the 21st century provided by both Erisman et al. (2008, using the SRES approach) and Winiwarter et al. (2013, using the RCP approach), scenarios including the potential to improve crop NUE, while Sutton et al. (2013a), examined the N savings possible also as a result of
10
improving NUE across the full agri-food chain.
While subject to uncertainty, the global demand for food is likely to increase by 40 % by 2050 due to population growth and a changing diet (Godfray et al., 2010), espe-cially in the rapidly developing regions, unless additional actions are taken. The largest uncertainties in estimating future emissions of NH3 to the atmosphere are the
con-15
sumption drivers (food amount, food choice), the amounts of fertilizer and manure N applied and the effect of climate on the fraction emitted (van Vuuren et al., 2011a; and Sutton et al., 2013b, respectively). Excluding the climatic interaction (which is ad-dressed below), emissions resulting from demand for food and industrial uses, have been estimated by van Vuuren et al. (2011a) to increase from 60 Tg N yr−1 in 2000 to 20
between 70 and 80 Tg N yr−1by 2100.
4.1.1 Effects of changes in climate on terrestrial emissions of NH3
The processes of exchange of NH3 between terrestrial ecosystems and the atmo-sphere have been subject to detailed field studies and intercomparisons of methods (Sutton et al., 1995, 1998, 2009; Flechard et al., 1999, 2013) and are discussed
fur-25
ACPD
15, 1747–1868, 2015Effects of global change during the 21st century on the
nitrogen cycle
D. Fowler et al.
Title Page
Abstract Introduction
Conclusions References
Tables Figures
◭ ◮
◭ ◮
Back Close
Full Screen / Esc
Printer-friendly Version Interactive Discussion
Discussion
P
a
per
|
Discussion
P
a
per
|
Discussion
P
a
per
|
Discussion
P
a
per
|
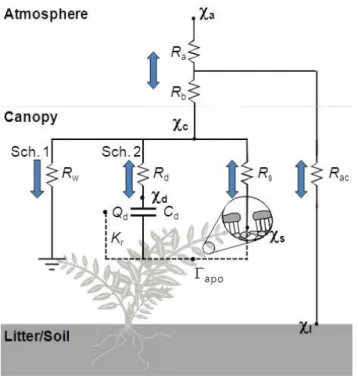
The surface atmosphere exchange of NH3is generally described numerically using a resistance analogy in which the vertical flux (Ft), is given by the potential difference between the surface (χ(z′
o) and a reference height in the atmosphere (χ(z) divided by the sum of resistances in the pathway from the source to the reference height and comprisingRa(z) andRb, the turbulent atmospheric and quasi-laminar boundary layer
5
resistances respectively.
Ft=
χ(z′
o)−χ(z)
/
Ra(z)+Rb
. (1)
In most ecosystems, the concentration at the surface, (χ(z′
o) is non-zero, due to pres-ence of NH+4 in the apoplast of vegetation. In these conditions the value of χ (z′
o) is proportional to a ratioχ=
NH+4
/
H+
of the canopy/ground surface, where
accord-10
ing to the thermodynamics:
χ=161 500/ Texp(−10 380/T)
NH+4
/
H+
. (2)
Temperatures (T) are in Kelvin and the scheme is represented schematically in Fig. 4. Quantifying detailed changes in NH3 emission this century requires knowledge of apoplast and leaf litter NH+4 and pH, scaled through the coming decades over global
15
vegetation. The data to calculate net exchange fluxes in this way are not available. However, Sutton et al. (2013b) argue that by examining model ecosystems and their exchange of NH3a surrogate for the likely change may be seen in empirical data. When it comes to global upscaling of NH3emissions, this also needs to bear in mind that the wide range of different terrestrial NH3 sources are likely to have differing temperature
20
responses, due to the role of different interacting factors.
To illustrate these effects, a model ecosystem was used for which both a global mod-elling framework and field measurements are uniquely available, namely NH3emission from seabird colonies. In addition to the availability of measurements and modelling, they are also globally important sources of NH3 and are distributed geographically
25
ACPD
15, 1747–1868, 2015Effects of global change during the 21st century on the
nitrogen cycle
D. Fowler et al.
Title Page
Abstract Introduction
Conclusions References
Tables Figures
◭ ◮
◭ ◮
Back Close
Full Screen / Esc
Printer-friendly Version Interactive Discussion
Discussion
P
a
per
|
Discussion
P
a
per
|
Discussion
P
a
per
|
Discussion
P
a
per
|
(Blackall et al., 2007; Riddick et al., 2012; Sutton et al., 2013b). This approach demon-strated a strong climate dependence in the ammonia emissions, with the modelling approach (incorporating Eq. 2), agreeing closely with the measured datasets.
Combining all sources of NH3emission globally, studies provided the data to model likely responses of terrestrial NH3emissions to a 5 degree increase in global
tempera-5
ture and showed that emissions in 2008 of 65 Tg-NH3-N (45–85), increased to 93 (64– 125) Tg-NH3-N in 2100 (Sutton et al., 2013b), based on anthropogenic activity levels for 2008. This may be compared with an estimated increase in NH3emissions based on increased anthropogenic activities (excluding the climatic response), and of no-change for natural sources, of 42 % (33–52 %) increase by 2100. Combining the increases in
10
anthropogenic activity expected up to 2100 according to the RCP8.5 (Lamarque et al., 2011), with the estimated effect of climate warming on emissions, gives an overall es-timate of NH3 emissions for 2100 of 132 (89–179) Tg N yr−
1
. As Sutton et al. (2013b, supplementary material) point out, this value is nearly a factor of three higher than that included in the currently mapped EDGAR database, which is a consequence of
includ-15
ing: a) additional sources (including oceans, see further below), b) the effect of the climate change feedback and c) the anticipated increase in anthropogenic activities.
4.2 Ammonia exchange over the oceans in the 21st century
In marine ecosystems NH3/NH +
4 is produced by phytoplankton and other organisms. Although the aqueous-phase partitioning between NH3 and its protonated form NH
+ 4
20
is dominated by NH+4, the majority of emissions are in the form of NH3. Ammonium is quickly assimilated by phytoplankton, so NH3 and NH
+
ACPD
15, 1747–1868, 2015Effects of global change during the 21st century on the
nitrogen cycle
D. Fowler et al.
Title Page
Abstract Introduction
Conclusions References
Tables Figures
◭ ◮
◭ ◮
Back Close
Full Screen / Esc
Printer-friendly Version Interactive Discussion
Discussion
P
a
per
|
Discussion
P
a
per
|
Discussion
P
a
per
|
Discussion
P
a
per
|
4.2.1 Factors affecting the flux of ammonia between the atmosphere and the ocean
The exchange of ammonia between the ocean and the atmosphere depends on several factors: the concentrations of ammonia in the surface layer of the ocean and in the boundary layer of the atmosphere, temperature, and wind speed (Johnson et al., 2008).
5
The flux across the atmosphere-ocean interface can be described by (Liss and Slater, 1974):
F =kg
(NH3(g))−KH
NH(sw) , (3)
where F is the flux from the atmosphere to the ocean (mol m−2s−1), kg is the gas-phase transfer velocity (m s−1), the NH
3concentrations are given in mol m− 3
, andKH
10
is the dimensionless Henry’s Law coefficient for ammonia.
The Henry’s law constant for ammonia can be calculated as follows (McKee, 2001):
KH=(17.93(T /273.15)e(4092/ T)−9.70)−1, (4)
whereT is temperature in Kelvin.
The concentration of NH3 present in seawater depends on the partitioning between
15
NH3and NH+4, which is affected by pH, salinity, and temperature. This dissociation can be described by the logarithmic acid dissociation constant, pKa (Bell et al., 2007):
pKa=10.0423−(0.0315536T)+(0.003071S), (5)
whereT is the temperature in◦C, and S is salinity in g kg−1. Chemical reactions and
transport of NH3into the atmosphere (from terrestrial emissions) and the ocean (from
20
biological activity, deposition and river export) also affect the levels of NH3present.
4.2.2 Flux estimates
ACPD
15, 1747–1868, 2015Effects of global change during the 21st century on the
nitrogen cycle
D. Fowler et al.
Title Page
Abstract Introduction
Conclusions References
Tables Figures
◭ ◮
◭ ◮
Back Close
Full Screen / Esc
Printer-friendly Version Interactive Discussion
Discussion
P
a
per
|
Discussion
P
a
per
|
Discussion
P
a
per
|
Discussion
P
a
per
|
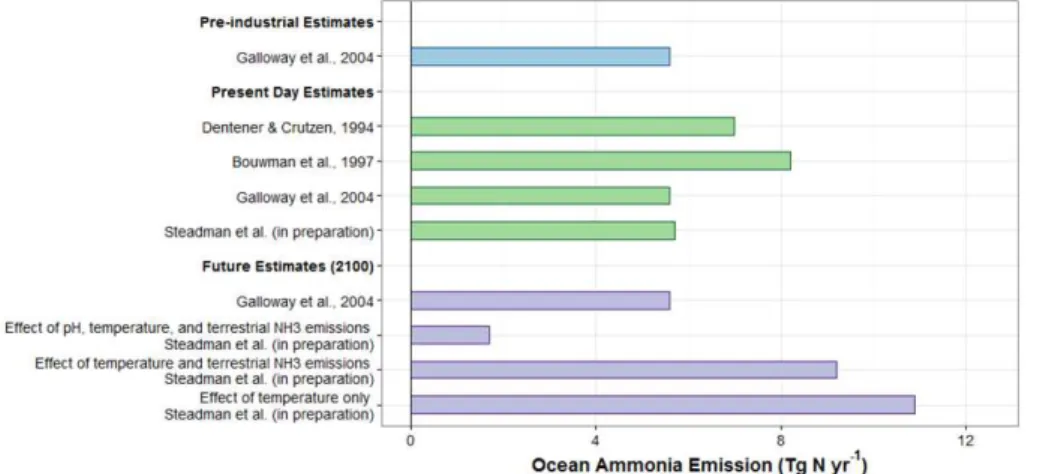
NH3to be dissolved. In contrast, the oceans are believed to be a source of NH3 emis-sions at lower latitudes, where the oceans are warmer, promoting a greater partition-ing to the gas phase (Eq. 4) and Johnson et al., 2008). When considerpartition-ing the global oceans together, the net flux is believed to be a small emission from the oceans to the atmosphere (Bouwman et al., 1997; Dentener and Crutzen, 1994; Galloway et al.,
5
2004).
Ocean-atmosphere NH3fluxes vary across regions and seasons, and observations are limited, making it difficult to extrapolate regionally and temporally. As a result, there are only a few quantitative estimates of global flux, all of which are highly uncertain. Dentener and Crutzen (1994) estimated the flux to be 7.0 Tg N yr−1 from the oceans
10
to the atmosphere. They did this by taking a distribution of dimethylsulphide (DMS) emissions modelled by Bates et al. (1987), and assuming equal molar emissions of NH3and DMS. Although both DMS and NH3are produced by phytoplankton, assuming an equal molar relationship is acknowledged by Dentener and Crutzen (1994) to be rather speculative. The relationship between NH3 and DMS may have been tightly
15
coupled under pre-industrial conditions, but this is unlikely to be true under the present strong anthropogenic influences on the N cycle (Johnson and Bell, 2008).
An independent estimate of global ocean NH3emissions was provided by Bouwman et al., (1997) who applied an ocean carbon cycle model to calculate an NH3 flux of 8.2 Tg N yr−1 for 1990. However, this did not account for non-zero atmospheric NH3
20
concentrations, and Bouwman et al. (1997) acknowledged that doing so might reduce the net sea-atmosphere emission flux by a factor of two. For comparison, Galloway et al. (2004) estimated preindustrial, present, and future marine NH3 emissions using a compensation point approach to be 5.6 Tg N yr−1. However, it is unlikely that the flux would remain constant over these time periods, given the human perturbations to the
25
N cycle.
atmo-ACPD
15, 1747–1868, 2015Effects of global change during the 21st century on the
nitrogen cycle
D. Fowler et al.
Title Page
Abstract Introduction
Conclusions References
Tables Figures
◭ ◮
◭ ◮
Back Close
Full Screen / Esc
Printer-friendly Version Interactive Discussion
Discussion
P
a
per
|
Discussion
P
a
per
|
Discussion
P
a
per
|
Discussion
P
a
per
|
spheric concentrations of NH3and temperature. The flux is calculated by dividing the ocean surface into 5 degree grid squares, and determining the gas transfer velocity and the Henry’s law constant for NH3 within each grid square, using temperature, pH, and wind speed. The resulting estimated NH3flux for 2005 is 5.7 Tg N yr−1 from the ocean
to the atmosphere. Atmospheric concentrations of NH3were obtained from STOCHEM
5
(Lamarque et al., 2013; Derwent et al., 2003) model output. Surface ocean NH3 and NH+4 concentrations were obtained from the British Oceanographic Data Centre.
These recent analyses suggest that the global NH3 emission estimate of 8.2 Tg N yr−1 of Bouwman et al. (1997), which was incorporated into the global emis-sions estimates of Sutton et al. (2013b), summarised above, may be overestimated. If
10
so, the estimates of Sutton et al. (2013b) should be reduced by around 2.5 Tg N yr−1 for 2008, giving total emissions of around 63 (44–82) Tg N yr−1, again based on±30 %
uncertainty.
4.2.3 Future impacts
The future ocean-atmosphere flux of NH3 will be affected by increasing temperatures,
15
increasing terrestrial NH3 emissions, and ocean acidification from elevated CO2 lev-els which lowers the pH of the water. The mechanism of both of these effects is an alteration of the partitioning of ammonia and ammonium in the ocean, as illustrated by Eq. (5). The lower pH results in a greater relative concentration of ammonium. The lower concentration of NH3 will therefore result in lower emissions. Climate change
20
and ocean acidification will also have indirect effects on ocean ecosystems, leading to changes in plankton populations and species composition.
The decreased marine emissions of NH3 in the future, combined with increasing N deposition and export from rivers, suggest that the future oceans may accumulate more reactive N, leading to eutrophication and OMZs. Some of the additional Nr may result
25
ACPD
15, 1747–1868, 2015Effects of global change during the 21st century on the
nitrogen cycle
D. Fowler et al.
Title Page
Abstract Introduction
Conclusions References
Tables Figures
◭ ◮
◭ ◮
Back Close
Full Screen / Esc
Printer-friendly Version Interactive Discussion
Discussion
P
a
per
|
Discussion
P
a
per
|
Discussion
P
a
per
|
Discussion
P
a
per
|
The expected temperature and pH changes in the ocean associated with climate change and ocean acidification will likely have a large effect on the ammonia flux. Based on the estimates of Bouwman et al. (1997), Eq. (2) and a 5◦C warming scenario, Sutton et al. (2013b, Supplement) estimated that ocean NH3emissions would increase to 15 Tg N yr−1. However, as noted above, the baseline may have been an overestimate, 5
while the interaction with rising CO2levels was not included.
Preliminary model results suggest that after accounting for the increasing tempera-tures and terrestrial emissions associated with RCP8.5, and the expected ocean acid-ification (a decrease in mean surface ocean pH of 0.31, from 8.14 in 2000 to 7.83 in 2100 (IPCC, 2013)), the estimated future NH3flux for 2100 is 1.7 Tg N yr−
1
. However,
10
the flux depends greatly on temperature, ocean acidification, and terrestrial NH3 emis-sion estimates. If temperature increases and increasing terrestrial ammonia emisemis-sions are accounted for, but ocean acidification neglected (the effect of pH is excluded), the estimated emission for 2100 would be 9.2 Tg N yr−1. If atmospheric NH3concentrations and ocean pH were to remain at 2000 levels, but temperatures increase as expected
15
under RCP8.5, the estimated 2100 ammonia emission is 10.9 Tg N yr−1. Comparison of the bars in Fig. 5 shows that in relative terms the effect of ocean acidification is the largest driver, providing more than a factor of three difference in the flux calculated by Eq. (3).
These varying estimates demonstrate the high level of uncertainty in the magnitude
20
of future atmosphere-ocean fluxes, and show that climate change and terrestrial NH3 emissions may lead to dramatic changes in global NH3processes. These estimates do not account for changes in oceanic NH3concentrations, which will likely increase due to increased biological activity, export of nutrients from rivers, and atmospheric depo-sition. These changes may be especially dramatic in coastal areas, which are strongly
25