Direct Measurements of Oxygen Gradients in
Spheroid Culture System Using Electron
Parametric Resonance Oximetry
Laura M. Langan1, Nicholas J. F. Dodd1, Stewart F. Owen3, Wendy M. Purcell1, Simon K. Jackson2‡, Awadhesh N. Jha1‡*
1School of Biological Sciences, Plymouth University, Plymouth, PL4 8AA, United Kingdom,2School of Biomedical & Healthcare Science, Plymouth University, Plymouth, PL4 8AA, United Kingdom, 3AstraZeneca, Alderley Park, Macclesfield, Cheshire, SK10 4TF, United Kingdom
‡These authors are equal senior authors on this work. *A.Jha@plymouth.ac.uk
Abstract
Advancedin vitroculture from tissues of different origin includes three-dimensional (3D)
organoid micro structures that may mimic conditionsin vivo. One example of simple 3D
cul-ture is spheroids; ball shaped struccul-tures typically used as liver and tumour models. Oxygen is critically important in physiological processes, but is difficult to quantify in 3D culture: and the question arises, how small does a spheroid have to be to have minimal micro-envi-ronment formation? This question is of particular importance in the growing field of 3D based models for toxicological assessment. Here, we describe a simple non-invasive approach modified for the quantitative measurement and subsequent evaluation of oxygen gradients in spheroids developed from a non-malignant fish cell line (i.e. RTG-2 cells) using Electron Paramagnetic Resonance (EPR) oximetry. Sonication of the paramagnetic probe Lithium phthalocyanine (LiPc) allows for incorporation of probe particulates into spheroid during its formation. Spectra signal strength after incorporation of probe into spheroid indicated that a volume of 20μl of probe (stock solution: 0.10 mg/mL) is sufficient to provide a strong spectra across a range of spheroid sizes. The addition of non-toxic probes (that do not produce or consume oxygen) report on oxygen diffusion throughout the spheroid as a function of size. We provide evidence supporting the use of this model over a range of initial cell seeding densities and spheroid sizes with the production of oxygen dis-tribution as a function of these parameters. In our spheroid model, lower cell seeding densi-ties (*2,500 cells/spheroid) and absolute size (118±32μm) allow control of factors such
as pre-existing stresses (e.g.*2% normoxic/hypoxic interface) for more accurate
mea-surement of treatment response. The applied methodology provides an elegant, widely applicable approach to directly characterize spheroid (and other organoid) cultures in bio-medical and toxicological research.
OPEN ACCESS
Citation:Langan LM, Dodd NJF, Owen SF, Purcell WM, Jackson SK, Jha AN (2016) Direct Measurements of Oxygen Gradients in Spheroid Culture System Using Electron Parametric Resonance Oximetry. PLoS ONE 11(2): e0149492. doi:10.1371/journal.pone.0149492
Editor:Dariush Hinderberger, Martin-Luther-Universität Halle-Wittenberg, GERMANY
Received:August 21, 2015
Accepted:February 1, 2016
Published:February 22, 2016
Copyright:© 2016 Langan et al. This is an open access article distributed under the terms of the
Creative Commons Attribution License, which permits unrestricted use, distribution, and reproduction in any medium, provided the original author and source are credited.
Data Availability Statement:All data included in the manuscript.
Introduction
Over the past three decades, the use of three dimensional cell culture (e.g. spheroids) has gained increased recognition as an important tool in biological research and in preclinical trials [1–3] over conventional organs orex vivocultures which are unsurprisingly in short supply. Spher-oids are possibly the simplest 3D tissue model in research with arguably the best physiological representation of the native tissue in comparison to other commonly used models such as cells grown as monolayers, tissue slices orex vivoorgans. Typically round or elliptic, the spheroids are globe like compact structures which can be manipulated without causing mechanical disso-ciation of the cells [1]. They are formed through the adherence of cells to one another in prefer-ence to a substrate [3–5]. There is an enormous body of literature on spheroid models and their use in cancer therapy orientated studies (3D tumour models) to bridge the gap between cell based assays andin vivostudies [6–8]. These systems can be used to model many character-istics of avascular tumours and micrometastases of large solid tumours, in addition to better replicating the barrier to drug penetration represented by native tumour tissue [9]. Previous research has also demonstrated the suitability of the spheroid system as anin vitroalternative to the assessment of chemical toxicity and evaluation of environmental samples in biological and ecotoxicological studies [1,2,10–12]. However, in order to use such a 3D system in non tumour models, we need to understand more about the mass transport limitations of the non-tumour model, especially in respect of oxygen transport.
To our knowledge, there has been no attempt to directly measure oxygen consumption or quantify oxygen micro-environment formation non destructively in spheroid based models (both tumour based and non tumour derived) until the present study. However, it should be noted that although these questions have not been directly addressed in the literature, EPR has previously been used as a measure of cytotoxic response to a toxic drug [13]. Micro-environ-ment formation in spheroids involves the metabolic adaptation of cells in response to this new environmental structure (e.g. from monolayer to suspension culture) and can cover changes in lactate accumulation, glucose distribution, cellular proliferation and the response of cells to external stresses such as diffusive gradients (e.g. oxygen) [14]. The availability of oxygen in tumour spheroid systems is critical for metabolism, in addition to controlling the responsive-ness to experimental drug treatments [5,14,15]. The formation of micro-environments within spheroids growing underin vitroconditions is determined by the balance between oxygen dif-fusion from the growth medium and its consumption within the spheroid. While this relation-ship has been well established in tumour biology [16–18], there appears to be no studies addressing this directly in non-tumour models.
Previously, the formation of oxygen micro-environments in tumour spheroid models has been estimated using a two-pronged approach. One method defines the micro-environment boundary in the spheroid model (for example, oxygen-sensitive probes such as the Whalen type electrode or Clark electrode [18–20]). Following this the data is fed into a pre-established differential equation of diffusion under consideration of the previously defined micro-environ-ment boundary [21]. Alternatively, mathematical modelling of spheroid micro-environments is feasible with some basic information of the spheroid obtained destructively through histo-chemical staining of spheroid sections [22]. It should be noted that there is little consensus in the literature on the most appropriate method to use due to recently documented difficulties/ limitations of these methods [23].
The use of spin-label oximetry (with paramagnetic probes) to biological systems dates back over 40 years [24,25]. Electron Paramagnetic Resonance (EPR alternatively known as ESR) oximetry has wide applications in biomedical research [26] and oximetry represents a small subset of this broad field. EPR oximetry is a relatively simple, non-invasive method to measure No.4059) awarded to ANJ. The specific roles of these
authors are articulated in the "Authors Contributions" section.
oxygen levels in biological systems using implanted and soluble paramagnetic probes, the use of which has been gradually increasing [27–30]. The method is based on the Heisenberg spin exchange between paramagnetic molecules of probe and oxygen causing a change in linewidth of the EPR spectrum of the probe [27,31,32]. One of the most important characteristics of this approach is that it does not interfere with oxygen metabolism within the biological system, therefore providing a basis for non-invasive oxygen measurements in biological systems [33], a critical requirement for measurement of oxygen within 3D models [29].
In the present study, we move from concept to application (Fig 1) by first establishing that spheroids could form around paramagnetic probe particulates (S1 Fig). Following this estab-lishment, we then used EPR oximetry to identify variations in oxygen concentration levels as a function of spheroid size and at different time points. Finally, micro-environments within the model system at various times and spheroid sizes were formed (as above). The results obtained were extended further through the application of mathematical formulae to identify zones of senescence/necrosis [22]. The results provide the evidence required to show maximum spher-oid size to be used in areas of research requiring the absence/minimal necrosis in the spherspher-oid system.
Fig 1. Moving from experimental concept to application.Overall experimental design to investigate the feasibility of moving from theoretical concept to application of EPR oximetry to the spheroid model. The incorporation of paramagnetic probes into the model will allow for the non-invasive determination of oxygen content/micro-environment.
Methods
Reagents
All chemicals and reagents were purchased from Life Technologies (UK) and Sigma Aldrich (UK). The paramagnetic probe Lithium phthalocyanine (LiPc) was a kind gift from Dr. Philip James, Cardiff University School of Medicine, UK. Paramagnetic probes are also available com-mercially (for example Alfa Aesar, a Johnson Matthey Company, Massachusetts, USA).
Preparation of paramagnetic probes
Initially, LiPc was ground using a marble morter and pestle in Dulbecco’s phosphate buffered saline (DPBS) to make up a 1mg/mL stock solution. From this a 0.1mg/mL solution was chosen as the optimum probe strength to use in combination with the spheroids after optimisation of spectra signal strength and intensity via EPR. In order to reduce the size of the probes to allow for incorporation into the spheroids, the chosen paramagnetic probe was sonicated in uncondi-tioned DPBS at 4°C in an Elmasonic S15 ultrasonic washer (37 kHz; ELMA Hans Schmidbauer, Germany). As previously reported, paramagnetic probes become smaller with longer sonica-tion durasonica-tion [34]. After exploring various optimisation regimes (no sonication versus varying sonication times of 1–5 h), a final sonication time of 5 h was determined to yield sufficiently small probe particulates measured as per size measurements section below (11.20 ± 1.02μm). Particulates of this size were easily incorporated during the formation of the spheroid.
Monolayer culture
Unlike mammalian tumour cell lines which have been well studied in our group [35,36], with well defined micro-environments (see [10]), little information exists on spheroids derived from non-tumour sources in terms of spheroid heterogeneity. The rainbow trout (Oncorhynchus mykiss) gonad cell line RTG-2 [37] was established fromOncorhynchus mykissgonads and is being widely used in the field ofin vitrotoxicology due to its reproducible results in inter-labo-ratory validations of cytotoxicity, capacity for metabolism of xenobiotics and well characterised protein synthesis and oxygen consumption [38–40]. This fibroblastic cell line was obtained from the ECACC (European Collection of Cell Cultures, Public Health England; ATCC CCL 55) and is routinely used in our laboratory under standard culture conditions [41,42]. Briefly, the cells were cultured in 75cm cell culture flasks (Greiner, UK) in Minimal essential medium (MEM) supplemented with Non-essential Amino Acids (NEAA), 2mM L-glutamine, 10% fetal bovine serum (FBS), gentimicin (10μg/mL) and 5% CO2in a 19°C incubator. Cell proliferation was maintained by weekly sub-cultivation (split 1:3) or seeding at 5×10⁴cells/mL [41,42].
Validation of spheroid formation with paramagnetic probe
96 well tissue culture microtiter plate in order to maximise spheroid development and recovery [43]. Cellular aggregates were visible after 24h, but did not form spheroids until day 7, as indi-cated by a plateau in spheroid volume (see section on Size Measurements). Following verifica-tion of spheroid formaverifica-tion with sonicated LiPc (S1 Fig), the RTG-2 cells were seeded at a range of densities in order to validate the appropriateness of the methodology for a range of spheroid sizes. Oxygen concentration is presented as a percentage of fully oxygenated probes and makes the following assumptions: (a) the spheroid is spheroidal in structure allowing even uptake of oxygen over the whole model, and (b) oxygen is calculated as a percentage of all probe particu-lates within the model (linewidth) irrespective of probe location (heterogeneous distribution due to particulate size).
Size measurements. The RTG-2 single cell size ranges from 11 ±3μm after trypsin treat-ment, however it is known that cell size is dependent on stage of growth differentiation and attachment to substrate (for example, [44]). In order to measure variation in size of spheroids, diameters of a selection of spheroids at different seeding densities (5 seeding densities: 2,500-80,000 cells/spheroid as perTable 1) were recorded. Biological replicates were defined as non-parallel passages, with each size measurement of all seeding densities recorded over 3 passages. Each measurement consisted of 8 technical replicates per seeding density and passage. Diame-ters/radius were calculated from digital images acquired using a microscope mounted digital camera attached to an inverted light microscope (OptixCam, The Microscope Store, USA). Digital images were analysed using OCView7.
EPR Oximetry
All spectra were recorded on a Bruker emx micro EPR spectrometer fitted with variable tem-perature accessory, operating at 9.4GHz. The sub-lite-wall PTFE (polytetrafluorethylene) tub-ing (o.d = 0.97mm and i.d = 0.8mm)(Zeuss, Orangeburg, Sc, USA) used durtub-ing the study of EPR linewidth was placed into quartz EPR tubes open at both ends, and the samples main-tained at 292°K (19°C) by a flow of air. The linewidths of the spectra from aqueous suspensions of LiPc in PBS were measured at various temperatures between 292°K and 316°K and the known oxygen solubility at the specific temperatures being used to form a calibration curve. Spectra were also recorded in water, under an atmosphere of nitrogen to obtain the zero oxygen point. Field modulation amplitude (ma) was carefully adjusted depending on EPR linewidth to
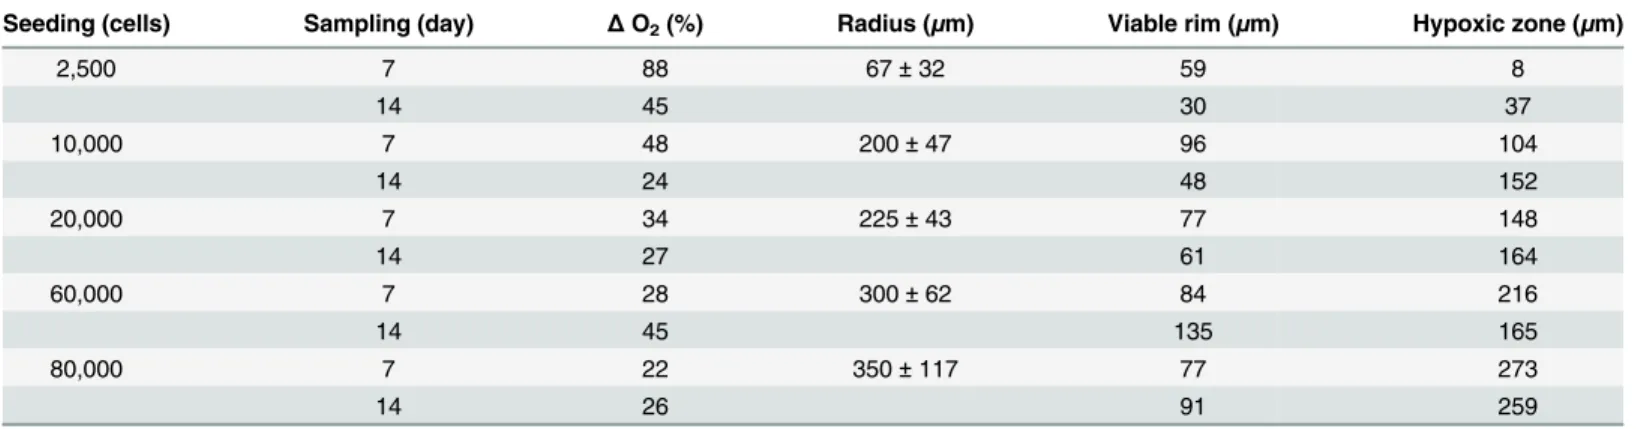
Table 1. Physiological differences between spheroids of varying sizes at separate sampling times.Oxygen concentration over time (Δ% O2) within
the spheroids is reported as individual linewidth of the spheroids as a percentage of the fully oxygenated probe and media linewidth. The viable rim of the spheroid, where oxygen is not limited, is calculated based on the total oxygen measurable in the spheroid. The hypoxic zone, where oxygen is limited, is cal-culated based on the determination of the viable rim, the refinement of which allows for the quantification of the size of the senescent zone within the RTG-2 spheroid. Results are presented as the average of three individual experiments.
Seeding (cells) Sampling (day) ΔO2(%) Radius (μm) Viable rim (μm) Hypoxic zone (μm)
2,500 7 88 67±32 59 8
14 45 30 37
10,000 7 48 200±47 96 104
14 24 48 152
20,000 7 34 225±43 77 148
14 27 61 164
60,000 7 28 300±62 84 216
14 45 135 165
80,000 7 22 350±117 77 273
14 26 91 259
prevent over-modulation and artificial broadening. Spheroids were drawn into the PTFE gas permeable tubing with*5μL of media per spheroid (2 spheroids per linewidth measurement). The tube was folded once, and the spheroids allowed to sediment at the fold. Samples were maintained in the cavity at 292°K, which is equivalent to the incubation temperature. Oxygen concentration was quantified by measuring the peak to peak line width of the spectrum relative to a sample which contained only the probe and media but not spheroids/cells. An example of the broad initial spectra at the initial time point, and the significant narrowing is demonstrated in the supporting information (S2 Fig).
Determination of Oxygen consumption rate (OCR)
Oxygen consumption rate (OCR) using EPR were obtained for spheroids formed from the RTG-2 cell line, whereμmole (μM) of oxygen was measured in a closed chamber over time, as previously described in detail [16,45]. Briefly, spheroids which had already formed around LiPc (7 days) were drawn into a glass capillary tube with*5μL of media per spheroid (n = 5) and sealed at both ends using melted paraffin avoiding the entrapment of any air bubbles. The capillary tube was visually checked for air bubbles and was discarded if it did not conform. Fol-lowing inspection, the tube was quickly placed inside the microwave cavity and EPR spectra acquisition of the LiPc was started immediately. The decrease in oxygen was measured based on the EPR spectrum and obtained from measurements of peak to peak linewidth as a function of potential oxygen present at 3 minute intervals for 160 minutes in total. The change in line-width was transformed to oxygen concentration using the predetermined calibration curve pre-sented in supporting information (S3 Fig), which was established prior to the experimental run to account for barometric pressure at that time. From this, the slope of the decrease in oxygen concentration versus time yielded the oxygen consumption rate of the spheroids. The initial oxygen concentration was calculated based on Henry’s Law constant, and taken as 201μM oxy-gen at 19°C in pure air.
Statistical Analysis
The data has been presented as mean values ± SD, withndenoting the number of replicates per experiment unless otherwise indicated. Comparison between groups were analysed by Stu-dent’s t-test (Media versus DPBS/water). Results were analysed using the Friedman non-parametric test due to non-normal data (n= 3). A value ofp<0.05 was considered significant.
Results and Discussion
Whilst there are a variety of methods available for determination of oxygen within spheroids, historically it has been acknowledged that the most commonly used method (e.g. micro-elec-trodes) suffer from several inherent limitations leading to unreliable results (oxygen produc-tion/consumption by electrode, signal drift, media requirements etc. [23]). Electron
time (S2 Fig). Although results are not presented herein, our method was also shown to be applicable to a well characterised tumour based liver spheroid model (i.e HepG2 cell line).
Oxygen micro-environments are known to form within tumour spheroid models as a func-tion of culture time and initial seeding densities of cells and spheroid size [46]. Furthermore, it is widely accepted that tumour cells exhibit greater heterogeneity due to gradual genetic changes as a function of cellular division [47]. Our study provides for the first time evidence of these micro-environments in the non-tumour spheroid model of the rainbow trout gonad cell line RTG-2 over a variety of different spheroid sizes. Previous studies have initiated spher-oid experiments (eg. exposure) on day 7 (in both aquatic and mammalian based spherspher-oids), due to a change in cellular structure from loose aggregate to spheroid [2,11]. This trend was further reiterated in our model, with support for the use of smaller spheroids. EPR spectra were recorded at two time points several days apart in order to encompass normalin vivo study durations and spheroid formation. Repeat measures of the same spheroid was possible when aseptic technique was employed during handling, and was confirmed throughout the duration of the study with significant differences recorded between time points and size of spheroids (p<0.05,n= 3). The ability of the probe to form sharp defined spectra encased within the spheroid and without agitation allows the identification of oxygen distribution within the model, with repeat recording of spectra entirely possible, as demonstrated during this study. This ability to repeat measure samples is in direct contrast to other oxygen mea-surement methods such as micro-electrodes which require the destruction of the sample per measurement.
During the study, spectra linewidth did not decrease below 290 mGauss (mG) in the larger spheroid size class (>700μm diameter), an occurrence not replicated in the literature for Lith-ium phthalocyanine, despite coming quite close to our zero oxygen linewidth of 200 mGauss (mG) in a purely nitrogen environment. A suggested reason for this disparity between recorded values herein and the literature lies in the purity of the paramagnetic probe, with impure probe particulates reporting different mGauss sensitivity, as previously observed [34]. This difference highlights the importance of calibrating each batch of LiPc probe.
Our study highlights the important association between size and the formation of oxygen limited environments (hypoxia) within the spheroid system, a finding which has already been illustrated in the literature for tumour derived spheroid models [49,50] but nevertheless has remained unknown till now in the non tumour models. The occurrence of this zone of senes-cence lends support to the suggestion that necrotic cells arising as quiescent cells die as noted by previous studies [51]. When the smallest seeding density in the RTG-2 cell spheroid is examined closely, a decrease in oxygen concentration and diffusion with time is observed, sug-gesting the the development of a quiescent zone which may with time lead to a zone of necrosis. This hypothesis is supported by the application of previous studies, which address tumour necrosis formation, with measurements for the non-tumour RTG-2 model [22]. Equally, this trend can also be extended to larger sized spheroids, where minimal oxygen concentration is indicative of large areas of hypoxia and necrosis, a trend repeated throughout the literature and highlighting the comparability of this method to existing knowledge. Both methods (EPR and formulae) of determining oxygen concentration within the spheroid model indicate that when studies requiring a lack of necrosis (such as in the fish liver spheroid model) are required, it is best to work in spheroids whose size does not exceed a 100μm in diameter. As a result, this will allow for a more physiologically relevant native tissue environment which would better dupli-cate thein vivoresponse, allowing for a reduction in the use of animals during preliminary investigative studies.
While our study shows oxygen as a percentage value in order to identify oxygenated 3D models to be used as anin vitroalternative to live fish tests, other studies report in terms of par-tial pressure. Oxygen parpar-tial pressure values of 50–60 mm Hg in the spheroid model have been reported in malignant cells using 3D oximetry methods [52]. Apart from the inherent differ-ences between the two cell lines used (i.e. non transformed fish vs transformed mammalian, incubation temperature etc.), it is difficult to make a direct comparison between the two meth-ods as different parameters were used. Furthermore, assumptions made with respect to calcu-lating the partial pressure will require taking into consideration several biological and physiochemical factors (i.e. water vapour pressure, humidity, size of the spheroids, nature of the tight junctions etc.). However, if the study is standardized to expression of percent oxygen partial pressure, then comparison is possible. For example, assuming that the partial pressure of oxygen available at 37°C is 150 mm Hg (assuming high water vapour saturation), then the external value of 120–130 mm Hg would imply that the outer layer is almost completely oxy-genated (*90%) at this temperature. This is logical if the outer layer is limited to 10–20μm, as
in our model.
In addition to numerous benefits of using EPR over other methods, it should also be noted that the inherent sensitivity of the paramagnetic probe (i.e. LiPc) allows the user to report on unusual occurrences within the system, such as the apparent increase in oxygen concentration (*11–50μM) with time in the larger sized spheroids (600μm) (Table 1). We have attributed this increase in oxygen to the cells within the centre of the spheroid dying due to lack of nutri-ents, as indicated by the size of the anoxic zone in both these size classes. While this phenome-non has so far not been reported in spheroid systems prior to this study, the hypothesis is supported by other studies that noted a similar trend of increase in dissolved oxygen level in monolayer cultures which were correlated with an increase in cell death attributed to lack of nutrients [53], but the precise mechanism as yet remains unclear.
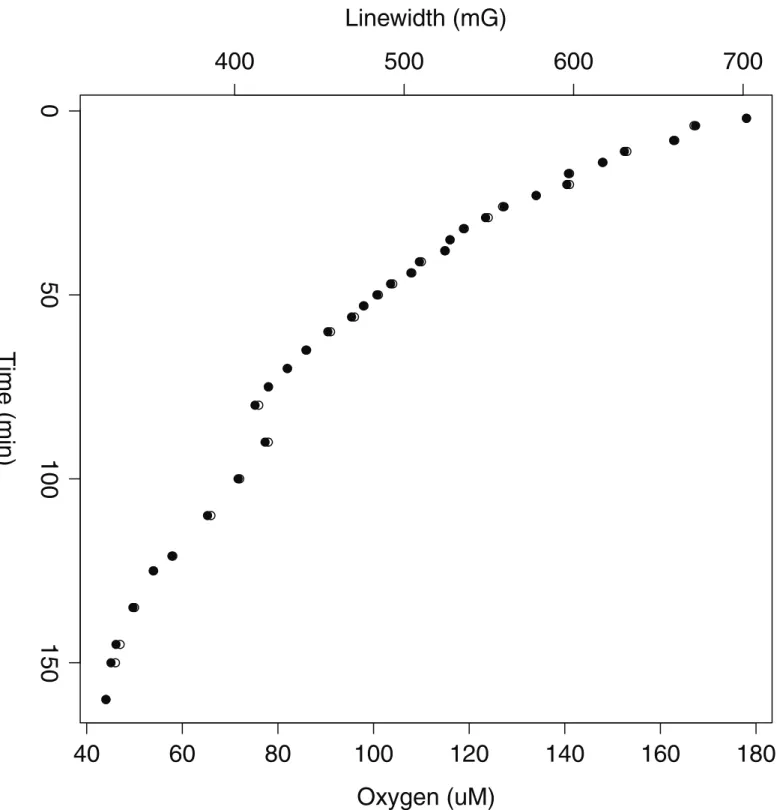
Fig 2. Oxygen consumption rate using EPR for a spheroid of*120μm on day 7.A decrease in oxygen concentration relative to time is explained by the
formula -2.21T+623.77 (R2= 0.91), where
μmole of oxygen is represented byμM and T is in minutes (160 min) and where the linear range occurs within the first 50 minutes. This linear range corresponds to an oxygen concentration range of 178-101μM. It appears that spheroids are unable to consume oxygen in a linear manner below 100μM, perhaps due to formation of oxygen diffusion gradients. The OCR rate is a result of the average of two separate experimental runs.
temperature (S3 Fig), and presented on the z-axis as a function of linewidth. The kinetics of oxygen consumption could not be recorded accurately for the first 7–10 min due to the inher-ent variation of the linewidth. Previous studies have idinher-entified that in biological tissues, a part of the oxygen sensitive LiPc form is converted into an oxygen-insensitive form [54]. Thus, it is likely that this may have occurred here due to the initial broadening/variable spectra during OCR recording. Despite this, the study method is not devalued in anyway due to the acknowl-edgement of the initial variable spectra being a common phenomenon associated with the mea-surement of oxygen concentrations using this probe. Prior studies have suggested that it is simply related to the size of the particulate used, and to increase spectra strength, fine tuning of paramagnetic particulate size must be employed for the specific model under investigation [45, 54]. In addition, reported values in the literature highlight the importance of calibrating all batches of paramagnetic probe within experimental confines. In order to limit variation, a stock solution of LiPc particulates was prepared prior to the experiment and used throughout the study limiting variability between separate recordings.
Summary and conclusion
It is widely accepted that the biological activities present in spheroids more closely reflect key characteristics of the living organism, and as such may offer a more relevant alternative toin vitroexposure in biological research. Previous studies have theorized optimal spheroid diame-ter in non-tumour mammalian spheroids which allows for effective diffusion of oxygen through the spheroid based on cell viability and functionality [5,55]. However, these methods are destructive, do not allow for repeat measures, and do not answer the question about whether a compound (of similar size) can actually diffuse through the tight junctions preva-lent during spheroid formation/maintenance. Our study addresses this question non-destruc-tively and supports the use of thesein vitrostudies as a tool to aid reduction in whole animal studies. In addition, our study also addresses the size range which is appropriate to use in non-tumour studies to ensure minimal micro-environment formation. By adjusting the size of the spheroid (<150μm diameter), it is possible to limit the percentage of the spheroid which is hypoxic/necrotic (<2 % allows for presence of senescent cells), a finding in line with previous studies [5]. Although tissue origin in the previous studies differs from our model (murine liver versus fish cell line), suggestions of no oxygen limitation in spheroids below 100μm are in complete agreement. In conclusion, EPR has provided insights into the size and cell seeding densities at which oxygen gradients will play a confounding role in subsequent exposure applications and thus enable the wider use of the spheroid model to non-tumour based biological studies.
Supporting Information
S1 Fig. Spheroid with centrally located LiPc particles.The probes are clearly visible centrally, even in small spheroids (2,500 cells/spheroid). Scale bar represents 100μm in all images bar (a). In this instance, this scale bar is set at 50μm.
(PDF)
S3 Fig. Calibration curve of LiPc probe in varying oxygen concentrations.Oxygen concen-trations (μM) were obtained from literature based on known solubility of oxygen with respect to temperature in kelvin. The relationship between the two is described by 202.94LW+ 2.65 whereR2= 0.99.
(EPS)
Author Contributions
Conceived and designed the experiments: LML NJFD SFO WMP SKJ ANJ. Performed the experiments: LML NJFD. Analyzed the data: LML NJFD. Wrote the paper: LML NJFD SFO WMP SKJ ANJ.
References
1. Nagelkerke A, Bussink J, Sweep FCGJ, Span PN. Generation of multicellular tumor spheroids of breast cancer cells: How to go three-dimensional. Anal Biochem. 2013; 437(1):17–19. Available from:http:// dx.doi.org/10.1016/j.ab.2013.02.004. doi:10.1016/j.ab.2013.02.004PMID:23435308
2. Baron MG, Purcell WM, Jackson SK, Owen SF, Jha AN. Towards a more representative in vitro method for fish ecotoxicology: Morphological and biochemical characterisation of three-dimensional spheroidal hepatocytes. Ecotoxicology. 2012; 21(8):2419–2429. doi:10.1007/s10646-012-0965-5PMID: 22732941
3. Friedrich J, Seidel C, Ebner R, Kunz-Schughart La. Spheroid-based drug screen: considerations and practical approach. Nat Protoc. 2009; 4(3):309–324. doi:10.1038/nprot.2008.226PMID:19214182 4. Tung YC, Hsiao AY, Allen SG, Torisawa Ys, Ho M, Takayama S. High-throughput 3D spheroid culture
and drug testing using a 384 hanging drop array. Analyst. 2011; 136(3):473–478. doi:10.1039/ C0AN00609BPMID:20967331
5. Glicklis R, Merchuk JC, Cohen S. Modeling mass transfer in hepatocyte spheroids via cell viability, spheroid size, and hepatocellular functions. Biotechnol Bioeng. 2004; 86(6):672–680. doi:10.1002/bit. 20086PMID:15137079
6. Breslin S, O’Driscoll L. Three-dimensional cell culture: The missing link in drug discovery. Drug Discov Today. 2013; 18(5–6):240–249. Available from:http://dx.doi.org/10.1016/j.drudis.2012.10.003. doi:10. 1016/j.drudis.2012.10.003PMID:23073387
7. Fennema E, Rivron N, Rouwkema J, van Blitterswijk C, De Boer J. Spheroid culture as a tool for creat-ing 3D complex tissues. Trends Biotechnol. 2013; 31(2):108–115. Available from:http://dx.doi.org/10. 1016/j.tibtech.2012.12.003. doi:10.1016/j.tibtech.2012.12.003PMID:23336996
8. Haycock JW. 3D Cell Culture: A Review of Current Approaches and Techniques. In: Methods Mol. Biol. vol. 695; 2011. p. 1–15. Available from:http://link.springer.com/10.1007/978-1-60761-984-0_1. doi:10. 1007/978-1-60761-984-0_1
9. Sceats E. In vitro tissue models: Working in the third dimension. Innov Pharm Technol. 2010;(35: ):28– 32.
10. Mehta G, Hsiao AY, Ingram M, Luker GD, Takayama S. Opportunities and challenges for use of tumor spheroids as models to test drug delivery and efficacy. J Control Release. 2012; 164(2):192–204. Avail-able from:http://dx.doi.org/10.1016/j.jconrel.2012.04.045. doi:10.1016/j.jconrel.2012.04.045PMID: 22613880
11. Lin RZ, Chang HY. Recent advances in three-dimensional multicellular spheroid culture for biomedical research. Biotechnol J. 2008; 3(9–10):1172–1184. doi:10.1002/biot.200700228PMID:18566957 12. Perkel JM. Animal-Free Toxicology. Science (80-). 2007;Available from:http://www.sciencemag.org/
site/products/lst_20120302.xhtml.
13. Dobrucki JW, Sutherland RM, Swartz HM. Nonperturbing test for cytotoxicity in isolated cells and spheroids, using electron paramagnetic resonance. Magn Reson Med. 1991 may; 19(1):42–55. Avail-able from:http://www.ncbi.nlm.nih.gov/pubmed/1646372.
14. Hirschhaeuser F, Menne H, Dittfeld C, West J, Mueller-Klieser W, Kunz-Schughart La. Multicellular tumor spheroids: An underestimated tool is catching up again. J Biotechnol. 2010; 148(1):3–15. Avail-able from:http://dx.doi.org/10.1016/j.jbiotec.2010.01.012. doi:10.1016/j.jbiotec.2010.01.012PMID: 20097238
16. Diepart C, Verrax J, Calderon PB, Feron O, Jordan BF, Gallez B. Comparison of methods for measur-ing oxygen consumption in tumor cells in vitro. Anal Biochem. 2010; 396(2):250–256. Available from: http://dx.doi.org/10.1016/j.ab.2009.09.029. doi:10.1016/j.ab.2009.09.029PMID:19766582 17. Krohn KA, Link JM, Mason RP. Molecular Imaging of Hypoxia. J Nucl Med. 2008 jun; 49
(Suppl_2):129S–148S. Available from:http://jnm.snmjournals.org/cgi/doi/10.2967/jnumed.110.075663 http://jnm.snmjournals.org/cgi/doi/10.2967/jnumed.107.045914. doi:10.2967/jnumed.107.045914 PMID:18523070
18. Mueller-Klieser WF, Sutherland RM. Oxygen tensions in multicell spheroids of two cell lines. Br J Can-cer. 1982; 45(2):256–264. doi:10.1038/bjc.1982.41PMID:7059474
19. Wartenberg M, Dönmez F, Ling FC, Acker H, Hescheler J, Sauer H. Tumor-induced angiogenesis stud-ied in confrontation cultures of multicellular tumor spheroids and embryoid bodies grown from pluripo-tent embryonic stem cells. FASEB J. 2001; 15(6):995–1005. doi:10.1096/fj.00-0350comPMID: 11292660
20. Nichols MG, Foster TH. Oxygen diffusion and reaction kinetics in the photodynamic therapy of multicell tumour spheroids. Phys Med Biol. 1994; 39(12):2161–2181. doi:10.1088/0031-9155/39/12/003PMID: 15551546
21. Mueller-Klieser W. Method for the determination of oxygen consumption rates and diffusion coefficients in multicellular spheroids. Biophys J. 1984 sep; 46(3):343–348. Available from:http://linkinghub. elsevier.com/retrieve/pii/S0006349584840308. doi:10.1016/S0006-3495(84)84030-8PMID:6487734 22. Grimes DR, Fletcher AG, Partridge M, Grimes DR. Oxygen consumption dynamics in steady-state
tumour models Author for correspondence:. 2014;.
23. Miniaev MV, Belyakova MB, Kostiuk NV, Leshchenko DV, Fedotova Ta. Non-obvious problems in clark electrode application at elevated temperature and ways of their elimination. J Anal Methods Chem. 2013; 2013. doi:10.1155/2013/249752PMID:23984188
24. Backer JM, Budker VG, Eremenko SI, Molin YN. Detection of the kinetics of biochemical reactions with oxygen using exchange broadening in the ESR spectra of nitroxide radicals. Biochim Biophys Acta. 1977; 460(October 2015):152–156. doi:10.1016/0005-2728(77)90161-XPMID:192284
25. Subczynski WK, Swartz HM. EPR Oximetry in Biological and Model Samples. Biomed EPR, Part A Free Radicals, Met Med Physiol. 2005;p. 229–282. doi:10.1007/0-387-26741-7_10
26. Ikeya M. Use of electron spin resonance spectrometry in microscopy, dating and dosimetry, a review. Anal Sci. 1989; 5(1):5–12.
27. Khramtsov VV. In vivo Spectroscopy and Imaging of Nitroxide Probes. 2012;.
28. Bobko Aa, Dhimitruka I, Eubank TD, Marsh CB, Zweier JL, Khramtsov VV. Trityl-based EPR probe with enhanced sensitivity to oxygen. Free Radic Biol Med. 2009; 47(5):654–658. Available from:http://dx. doi.org/10.1016/j.freeradbiomed.2009.06.007. doi:10.1016/j.freeradbiomed.2009.06.007PMID: 19523513
29. Matsumoto A, Matsumoto S, Sowers AL, Koscielniak JW, Trigg NJ, Kuppusamy P, et al. Absolute oxy-gen tension (pO2) in murine fatty and muscle tissue as determined by EPR. Magn Reson Med. 2005; 54(6):1530–1535. doi:10.1002/mrm.20714PMID:16276490
30. James PE, Jackson SK, Grinberg OY, Swartz HM. The Effects of Endotoxin on Oxygen-Consumption of various Cell-Types In-Vitro—an EPR Oximetry Study. Free Radic Biol Med. 1995; 18(4):641–647. doi:10.1016/0891-5849(94)00179-NPMID:7750788
31. Ahmad R, Kuppusamy P. Theory, instrumentation, and applications of electron paramagnetic reso-nance oximetry. Chem Rev. 2010; 110(5):3212–3236. doi:10.1021/cr900396qPMID:20218670 32. Hyodo F, Matsumoto S, Hyodo E, Matsumoto A, Matsumoto K, Krishna MC. In Vivo Measurement of
Tissue Oxygen Using Electron Paramagnetic Resonance Spectroscopy with Oxygen-Sensitive Para-magnetic Particle, Lithium Phthalocyanine. In: Methods Mol. Biol. vol. 610; 2010. p. 29–39. Available from:http://link.springer.com/10.1007/978-1-60327-029-8_2. doi:10.1007/978-1-60327-029-8_2 33. Pandian RP, Parinandi NL, Ilangovan G, Zweier JL, Kuppusamy P. Novel particulate spin probe for
tar-geted determination of oxygen in cells and tissues. Free Radic Biol Med. 2003; 35(9):1138–1148. doi: 10.1016/S0891-5849(03)00496-9PMID:14572616
34. Liu KJ, Gast P, Moussavi M, Norby SW, Vahidi N, Walczak T, et al. Lithium phthalocyanine: a probe for electron paramagnetic resonance oximetry in viable biological systems. Proc Natl Acad Sci U S A. 1993; 90(12):5438–5442. doi:10.1073/pnas.90.12.5438PMID:8390665
36. Liu J, Kuznetsova La, Edwards GO, Xu J, Ma M, Purcell WM, et al. Functional three-dimensional HepG2 aggregate cultures generated from an ultrasound trap: Comparison with HepG2 spheroids. J Cell Biochem. 2007; 102(5):1180–1189. doi:10.1002/jcb.21345PMID:17440959
37. Wolf K, Quimby MC. Established eurythermic line of fish cells in vitro. Science. 1962; 135(3508):1065– 1066. Available from:http://www.jstor.org/stable/1709158. doi:10.1126/science.135.3508.1065PMID: 14007940
38. Schulz M and Lewald B and Kohlpoth Martin and Rusche Brigitte and Lorenz, Katrin HJ and Unruh Eck-ehardt and Hansen Peter-D and Miltenburger H. No Title Fischzellinien in der toxikologischen Bewer-tung von Abwasserproben. ALTEX. 1995; 12(4):95.
39. Kocan RM, Landolt ML, Sabo KM. Anaphase aberrations: a measure of genotoxicity in mutagen-treated fish cells. Environ Mutagen. 1982; 4(2):181–9. Available from:http://www.ncbi.nlm.nih.gov/ pubmed/6280991. doi:10.1002/em.2860040208PMID:6280991
40. Smith RW, Houlihan DF. Protein Synthesis and Oxygen Consumption in Fish Cells. J Comp Physiol— B, Biochem Syst Environ Physiol. 1995; 165(2):93–101. doi:10.1007/BF00301473
41. Papis E, Davies SJ, Jha AN. Relative sensitivity of fish and mammalian cells to the antibiotic, trimetho-prim: Cytotoxic and genotoxic responses as determined by neutral red retention, Comet and micronu-cleus assays. Ecotoxicology. 2011; 20(1):208–217. doi:10.1007/s10646-010-0572-2PMID:21104197 42. Raisuddin S, Jha AN. Relative sensitivity of fish and mammalian cells to sodium arsenate and arsenite
as determined by alkaline single-cell gel electrophoresis and cytokinesis-block micronucleus assay. Environ Mol Mutagen. 2004; 44(1):83–89. doi:10.1002/em.20027PMID:15199550
43. Repetto G, del Peso A, Zurita JL. Neutral red uptake assay for the estimation of cell viability/cytotoxicity. Nat Protoc. 2008; 3(7):1125–1131. doi:10.1038/nprot.2008.75PMID:18600217
44. Mothersill Carmel and Austin B. In vitro methods in aquatic Ecotoxicology; 2003.
45. Presley T, Kuppusamy P, Zweier JL, Ilangovan G. Electron paramagnetic resonance oximetry as a quantitative method to measure cellular respiration: a consideration of oxygen diffusion interference. Biophys J. 2006; 91(12):4623–4631. Available from:http://dx.doi.org/10.1529/biophysj.106.090175. doi:10.1529/biophysj.106.090175PMID:17012319
46. Friedrich J, Eder W, Castaneda J, Doss M, Huber E, Ebner R, et al. A reliable tool to determine cell via-bility in complex 3-d culture: the acid phosphatase assay. J Biomol Screen Off J Soc Biomol Screen. 2007; 12(7):925–937. doi:10.1177/1087057107306839
47. Vaupel P, Kallinowski F, Okunieff P. Blood flow, oxygen and nutrient supply, and metabolic microenvi-ronment of human tumors: a review. Cancer Res. 1989; 49:6449–6465. Available from:http://
cancerres.aacrjournals.org/content/49/23/6449.shortn\delimiter”026E30Fnnpapers2://publication/uuid/ 971DFCE9-0093-4881-9A0F-7D5CA4C15D78. PMID:2684393
48. Ma HL, Jiang Q, Han S, Wu Y, Tomshine JC, Wang D, et al. Multicellular tumor spheroids as an in vivo-like tumor model for three-dimensional imaging of chemotherapeutic and nano material cellular pene-tration. Mol Imaging. 2012; 11(6):487–498. PMID:23084249
49. Ho WY, Yeap SK, Ho CL, Rahim RA, Alitheen NB. Development of Multicellular Tumor Spheroid (MCTS) Culture from Breast Cancer Cell and a High Throughput Screening Method Using the MTT Assay. PLoS One. 2012; 7(9). doi:10.1371/journal.pone.0044640
50. Sutherland R, Carlsson J, Durand R, Yuhas J. Spheroids in Cancer Research. Cancer Res. 1981; 41 (7):2980–2984. Available from:http://cancerres.aacrjournals.org/content/41/7/2980.abstract. 51. Wallace DI, Guo X. Properties of tumor spheroid growth exhibited by simple mathematical models.
Front Oncol. 2013; 3(March):51. Available from:http://www.frontiersin.org/Journal/10.3389/fonc.2013. 00051/abstract. doi:10.3389/fonc.2013.00051PMID:23508803
52. Hashem M, Weiler-Sagie M, Kuppusamy P, Neufeld G, Neeman M, Blank A. Electron spin resonance microscopic imaging of oxygen concentration in cancer spheroids. J Magn Reson. 2015; 256:77–85. Available from:http://linkinghub.elsevier.com/retrieve/pii/S1090780715001007. doi:10.1016/j.jmr. 2015.04.012PMID:26022394
53. Naciri M, Kuystermans D, Al-Rubeai M. Monitoring pH and dissolved oxygen in mammalian cell culture using optical sensors. Cytotechnology. 2008; 57(3):245–250. doi:10.1007/s10616-008-9160-1PMID: 19003181
54. Ilangovan G, Li H, Zweier JL, Kuppusamy P. Electrochemical preparation and EPR studies of lithium phthalocyanine. 3. Measurements of oxygen concentration in tissues and biochemical reactions. J Phys Chem B. 2001; 105(22):5323–5330. doi:10.1021/jp010130+