original article
Licence Creative Commom
CC
BY
RBCDH
1 Universidade Federal de Santa Catarina. Departamento de Nutri-ção. Florianópolis, SC. Brasil
Received: 05 August 2013 Accepted: 19 March 2014
Methods for estimating body weight
and height in hospitalized adults: a
comparative analysis
Métodos de estimativa de peso corporal e altura em
adultos hospitalizados: uma análise comparativa
Ana Paula Ferreira Melo1
Raquel Kuerten de Salles1
Francilene Gracieli Kunradi Vieira1
Marilyn Gonçalves Ferreira1
Abstract – he aim of this study was to compare the values obtained through methods
directed to height and body weight estimates in relation to measurements taken from hospitalized adult. Study participants were 142 adults of both genders. Anthropometric measurements of body weight, height, knee height, arm length, span, demi-span, recum-bent height, calf, arm and abdominal circumferences and subscapular skinfold thickness were taken. he actual measurements were compared with those obtained from formulas for estimating weight and height, using the paired t test. he estimated measurements dif-fered signiicantly (p <0.001) from the actual measurements in both genders, observing the tendency of overestimating these measurements. he exception was the estimated height for men by the formula that utilizes the variable knee height (p> 0.001). he aver-age estimated body weight closest to the actual body weight for men was obtained with the formula that used the measurements of arm, abdominal and calf circumferences. For women, the biggest coincidences were obtained by means of the formula that utilizes the variable knee height. For both men and women, the averages related to the body mass index, calculated through estimated body weight and height measurements resulted in the same nutritional diagnosis when compared to the body mass index involving actual measurements. he estimated height by the formula that utilizes the variable knee height among men was the only measurement which did not represent signiicant diferences. Other methodologies for estimating body weight and height presented signiicant difer-ences, which suggests that new studies using other methodologies are necessary.
Key words: Anthropometry; Body composition; Body weights and measures; Estimation
techniques.
Body weight and height in adults Melo et al.
INTRODUCTION
Nutritional assessment is a useful tool to support the therapeutic proposal and monitor the efectiveness of nutritional interventions, especially in
hospitalized individuals1. Among the nutritional assessment methods,
anthropometric measurements stand out, in which body weight and height are the most widely used. Both measures are essential for establishing the
nutritional diagnosis and dietary and pharmacological prescriptions2.
Subject who are bedridden and unable to walk require equipment and technological solutions to meet the need for weighing in bed. Scales integrated to hospital beds are examples, however, they have high costs
and are not reality in hospitals3.
hus, many researchers have sought to develop methods to estimate body weight and height from speciic measures of body segments that can be measured in these patients such as knee height, arm and calf
circum-ferences, skinfold thickness, among others4-10.
Considering the importance of measures such as body weight and height as essential indicators in the assessment of the nutritional status and the impossibility to take these measures in bedridden subjects, this study aimed to compare values found by methods aimed to estimate body weight and height most frequently used in clinical practice with measurements taken in hospitalized adults.
METHODS
his is an analytical, quantitative cross-sectional study conducted in a pub-lic hospital in southern Brazil from July 2011 to August 2012. he sample was obtained by convenience and selected according to the following crite-ria: adults aged 20-60 years of both sexes, able to walk and hospitalized in medical and surgical clinics in the aforementioned hospital. Subjects with peripheral edema, ascites or anasarca, with limb amputation or paralysis or on dialysis were excluded.
he project was approved by the Ethics Committee on Human Research of the Federal University of Santa Catarina, Protocol 1107. All study par-ticipants signed the informed consent form.
Anthropometric measurements were selected according to variables contained in the formulas for estimating body weight and height selected in this study (Box 1). he inal data collection was preceded by training of the researchers involved, seeking to standardize procedures and mea-surement techniques.
Authors Formula
Mitchell & Lipschitz4 (A
1) Height = semi-span x 2
WHO4 (A
2) Height = [0.73 x (2 x half of arm span)] + 0.43
Rabito et al.2 (A
3 e A4) Height = 58.6940 – (2.9740 x sex*)– (0.0736 x age) + (0.4958 x arm length)
+ (1.1320 x semi-span)
Height = 63.525 – (3.237 x sex*) – (0.06904 x age) + (1.293 x semi-span)
Gray et al.13 (A
5) Height = recumbent height
Chumlea et al.4 (A
6) White women: Height = 70.25 + (1.87 x knee height) – (0.06 x age)
Black women: Height = 68.1+ (1.86 x knee height) – (0.06 x age) White men: Height = 71.85 + (1.88 x knee height)
Black men: Height = 73.42+ (1.79 x knee height)
Cereda et al.8 (A
7) Height = 60.76 + (2.16 knee height) – (0.06 x age) + (2.76 x sex**)
Formulas used to estimate body weight
Author/Year Formula
Chumlea et al.6 (P
1) Women: Body weight (kg) = (1.27 x calf circumference) + (0.87 x knee
height) + (0.98 x arm circumference) + (0.4 x subscapular skinfold thick-ness) – 62.35
Men: Body weight (kg) = (0.98 x calf circumference) + (1.16 x knee height) + (1.73 x arm circumference) + (0.37 x subscapular skinfold thickness) – 81.69
Rabito et al.2 (P
2, P3 e P4) Body weight (kg) = (0.5030 x arm circumference) + (0.5634 x abdominal
circumference) + (1.3180 x calf circumference) + (0.0339 x subscapular skinfold thickness) – 43.1560
Body weight (kg) = (0.4808 x arm circumference) + (0.5646 x abdominal circumference) + (1.3160 x calf circumference) – 42.2450
Body weight (kg) = (0.5759 x arm circumference) + (0.5263 x abdominal circumference) + (1.2452 x calf circumference) – (4.8689 x sex*) ± 32.9241
Ross Laboratories9 (P
5) White women: Body weight (kg) = (knee height x 1.01) + (arm
circumfer-ence x 2.81) – 66.04
Black women: Body weight (kg) = (knee height x 1.24) + (arm circumfer-ence x 2.81) – 82.48
White men: Body weight (kg) = (knee height x 1.19) + (arm circumference x 3.21) – 86.82
Black men: Body weight (kg) = (knee height x 1.09) + (arm circumference x 3.14) – 83.72
* 1 male; 2 female; ** 1 male; 0 female
Height was measured with Altura Exata® stadiometer ixed to a wall without footer, two meters high. To measure body weight, Tanita ® digital scales with maximum capacity of 150 kg was used with subjects standing barefoot and wearing only hospital garments. Both measures were assessed
according to standards recommended by Jellife11. Body weight and height
measurements were considered “gold standard” for comparisons performed in the present study.
To measure SS, the distance between the midpoint of the sternum and the distal phalanx of the right middle inger was measured by
pass-ing a lexible, inelastic measure tape parallel to the clavicle4. To assess S,
Body weight and height in adults Melo et al.
shoulders12.
RH measurement involved the individual’s length obtained with a lex-ible, inelastic measure tape ater marking the stretcher with chalk through the triangle from top of the head to the foot sole with patient in the supine
position and with bed in complete horizontal position13.
KH was measured with subject in the supine position with the right leg at an angle of ninety degrees with knee and ankle using Cescorf® caliper, comprising a ixed part, which was positioned in the plantar surface of the
foot (heel) and a movable part pressed on the head of the patella (kneecap)6.
AL was measured in the right arm with forearm lexed at ninety de-grees, and measure was taken from the tip of the acromion process of the scapula and the olecranon process of the ulna, with measure tape on the
lateral side of the arm14.
Circumferences were measured with a lexible and inelastic measure tape on the right side of the body according to techniques proposed by
Callaway et al.15. AC was measured at the midpoint between the acromion
and the olecranon; CC in the maximum circumference of the calf muscle of the right leg and AC was assessed on the smallest horizontal circumference in the area between the ribs and the iliac crest.
SEsf was obtained by averaging three measurements with Lange® compass obliquely to the longitudinal axis. he caliper jaws applied 1 cm infero-lateral to the thumb and inger raising the fold, and the thickness is recorded to the rearest 0,1 cm. he orientation of the costal arches located
one centimeter below the inferior angle of the right scapula16.
Nutritional status was evaluated through the body mass index (BMI), calculated using the Body Weight (kg) / height (m)² coeicient. Nutritional status was classiied according to cutofs recommended by the World Health
Organization (WHO)17. Forty-seven BMI combinations were calculated
using estimated measures. We chose to examine only those with more satisfactory results.
Data were analyzed using the STATISTICA sotware, version 7.0. All variables were tested for normality by the Kolmogorov-Smirnov test. As-suming that all variables considered were normally distributed, the paired t test was used. As level of statistical signiicance, p value ≤ 0.05 was adopted.
RESULTS
he study included 142 adults, 74 (52.1%) were male. he average age of the sample was 42.5 years ± 11.1 years. Regarding nutritional status, overweight was identiied in 29% of women and 28% of men.
Men
Actual 1.71 0.08 -
-A1 1.80 0.10 0.09 13.93 0.0000
A2 1.74 0.07 0.03 6.54 0.0000
A3 1.74 0.07 0.03 5.26 0.0000
A4 1.73 0.07 0.02 4.53 0.0000
A5 1.74 0.08 0.03 6.89 0.0000
A6 1.71 0.09 -0.005 -0.59 0.5538
A7 1.75 0.01 0.04 3.73 0.0003
Women
Real 1.58 0.06 -
-A1 1.64 0.08 0.05 8.73 0.0000
A2 1.63 0.06 0.04 8.27 0.0000
A3 1.60 0.06 0.01 3.22 0.0019
A4 1.60 0.06 0.01 2.79 0.0067
A5 1.62 0.07 0.03 10.28 0.0000
A6 1.56 0.07 - 0.02 -2.94 0.0044
A7 1.61 0.09 0.03 3.53 0.0007
SD = Standard deviation; A1 = Mitchell & Lipschitz4; A 2 = WHO
5; A
3 e A4 = Rabito et al. 2; A
5 = Gray et al. 13; A
6 =
Chumlea et al. 7; A
7 = Cereda et al. 8.
With respect to height, it was found that the estimated measures dif-fered signiicantly (p <0.001) from actual measures for men and women.
he exception was height estimated by the formula of Chumlea et al.7 (A6)
for men, which showed no signiicant mean diference (p> 0.05) compared to the actual measure. his formula was also the only one who
underesti-mated actual height for females. Formulas developed by Rabito et al.2 (A3
and A4) showed the closest measures of actual height for females. he formula that showed the largest average diference from the actual height for both sexes was the formula that used the semi-span measure
(A1)4, overestimating the height by 9 cm for males and 6 cm for females.
he formula of WHO (A2)17, which uses the wingspan measure, also showed
signiicant diference from the actual measure, but with lower mean dif-ferences (3 cm for males and 5 cm for females).
Mean diferences between actual and estimated measures were sig-niicant (p<0.001), with overestimation of the actual body weight in all formulas of estimated weight for both sexes, with the exception of body
weight obtained by the formula of Chumlea et al.6 (P1), which
underes-timated body weight in women. Esunderes-timated body weight measures closest to the actual weight for men were obtained with the formulas of Rabito et
al.2 (P2 and P3) and for women with the formula of Chumlea et al.6 (P1).
Greater diferences were obtained by using the formula of Ross
Laborato-ries9 (P5), which overestimated the actual body weight by 4.5 kg for males
Body weight and height in adults Melo et al.
Table 2. Comparison between actual and estimated body weight measures (kg) of hospitalized adults
Weight (kg) Mean SD Dif Mean CI (95%) t p
Men
Actual 71.09 13.40 - -
-P1 75.50 12.83 4.41 2.85 – 5.96 5.64 0.0000
P2 73.33 11.66 2.24 0.92 – 3.56 3.39 0.0011
P3 73.03 11.43 1.93 0.60 – 3.26 2.90 0.0049
P4 74.32 11.13 3.23 1.9 – 4.55 4.85 0.0000
P5 75.62 13.15 4.53 2.88 – 6.18 5.47 0.0000
Women
Actual 69.34 18.77 - -
-P1 67.23 15.29 - 2.11 - 3.66 – - 0.56 -2.72 0.0082
P2 76.46 15.29 7.12 5.90 – 8.34 11.64 0.0000
P3 75.89 17.13 6.55 5.30 – 7.79 10.51 0.0000
P4 72.29 16.73 2.95 1.70 – 4.19 4.72 0.0000
P5 72.69 15.85 3.35 1.58 – 5.13 3.77 0.0003
SD = standard deviation; CI = conidence interval; P1 = Chumlea et al.7; P
2, P3 and P4 = Rabito et al. 2; P
5 = Ross
Laboratories9.
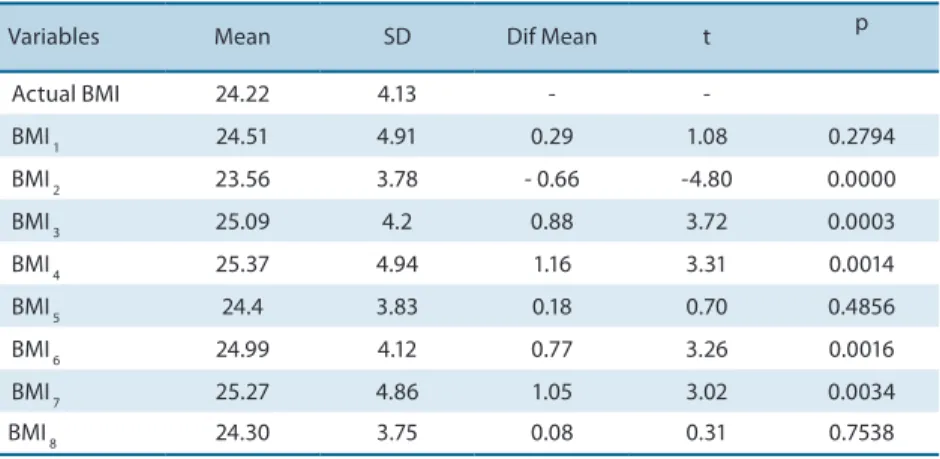
he averages of estimated BMI (24.68 kg/m² for males and 27.71 kg / m² for female) resulted in the same nutritional diagnosis of actual BMI: nor-mal weight among nor-males and overweight among fenor-males (Tables 3 and 4) .
Table 3. Comparison between actual and estimated body mass index values (kg / m²) of hospitalized male adults
Variables Mean SD Dif Mean t p
Actual BMI 24.22 4.13 -
-BMI 1 24.51 4.91 0.29 1.08 0.2794
BMI 2 23.56 3.78 - 0.66 -4.80 0.0000
BMI 3 25.09 4.2 0.88 3.72 0.0003
BMI 4 25.37 4.94 1.16 3.31 0.0014
BMI 5 24.4 3.83 0.18 0.70 0.4856
BMI 6 24.99 4.12 0.77 3.26 0.0016
BMI 7 25.27 4.86 1.05 3.02 0.0034
BMI 8 24.30 3.75 0.08 0.31 0.7538
SD = standard deviation; Actual BMI = actual weight / (actual height) ²; BMI1 = actual weight /(A6)²; BMI2 = actual weight /(A4)²; BMI3 = P2/(actual height)²; BMI4 = P2/(A6)²; BMI5 = P2/(A4)²; BMI6 = P3/(actual height)²; BMI7 = P3/(A6)²; BMI8 = P3/(A4)²; A4, P2 and P3 = Rabito et al.2; A
6 = Chumlea et al. 7).
For males, three of BMI analyzed showed no signiicant diference from the actual BMI: BMI 1, which used actual body weight and height estimated
by Chumlea et al. (A6)7 and BMI 5 and 8 that used body weight (P2 and
P3 respectively) and height (A4) estimated by Rabito et al.2 (Table 3). For
women, only BMI 5 that used weight (P1) and height (A6) measurements
estimated by formulas of Chumlea et al.6,7 showed no signiicant diference
Actual BMI 27.68 7.94 -
-BMI 1 28.45 8.17 0.77 3.22 0.0019
BMI 2 27.12 7.56 - 0.56 -3.29 0.0015
BMI 3 27.14 7.38 - 0.54 -2.90 0.0050
BMI 4 26.79 6.3 - 0.88 -2.74 0.0078
BMI 5 27.52 6.49 - 0.15 -0.41 0.6801
BMI 6 26.27 6.06 -1.40 -3.56 0.0006
BMI 7 26.29 5.86 - 1.38 -3.44 0.0010
BMI 8 28.92 7.37 1.24 4.81 0.0000
BMI 9 29.74 7.7 2.06 5.47 0.0000
BMI 10 28.32 6.95 0.64 2.21 0.0299
BMI 11 28.35 6.79 0.67 2.15 0.0349
SD = standard deviation; Actual BMI = actual weight / (actual height) ²; BMI1 = actual weight /(A6)2; BMI 2 =
actual weight /(A3)2; BMI
3 = actual weight /(A4) 2; BMI
4 = P1/(actual height) 2; BMI
5 = P1/(A6) 2; BMI
6 = P1/(A3) 2;
BMI7 = P1/(A4)2; BMI
8 = P4/(actual height) 2; BMI
9 = P4/(A6) 2; BMI
10 = P4/(A3) 2; BMI
11 = P4/(A4) 2; A
3, A4 and P4 =
Rabito et al. (2006); A6 and P1 = Chumlea et al.7.
DISCUSSION
All estimated measures signiicantly difered from actual measures in
both sexes, except for height for men using the formula of Chumlea et al.7.
As in the present study, other authors1,8,18 also found no signiicant
difer-ences when comparing actual height measurements to those estimated by
Chumlea et al.7.
his formula has the advantage of easy application, as it requires the measurement of a single measure, KH, requiring the use of one caliper.
One of the formulas of easy application and widely used in clinical practice to estimate height is the formula that used twice the half-span
(A1)4. his measure showed the largest diference from the actual measured
in the present study. Other studies1,18 also found signiicant overestimation
of the actual height with this measure. Other studies found diferent
re-sults20-23, obtaining statistical similarity between actual height and twice
the half-spam. he formula developed by WHO5, which uses wingspan
also resulted in statistically signiicant diferences in this study, but with a smaller diference from the actual measurement. A similar result was
found by Beghetto et al.24, who obtained a signiicant diference between
actual measure and that estimated by WHO5, with a mean diference of
3 cm between them, which use was not recommended despite its easy application.
Recumbent height (A5)13 also did not result in average height closer to
the actual measure, overestimating 3 cm in height for males and 4 cm for
Body weight and height in adults Melo et al.
In relation to methods to estimate body weight, this study showed a signiicant diference between actual and estimated weight measures for
both sexes. Similar results were obtained by other authors2,18,19.
Dock-Na-scimento et al.23 and Sampaio et al.25 performed a study with adults and
the elderly and obtained signiicant similarity between actual weight and
that estimated by Chumlea et al.6.
he best results of body weight estimation in this study were obtained
using the formulas of Rabito et al.2 for men and Chumlea et al.6 and
Ra-bito et al.2 for women. he formula of Rabito et al.2 was easy to be applied,
which calculation uses only AL, AC and CC measured only with measure
tape. he estimated body weight with the formula of Chumlea et al.6 (P1)
requires the SESF measurement, which may represent a negative factor because it requires measuring skinfold thickness, the researcher must be trained and the individual should remain seated during measurement.
With respect to BMI, it was identiied that most measures showed signiicant diference from actual measures. For males, there was no sig-niicant diference when estimated and actual BMI were compared using
actual body weight and that estimated by Chumlea et al.7 (BMI1). his result
was expected because this formula showed the best results to obtain height for men in the present study. BMI 5 and 8, which used weight (P2 and P3) and height (A4) measures estimated according to the formulas proposed
by Rabito et al.2, also showed no diference compared to actual BMI values.
It is believed that this result may be due to the similar body composition among males of both studies, as in this study, the mean BMI was 24.2 kg
/ m² and 24 kg / m² in the study of Rabito et al.2.
For females, there was no signiicant diference only between actual BMI
and BMI5, which combined weight (P1) and height (A6) estimated by
Chum-lea et al.7. his result may be associated with the fact that these estimated
measures are the closest to actual measures among females in this study. In the present study, estimated BMI that showed results closer to actual values were those that combined weight measured using the best height estimate for men. Few studies that assessed BMI using estimated measures were found, which makes the comparison with our results diicult.
CONCLUSION
By comparing methodologies for estimating body weight and height used in this study with actual measures, it was observed that these methods showed a trend of overestimating body measures in both sexes. he only estimated measures that showed no signiicant diference from the actual measure was height for men, using anthropometric variable knee height. his measure is of easy application in clinical practice.
would result in BMI more close to actual BMI. It was observed that the use of body weight and height obtained from formulas developed by the same author resulted in BMI more close to actual BMI.
here are still few national studies comparing diferent methodologies for estimating body weight and height in adults and especially analyzing the nutritional status of populations from these measures. hus, further research should be carried out in order to validate existing equations and compare speciic population groups using formulas that combine efective-ness, low cost and easy application.
REFERENCES
1. Rezende FAC, Rosado LEFPL, Franceschinni SCC, Rosado GP, Ribeiro RCL. Avaliação da aplicabilidade de fórmulas preditivas de peso e estatura em homens adultos. Rev Nutr 2009;22(4):443-51.
2. Rabito EI, Vannucchi GB, Suen VMM, Neto LLC, Marchini JS. Weight and height prediction of immobilized patients. Rev Nutr 2006;19(6):655-61.
3. Dias MCG, Horie LM, Waitzberg DL. Exame físico e antropometria. In: Waitzberg DL. Nutrição oral, enteral e parenteral na prática clínica. 4ª ed. São Paulo: Ed. Atheneu; 2009. p. 383-419.
4. Mitchell CO, Lipschitz DA. Arm length measurement as an alternative to height in nutritional assessment of the elderly. J Parenter Enteral Nutr 1982;6(3):226-9. 5. World Health Organization. Management of the Child with a Serious Infection
or Severe Malnutrition. 1999; Available from: http://whqlibdoc.who.int/hq/2000/ WHO_FCH_CAH_00.1.pdf > [2011 Jun 2].
6. Chumlea WMC, Guo SS, Roche AF, Steinbaugh ML. Prediction of body weight for the nonambulatory elderly from anthropometry. J Am Diet Assoc 1988;88(5):564-8. 7. Chumlea WMC, Guo SS, Steinbaugh ML. Prediction of stature from knee height for black and white adults and children with application to mobility impaired or handicapped persons. J Am Diet Assoc 1994;94(12):1385-8.
8. Cereda E, Bertoli S, Battezzati A. Height prediction formula for middle-aged (30–55 y) Caucasians. Nutrition 2010;26(11-12):1075-81.
9. Ip.com. he Ross Knee Height Caliper. 2002. Available from: <http://ip.com/pdf/ ipcompad/IPCOM000006911D.pdf> [2011 Jun 15]
10. Chumlea WMC, Roche AF, Steinbaugh ML. Estimating stature from knee height for persons 60 to 90 years of age. J Am Geriatr Soc 1985;33(2):116-20.
11. Jellife DB. he assessment of the nutritional status of the community. Geneva,1966. Available from: < http://www.ernaehrungsdenkwerkstatt.de/ileadmin/user_up- load/EDWText/TextElemente/PHNTexte/WHO_FAO_Report/Jellife_Assess-ment_Buch_WHO_MONO_53_assessment_part1.pdf> [2011 Mar 20].
12. Barros DC, Silva JP, Felipe GC, Zaborowski EL. Antropometria. In: Barros DC, editor. SISVAN: Instrumento para o combate aos distúrbios nutricionais na aten-ção à saúde: A Antropometria. 20ª ed. Rio de Janeiro: Ed Fiocruz; 2005. p.51-58. 13. Gray DS, Crider JB, Kelley C, Dickinson LC. Accuracy of recumbent height
meas-urement. J Parenter Enteral Nutr 1985;9(6):712-5.
14. Alvarez BR, Pavan AI. Altura e comprimentos. In: Petroski EL. editor. Antropo-metria: técnicas e padronizações. 1ª ed. Porto Alegre: Palotti, 1999. p.31-47. 15. Callaway CW, Chumlea WMC, Bouchard C, Himes JH, Lohman TG, Martin AD,
Body weight and height in adults Melo et al.
Corresponding author
Raquel Kuerten de Salles. Hospital Universitário Polydoro Ernani de São Thiago.
Rua Prof. Maria Flora Pausewang, s/n. Trindade. CEP: 88036-800
Florianópolis, SC. Brasil. E-mail: [email protected]
16. Lee RD, Nieman, DC. Antropometry. In: Lee RD, Nieman DC. Editors. Nutritional assessment. 2ª ed. St Louis: Mosby, 1996. p.160-213.
17. World Health Organization. Obesity: preventing and managing the global epidemic. Report of a WHO Consulation. Geneva: WHO; 1998. Available from: <http://libdoc. who.int/trs/WHO_TRS_894.pdf> [acesso 2011 20 mar].
18. Yugue SF, Ide HW, Tiengo A. Comparação da avaliação antropométrica em pa-cientes internados por intermédio de métodos estimativos e diretos. Rev Ciênc Saúde 2011;1(3):1-10.
19. Rodrigues PA, Ruino MCB, Correia EA, Lima JMR, Lisboa AAQ. Correlação das medidas antropométricas reais do peso e da altura com os métodos de estimativa em pacientes adultos do Hospital Regional de Ceilândia. Com Ciênc Saúde 2011; 21(3):237-44.
20. Brown JK, Whittemore KT, Knapp TR. Is arm span an accurate measure of height in young and middle-age adults? Clin Nurs Res 2000;9(1):84-94.
21. Bjelica D, Popovic S, Kezunovic M, Petkovic J, Jurak G, Grasgruber P. Body height and its estimation utilizing arm span measurements in Montenegrin adults. An-thropol Noteb 2012;18(2):69-83.
22. Dock-Nascimento DB, Aguilar-Nascimento JE, Costa HCBAL, Vale HV, Gava MM. Precisão de métodos de estimativa do peso e altura na avaliação do estado nutricional de pacientes com câncer. Rev Bras Nutr Clin 2006;21(2):111-6. 23. Mohanty SP, Babu SS, Nair NS. he use of arm span as a predictor of height: a study
of south indian women. J Orthop Res 2001;9(1):19-23.
24. Beghetto MG, Fink J, Lut VC, Mello ED. Estimates of body height in adult inpa-tients. Clin Nutr 2006;25(3):438-43.