*Correspondência: F. R. Lourenço - Departamento de Farmácia - Faculdade de Ciências Farmacêuticas - Universidade de São Paulo - Av. Prof. Lineu Prestes, 580 - Bloco 13A - São Paulo - SP - Brasil - E-mail: [email protected]
A
rti
Pharmaceutical Sciences vol. 45, n. 3, jul./sep., 2009
Comparison of three experimental designs employed in gentamicin
microbiological assay through agar diffusion
Felipe Rebello Lourenço, Terezinha de Jesus Andreoli Pinto
Department of Pharmacy, CONFAR Laboratory, Faculty of Pharmaceutical Sciences, University of São Paulo
Gentamicin is a broad-spectrum antibiotic complex produced by actinomycetes belonging to Micromonospora genus and classiied among aminoglycoside antibiotics, used in the treatment of serious infections derived from Gram-negative microorganisms. Alterations of their antimicrobial activity not shown in chemical assays can be evaluated through microbiological assays. The aim of this work was to compare 5 x 1, 2 x 2 and 3 x 1 experimental designs, evaluating validation parameters of speciicity, linearity, range, precision, and accuracy for each experimental design in different levels of concentration, presentation, and lots. It consisted of 81 assays (in 3 replicas) of gentamicin microbiological dosage. The concentrations of the solutions used were employed in a range from 1.0 µg/mL to 5.0 µg/mL, diluted in phosphate buffer 0.1 M pH 8.0. Antibiotic medium number 11 was used, with Staphyloccocus epidermis (ATCC 12228). 21ml of medium were used as base layer and 4 ml of medium inoculated at 1% were used as surface layer. The dishes were incubated for 18 hours at 37 ± 1 oC. The three designs employed showed adequate speciicity for analysis of dermatological cream and injectable solution containing gentamicin sulphate. They also showed accuracy and linearity in the range evaluated, but not a signiicant difference concerning precision. The results were compared by means of the determination of the rates of measurement system capacity. The statistical analysis demonstrated that there is no signiicant difference among the results obtained through 5 x 1, 2 x 2, and 3 x 1, being these equivalent and interchangeable.
Uniterms: Gentamicin/sulphate. Antibiotics/experimental design. Gentamicin/microbiological dosage. Antibiotics/qualitative analysis. Aminoglycoside antibiotics/antimicrobial activity.
A gentamicina é um complexo antibiótico de largo espectro, produzido por actinomicetos do gênero Micromonospora e classiicado entre os antibióticos aminoglicosídeos, utilizado no tratamento de infecções graves, devidas a microrganismos Gram-negativos. Alterações da sua atividade antimicrobiana, não demonstradas pelos ensaios químicos, podem ser avaliadas pelos ensaios microbiológicos. O objetivo deste trabalho foi comparar os delineamentos experimentais 5 x 1, 2 x 2 e 3 x 1, avaliando-se os parâmetros de validação de especiicidade, linearidade, faixa ou intervalo, precisão e exatidão para cada delineamento experimental em diferentes níveis de concentração, apresentações e lotes. O plano de trabalho constituiu-se na realização de 81 ensaios (em 3 réplicas) de doseamento microbiológico de gentamicina. As concentrações das soluções empregadas foram preparadas numa faixa de 1,0 µg/mL a 5,0 µg/mL, diluídos em tampão fosfato 0,1 M pH 8,0. O meio utilizado foi o meio antibiótico no. 11, com Staphyloccocus epidermidis (ATCC 12228). Empregou-se 21 mL de meio como camada base e 4 mL de meio inoculado à 1% como camada superfície. As placas foram incubadas por 18 horas à 37 ± 1 °C. Os três delineamentos empregados apresentaram especiicidade adequada para análise de creme dermatológico e solução injetável contendo sulfato de gentamicina. Também apresentaram exatidão e linearidade no intervalo avaliado. Os delineamentos não apresentaram diferença signiicativa quanto a precisão. Os resultados foramcomparados através da determinação de índices de capacidade do sistema de medição. A analise estatística demonstrou que não há diferença signiicativa entre os resultados obtidos pelos delineamentos 5 x 1, 2 x 2 e 3 x 1, sendo equivalentes e intercambiáveis.
INTRODUCTION
The activity (potency) of antibiotics can be demons-trated under adequate conditions through their inhibitory effect over microbial growth. A reduction in the antimi-crobial activity can reveal subtle alterations that are not demonstrable through chemical methods (United States Pharmacopeia, 2006). Besides this, biological assays do not require specialized equipment or high toxicity solvents (Pinto et al., 2003b). The agar diffusion and turbidimetric are the two biological methods more commonly employed for antibiotic dosage.
The turbidimetric method depends on the growth inhibition of a microbial culture in an antibiotic uniform solution in luid medium, which must be favorable to a quick microbial growth in the absence of antibiotic. This method takes into account the relation between the pro-portion of growth of a microbial population in the liquid medium and the concentration of the assayed substance, being mostly used for vitamin and aminoacid dosage.
The agar diffusion method depends on the antibiotic diffusion through a layer of solidiied agar, in an extension that totally inhibits the growth of the microorganism in an area or zone around the reservoir containing antibiotic solution. In this assay the size of the inhibition zone and the dose of the substance assayed are correlated. This is the most widely employed method to determine the potency of antibiotics. The diffusion method employs inoculated solid culture medium, distributed in dishes, in a system of mono or double layers, through which the test-substance spreads. The test-solution is applied on the surface of this medium in a restricted area, being the dishes then incuba-ted: the microorganism growth occurs, respecting however the areas in which the antibiotic diffusion has occurred, generating contrast and resulting in the so-called growth inhibition zone. Such phenomenon originates all the theory that is the fundament of the diffusion method.
The oficial compendia and pharmacopoeias include antibiotic microbiological dosage assays. However, there is no consensus regarding the experimental designs. The balanced designs 3 x 3 and 2 x 2 are adopted by the Bra-zilian (Farmacopéia Brasileira, 1988) and British (British Pharmacopoeia, 2004) pharmacopoeias, whereas the Ame-rican (United States Pharmacopeia, 2006) pharmacopoeia presents 5 x 1 design for antibiotic dosage. The use of an adequate experimental design in relation to the criteria of linearity, precision, and accuracy of the analytical results is fundamental. It is highly advisable to adopt an experimental planning which, without further effort, supplies better re-sults and enables an indication respecting the assay validity. The number and nature of the samples, as well as the results
reliability level, are among the most important factors to be taken into account, in the selection of a design.
The 2 x 2 assay, known as symmetrical or balanced, is a simple and eficient design which employs two doses of the standard and two other of the sample, with identical ratio between the doses in both preparations. Each dish in-cludes all the four doses, in such a way that the number of replicas equals that of dishes (Knudsen, 1945a; Knudsen 1945b; Knudsen, Randall, 1945). The 5 x 1 assay, known as interpolation in standard curve assay, is a design with a standard curve of ive concentrations. Each dish includes two doses, in alternate positions, being one of the concen-trations in all the dishes a reference (central concentration of standard curve) and the other, one of the four standard concentrations, or the one corresponding to the sample dose with unknown potency (nominal dose equivalent to the standard reference) (Dart, 1966 United States Phar-macopeia, 2006). Both designs present advantages and disadvantages. The validation of the analytical method is always fundamental to guarantee the quality of results. Linearity, accuracy and precision are some of the most important parameters for analytical method validation.
We can, therefore, observe that the determination of antimicrobial potency is extremely important for the control and quality assurance concerning pharmaceutical preparations, being thus necessary to develop practical and economical procedures which can be applied in the validation and dosage of drugs (Marques, 1988; Yama-moto, 1994; 1996).
The association of the positive characteristics of 2 x 2 and 5 x 1 designs would probably be of considerable inte-rest, as it could improve validation parameters, generating safer and more reliable results. This fact not only makes the comparison between different types of designs justiia-ble, as proposed by this project, but also the development of an alternative design which gathers all the necessary characteristics for safe and reliable analytical results.
The need for conirmation in terms of medicaments therapeutic eficacy is a concerning issue. There are situ-ations in which the margin between the ineficient dose, under the therapeutic point of view, and a toxic dose is relatively small. Furthermore, even if the starting-point of the toxic dose is not reached, there is the economical aspect to be considered, as well as falsiication with structurally similar molecules (Cooper, 1963; Pinto et al., 2003b).
Gentamicin, the first isolated antibiotic from the
Micromonospora genera with therapeutic importance, has
States Pharmacopeia, 2006), respectively.
The association of 2 x 2 and 5 x 1 positive design characteristics would be considerably interesting, once it could improve the validation parameters, generating safer and more reliable results. The 3 x 1 design, proposed in this work, is an interpolation in the standard curve assay, which employs three doses of standard and one of sample, with nominal concentration equivalent to the standard median dose, including each dish all the preparations.
The aim of this work was to propose the use of 3 x 1 experimental design for gentamicin microbiological dosage and to compare speciicity, linearity, range, accu-racy, and precision characteristics to those of 2 x 2 and 5 x 1 experimental designs, commonly employed in genta-micin microbiological dosage in different pharmaceutical preparations.
MATERIALS AND METHODS
Assay Method
Twenty seven samples of raw material were eva-luated, as well as injectable solution and dermatological cream containing gentamicin sulphate. Each sample was assayed in 3 replicas using 2 x 2, 5 x 1, and 3 x 1 designs, in a total of 243 assays.
The standard solutions and samples were prepared using 0.1 M pH 8.0 phosphate buffer as diluent. The concentrations used for 2 x 2 design were 2.0 µg/mL (P1 and A1) and 4.0 µg/mL (P2 and A2). For 5 x 1 design the concentrations were 1.3 µg/mL (P1), 1.6 µg/mL (P2), 2.0 µg mL (P3), 2.5 µg/mL (P4), and 3.1 µg/mL (P5) for standard, and 2.0 µg/mL (A) for the sample. As for 3 x 1 design the following concentrations were employed: 1.0 µg/mL (P1), 2.0 µg/mL (P2), and 4.0 µg/mL (P3) for standard, and 2.0 µg/mL (A) for the sample. The dishes were prepared with 21 mL of antibiotic medium no 11.
After the base layer solidiication 4 ml of no11 antibiotic
medium inoculated with Staphylococcus epidermidis (ATCC 12228) were added in a 1% proportion. Paper discs (Schleicher and Schuell®), with a diameter of 12.7
mm, previously immersed in standard or sample solutions and having had the volume excess removed according to standards, were distributed in accordance with the expe-rimental design employed.
The dishes were incubated in a Nova Ética (Mod. 411 D) incubator for 18 hours at 37 ± 1 oC. After incubation
the diameters of the inhibition halos were measured in millimeters with the help of an Eli Lilly Antibiotic Zone Re-ader®. The results were then recorded and the calculations
made according to the experimental design employed.
2 x 2 Design
In this assay, each dish includes all the doses, being the unknown low and high standard and sample potencies distributed in opposed positions. Figure 1 indicates the disposition of paper discs (Schleicher and
Schuell®) in each Petri dish. For each sample assayed
by means of 2 x 2 experimental design, 6 dishes were employed.
The results obtained in this assay were calculated according to Hewitt (1977), as shown in the equations below. Each assay was evaluated through variance analysis (ANOVA) as to regression and parallelism, to guarantee the validity of the test.
Where: A1, A2, P1 and P2 are the means of diameters of the inhibition halos for low-dose sample solution, high-dose sample solution, low-dose standard solution and high-dose standard solution, respectively; M is the potency estimation and 2 is the dose ratio.
5 x 1 Design
In this assay, each dish contains two doses in alter-nate position, being one of the concentrations in all the dishes a reference (central concentration of the standard curve), while the other, one of the standard four con-centrations or the dose of the unknown potency sample (nominal dose equivalent to standard reference). Figure 2 indicates the disposition of the paper discs (Schleicher
and Schuell®) on each Petri dish. Sixteen dishes were
employed in the standard curve and four in each sample assayed by means of experimental design 5 x 1.
the purpose of assay validation, each standard curve was evaluated, through variance analysis, as to linearity and regression.
Where: P1, P2, P3, P4 and P5 are the means of diameters of the inhibition halos for standards solutions; A is the mean of diameters of inhibition halos for sample solution; M is the potency estimation and 1.25 is the dose ratio.
3 x 1 Design
In this assay, each dish includes all the doses, having the median standard dose and the dose of the unknown potency sample been distributed in opposed positions. Figure 3 indicates the disposition of the paper discs (Schleicher and Schuell®) on each Petri dish. Six
dishes were employed for each sample assayed through 3 x 1 experimental design (Lourenço, Pinto, 2007a; Lourenço, Pinto, 2007b; Pinto et al., 2007).
The results of these assays were calculated as sho-wn in the equations above. Each assay was evaluated, through variance analysis, as to linearity and regression in order to guarantee the test validity.
Where: A, P1, P2 and P3 are the means of diame-ters of the inhibition halos for sample solution, low-dose standard solution, median-low-dose standard solution and high-dose standard solution, respectively; M is the potency estimation and 2 is the dose ratio.
Method Validation
The experimental designs employed in gentamicin microbiological dosage were evaluated as to speciicity, accuracy, precision, linearity, and range (ICH, 1996; Bra-sil, 2002; Inmetro, 2003; Pinto el al., 2003a).
Speciicity was evaluated by means of the compari-son of the diameters of the haloes obtained from gentami-cin solution and gentamigentami-cin solution with the excipients of the dosage form evaluated. The haloes diameters were compared as to dispersion, using F-Snedecor test, and position, using t-Student test (Inmetro, 2003; Beiguelman, 2002; Calleguri-Jacques, 2003).
FIGURE 3 - Disposition of paper discs in each Petri plate for 3x1 design.
Accuracy was evaluated in relation to ixed tendency and relative tendency and was determined through linear regression analysis, by plotting theoretical concentrations
versus experimentally determined concentrations. The
straight line equation, concerning the accuracy of each experimental design, was estimated through 81 experi-mental determinations in three levels of concentration (70%, 100%, and 130% of the reference dose) in raw material, injectable solution and dermatological cream. It has been concluded that the methods are accurate, that is, they do not present ixed or relative tendency when the reliability intervals for linear and angular coeficients in-clude, respectively, values 0 and 1 (Caulcutt, Boddy, 1982; Beiguelman, 2002; Calleguri-Jacques, 2003).
Precision was evaluated through the standard devia-tion determined from 81 experimental determinadevia-tions in three concentration levels (70%, 100%, and 130% of the reference dose) in raw material, injectable solution, and dermatological cream. The designs were compared as to precision through Bartlett and Levene tests. It was also evaluated if precision is associated with concentration through linear regression analysis, by plotting relative standard deviation versus concentration. This resulted in the veriication that precision is not associated to concen-tration when the angular coeficient reliability interval includes value 0 (Caulcutt, Boddy, 1982; Beiguelman, 2002; Calleguri-Jacques, 2003).
Linearity was evaluated through linear regression analysis by correlation coeficient and the regression sig-niicance. It was veriied that the methods present linearity when the correlation coeficient (r) is bigger or equal to 0.90 and the regression significance is inferior to 0.01 (Caulcutt, Boddy, 1982; Beiguelman, 2002; Calleguri-Jacques, 2003).
RE 899 resolution (Brasil, 2002), states that the recommended range for methodology of analytical quan-titative determination in raw materials or dosage forms varies from 80% to 120% of the theoretical concentration. However, the speciication for gentamicin, in the form of dermatological cream, described in USP 29 (United States Pharmacopeia, 2006), varies from 90% to 130% of the theoretical concentration. Thus the evaluation of the range was performed from 70% to 130% of the theo-retical concentration. The interval was established by the conirmation that the method shows adequate accuracy, precision, and linearity.
Comparison of different designs
The comparisons of the designs were performed by determining the measurement system capacity rates
(Mon-tgomery, 2004). The latter were estimated by the ratio between the amplitude of the results under a determined condition and the linear range of the method employed (70% to 130% of the theoretical concentration). The rates evaluate the inluence of the difference of the design in relation to the method application (Montgomery, 2004).
There is no signiicant inluence of the type of design employed for values inferior to 10%, being the methods interchangeable. For values between 10% and 30% there is small inluence, but still acceptable. When the values ex-ceeded 30% the inluence of the type of design employed was considered great, thus being impossible to ensure the methods interchange (Montgomery, 2004).
RESULTS AND DISCUSSION
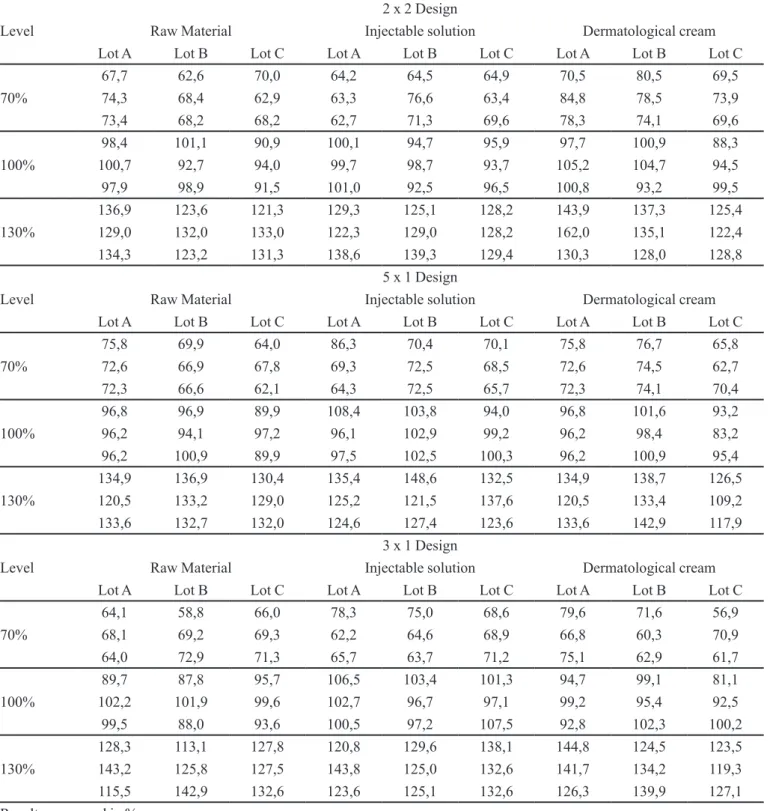
The results of gentamicin microbiological dosage of raw material, injectable solutions and dermatological creams through 2 x 2, 5 x 1, and 3 x 1 designs are in Table I. The assays of 2 x 2 design were considered valid as to the regression signiicance (p <0.01) and parallelism (p >0.05). 5 x 1 design curves were considered valid as to linearity (r >0.90) and regression signiicance (p <0.01). The results obtained through 3 x 1 design were considered valid as to linearity (r >0.90) and regression signiicance (p <0.01).
In what concerns validation, 2 x 2, 5 x 1, and 3 x 1 experimental designs presented speciicity, accuracy, precision, linearity, and range adequate to the application of the methods.
The methods showed adequate speciicity relatively to the injectable solution and the dermatological cream containing gentamicin sulphate.
Snedecor F tests demonstrated that there was no signiicant effect of the matrix as to the precision of the res-ponses obtained. Student t tests demonstrated the absence of the matrix effect relatively to the injectable solution and the dermatological cream containing gentamicin sulphate. It has been thus guaranteed that the response obtained (inhibition halos diameter) is associated to the amount of gentamicin in the formulation.
The methods were considered accurate when the reliability intervals of linear and angular coeficients inclu-de, respectively, values 1 and 0. None of the three designs showed ixed or absolute tendency and relative tendency, not being necessary to employ any kind of correction or adjustment of the results obtained.
TABLE I - Results of 27 samples evaluated through 2 x 2, 5 x 1, and 3 x 1 designs
Level
2 x 2 Design
Raw Material Injectable solution Dermatological cream
Lot A Lot B Lot C Lot A Lot B Lot C Lot A Lot B Lot C
70%
67,7 62,6 70,0 64,2 64,5 64,9 70,5 80,5 69,5
74,3 68,4 62,9 63,3 76,6 63,4 84,8 78,5 73,9
73,4 68,2 68,2 62,7 71,3 69,6 78,3 74,1 69,6
100%
98,4 101,1 90,9 100,1 94,7 95,9 97,7 100,9 88,3
100,7 92,7 94,0 99,7 98,7 93,7 105,2 104,7 94,5
97,9 98,9 91,5 101,0 92,5 96,5 100,8 93,2 99,5
130%
136,9 123,6 121,3 129,3 125,1 128,2 143,9 137,3 125,4
129,0 132,0 133,0 122,3 129,0 128,2 162,0 135,1 122,4
134,3 123,2 131,3 138,6 139,3 129,4 130,3 128,0 128,8
Level
5 x 1 Design
Raw Material Injectable solution Dermatological cream
Lot A Lot B Lot C Lot A Lot B Lot C Lot A Lot B Lot C
70%
75,8 69,9 64,0 86,3 70,4 70,1 75,8 76,7 65,8
72,6 66,9 67,8 69,3 72,5 68,5 72,6 74,5 62,7
72,3 66,6 62,1 64,3 72,5 65,7 72,3 74,1 70,4
100%
96,8 96,9 89,9 108,4 103,8 94,0 96,8 101,6 93,2
96,2 94,1 97,2 96,1 102,9 99,2 96,2 98,4 83,2
96,2 100,9 89,9 97,5 102,5 100,3 96,2 100,9 95,4
130%
134,9 136,9 130,4 135,4 148,6 132,5 134,9 138,7 126,5
120,5 133,2 129,0 125,2 121,5 137,6 120,5 133,4 109,2
133,6 132,7 132,0 124,6 127,4 123,6 133,6 142,9 117,9
Level
3 x 1 Design
Raw Material Injectable solution Dermatological cream
Lot A Lot B Lot C Lot A Lot B Lot C Lot A Lot B Lot C
70%
64,1 58,8 66,0 78,3 75,0 68,6 79,6 71,6 56,9
68,1 69,2 69,3 62,2 64,6 68,9 66,8 60,3 70,9
64,0 72,9 71,3 65,7 63,7 71,2 75,1 62,9 61,7
100%
89,7 87,8 95,7 106,5 103,4 101,3 94,7 99,1 81,1
102,2 101,9 99,6 102,7 96,7 97,1 99,2 95,4 92,5
99,5 88,0 93,6 100,5 97,2 107,5 92,8 102,3 100,2
130%
128,3 113,1 127,8 120,8 129,6 138,1 144,8 124,5 123,5
143,2 125,8 127,5 143,8 125,0 132,6 141,7 134,2 119,3
115,5 142,9 132,6 123,6 125,1 132,6 126,3 139,9 127,1
Results expressed in %.
design. Bartlett and Levene tests indicated that there is no signiicant difference of precision in the designs evaluated. It has also been veriied that precision is not associated to concentration when the angular coeficient reliability interval includes valueThe results demonstrated that there is linear association between the inhibition halos diameter and the
inluence of the evaluated factor for values under 10%. When the latter range between 10% and 30% there is little inluence, yet still acceptable. When values exceeded 30% the inluence veriied was great. The results demonstrated that the evaluated factors do not present signiicant in-luence on the methods application range (70% to 130% of the theoretical concentration). This implies that the differences found among the results obtained in different concentrations (designs, types of samples, concentration levels, and preparation lots) were not signiicant when compared to the methods application range.
The effect graphs (Figure 4) indicate the differences among the varied conditions evaluated relatively to the methods application range.
All the designs of the microbiological method pre-sented adequate speciicity in the analysis of injectable solution and dermatological cream containing gentamicin sulphate. The statistical tests demonstrated absence of matrix effect. 3 x 1 design showed adequate accuracy, not revealing ixed and relative tendencies in the evaluation of gentamicin sulphate raw material, injectable solution, and dermatological cream containing gentamicin, what was also veriied in 2 x 2 and 5 x 1 designs. There is therefore no need to correct the results obtained by the methods studied. 3 x 1 design showed adequate precision in the
evaluation of gentamicin sulphate raw material, injectable solution, and dermatological cream containing gentamicin, not presenting signiicant difference relatively to 2 x 2 and 5 x 1 designs. The values of relative standard deviation for 2 x 2, 5 x 1, and 3 x 1 designs were, respectively, 6.8%, 7.1%, and 6.4%. The statistical evaluation showed that there is no association between the method precision and the concentration of gentamicin in the samples evaluated, what proves the homoscedasticity of the method, which presented signiicant regression and satisfactory linearity in the studied range of 1.0 µg/ml to 4.0µg/ml. The method application range was 70% to 130% of the theoretical concentration.
The designs studied were equivalent in the eva-luation of gentamicin sulphate raw material, injectable solution, and dermatological cream containing gentamicin. The differences found among the results obtained in diffe-rent conditions (designs, types of samples, concentration levels, and preparation lots) were insignificant when compared to the method application range.
The 2 x 2 assay is recommendable for research and development, as it supplies information about the regres-sion signiicance and parallelism between the standard curve and the sample, what permits the evaluation of the test validity. The 5 x 1 assay proved to be appropriate for routine analysis in quality control laboratories, as it makes the simultaneous evaluation of a high number of samples possible. However, the necessity of correction makes cal-culations complicated and more susceptible to mistakes. The 3 x 1 showed adequacy for routine analysis in quality control laboratories, as it simpliies the test execution and the potency calculation, besides offering advantages in terms of low cost and the material involved.
The proposed design can be applied to other antibio-tics dosage. It is only necessary to evaluate the regression signiicance and the linearity of the curve employed.
REFERENCES
BEIGUELMAN, B. Curso prático de bioestatística. 5.ed. Ribeirão Preto: FUNPEC, 2002. p.1-35, 117-263.
BRASIL, Resolução RE no. 899 de 29 de maio de 2003. Diário Oicial da União, Brasília, 02 de junho de 2003. Determina a publicação do “Guia para validação de métodos analíticos e bioanalíticos”; ica revogada a Resolução RE nº 475, de 19 de março de 2002. Available at: <http://e-legis.anvisa.gov.br/ leisref/public/showAct.php?id=15132&word=Valida%c3%a 7%c3%a3o>. Accessed on: 7th oct. 2004.
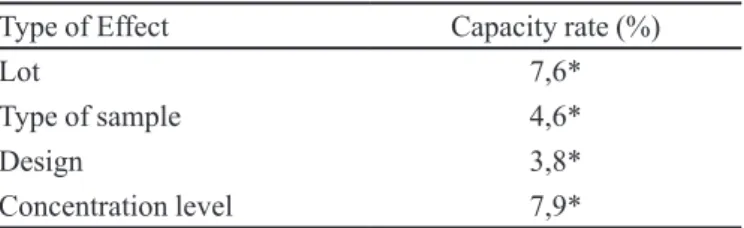
TABLE II - Capacity rates of the effects of different lots, types of samples, designs, and concentration levels.
Type of Effect Capacity rate (%)
Lot 7,6*
Type of sample 4,6*
Design 3,8*
Concentration level 7,9*
* There is no signiicant inluence.
BRITISH pharmacopoeia. London: Her Majesty’s Stationery Ofice, 2004. v.4, Appendix XIV A A279-A285.
CALLEGARI-JACQUES, S.M. Bioestatística: princípios e
aplicações. Porto Alegre: Artmed, 2003. p. 19-105, 153-164.
CAMPOS, L.M.M.; SCHAPOVAL, E.E.S. Controle de qualidade de produtos farmacêuticos contendo gentamicina. An. Farm. Quím. S. Paulo, v.22, n.1-2, p.27-33, 1982.
CAULCUTT, R., BODDY, R. Statistics for analytical chemists. London: Chapman & Hall, 1983. 253 p.
COOPER, K.E. The theory of antibiotics inhibition zones. In: KAVANAGH, F., (Ed.). Analytical microbiology. New York: Academic Press, 1963. v.1, p.1-83.
DART, R.K. Microbiology for the analytical chemist. Cambrigde: The Royal Society of Chemistry, 1966. p.133-149.
FARMACOPÉIA BRASILEIRA. 4.ed. São Paulo: Atheneu, 1988. pt.1, p.V.5.2.17-V.5.2.17-15.
HEWITT, W. Microbiologycal assay. Orlando: Academic Press, 1977. p.17-68,136-150, 214-242.
INMETRO. Instituto Nacional de Metrologia, Normalização
e Qualidade Industrial – DOQ-CGCRE-008 Revisão 01 –
Março/2003 – Orientações sobre validação de métodos de ensaios químicos. Rio de Janeiro, 2003. 35 p.
KNUDSEN, L.F. Penicillin assay. Science, v.101, n.2611, p.46-48, 1945.
KNUDSEN, L.F. The use of statistics in biological experimentation and assay. J. Assoc. Off. Agric. Chem., v.28, n.4, p.806-813, 1945.
KNUDSEN, L.F., RANDALL, W.A. Penicillin assay and its control chart analysis. J. Bacteriol., v.50, n.2, p.187-200, 1945.
LOURENÇO, F. R.; PINTO, T. J. A. Doseamento microbiológico de gentamicina - Um novo delineamento experimental. Rev. Bio Farma -Rev. Téc. Cient. Farm. Bioquím. Anál. Clín. Toxicol., v.2, n.4, p.305-310, 2007.
LOURENÇO, F. R.; PINTO, T. J. A. Comparison of three experimental designs employed in gentamicin microbiological assay through agar diffusion. In: WORLD CONGRESS OF PHARMACY AND PHARMACEUTICAL SCIENCES 2007 - CONGRESS OF FIP, 67., 2007. Abstracts. Beijing, 2007. v.1. p.171-171.
MARQUES, M.R.C., HACKMANN, E.R.M., SAITO, T. Doseamento microbiológico de neomicina: influência do volume de meio de cultura. Rev. Farm. Bioquím. Univ. S. Paulo, v.24, n.1, p.12-18, 1988.
MONTGOMERY, D.C. Análise da capacidade de processos e sistemas de medida. In: MONTGOMERY, D.C., (Ed.).
Introdução ao controle estatístico da qualidade. Rio de Janeiro: LTC, 2004. p. 220-252.
ODEN, E.M.; WAGMAN, G.H.; WEINSTEIN, M.J. Gentamycin. In: KAVANAGH, F., ed. Analytical Microbiology. New York: Academic Press, 1972. v. 2, p. 271-284.
PINTO, T.J.A., FERRARINI, M., GATTI, R.M. Proposta de roteiro prático para a validação de métodos analíticos. Farm. & Quím., v.36, n.1, p.26-36, 2003
PINTO, T.J.A., KANEKO, T.M., OHARA, M.T. Controle
biológico de qualidade de produtos farmacêuticos, correlatos e cosméticos. 2.ed. São Paulo: Atheneu, 2003. p.7-56, 261-287.
PINTO, T. J. A.; LOURENÇO, F. R.; KANEKO, T. M. Microbiological assay of gentamycin employing an alternative experimental design. In: AOAC ANNUAL MEETING & EXPOSITION, 121., 2007. Anais. Anahein-Califórnia, 2007. v. 1. p. 157-157.
PROCEEDINGS OF THE INTERNATIONAL CONFERENCE ON HARMONISATION (ICH). Commission of the European Communities. Validation analytical procedures. [s.l.], [s.n.], 1996. 17 p.
UNITED STATES PHARMACOPEIA. 29.ed. Rockville: The United States Pharmacopeia Convention, 2006. p. 2513-2520.
YAMAMOTO, C.H. Dosagem microbiológica de neomicina
por difusão em Agar. Redução do tempo de análise pela aplicação do cloreto de trifeniltetrazolio. São Paulo, 1994, 169p. [Dissertação de mestrado. Faculdade de Ciências Farmacêuticas. Universidade de São Paulo].
YAMAMOTO, C.H., PINTO, T.J.A. Rapid determination of neomycin by a microbiological agar diffusion assay using triphenyltetrazolium chloride. J. Assoc. Off. Anal. Chem., v.79, n.2, p.434-440, 1996.
Received for publication on 12th November 2007