ACPD
13, 14667–14693, 2013Formation conditions for
aerodynamic contrails
K. Gierens and F. Dilger
Title Page
Abstract Introduction
Conclusions References
Tables Figures
◭ ◮
◭ ◮
Back Close
Full Screen / Esc
Printer-friendly Version Interactive Discussion
Discussion
P
a
per
|
Dis
cussion
P
a
per
|
Discussion
P
a
per
|
Discussio
n
P
a
per
|
Atmos. Chem. Phys. Discuss., 13, 14667–14693, 2013 www.atmos-chem-phys-discuss.net/13/14667/2013/ doi:10.5194/acpd-13-14667-2013
© Author(s) 2013. CC Attribution 3.0 License.
Atmospheric Chemistry and Physics
Open Access
Discussions
Geoscientiic Geoscientiic
Geoscientiic Geoscientiic
This discussion paper is/has been under review for the journal Atmospheric Chemistry and Physics (ACP). Please refer to the corresponding final paper in ACP if available.
A climatology of formation conditions for
aerodynamic contrails
K. Gierens and F. Dilger
Deutsches Zentrum für Luft- und Raumfahrt, Institut für Physik der Atmosphäre,
Oberpfaffenhofen, Germany
Received: 30 April 2013 – Accepted: 19 May 2013 – Published: 5 June 2013
Correspondence to: K. Gierens ([email protected])
ACPD
13, 14667–14693, 2013Formation conditions for
aerodynamic contrails
K. Gierens and F. Dilger
Title Page
Abstract Introduction
Conclusions References
Tables Figures
◭ ◮
◭ ◮
Back Close
Full Screen / Esc
Printer-friendly Version Interactive Discussion
Discussion
P
a
per
|
Dis
cussion
P
a
per
|
Discussion
P
a
per
|
Discussio
n
P
a
per
Abstract
Aerodynamic contrails are defined in this paper as line shaped ice clouds caused by aerodynamically triggered cooling over the wings of an aircraft in cruise which become visible immediately at the trailing edge of the wing or close to it. Effects at low alti-tudes like condensation to liquid droplets and their potential heterogeneous freezing
5
are excluded from our definition. We study atmospheric conditions that allow formation of aerodynamic contrails. These conditions are stated and then applied to atmospheric data, first to a special case where an aerodynamic contrail was actually observed and then to a full year of global reanalysis data. We show where, when (seasonal variation), and how frequently (probability) aerodynamic contrails can form, and how this relates
10
to actual patterns of air traffic. We study the formation of persistent aerodynamic con-trails as well. Finally we check whether aerodynamic and exhaust concon-trails can coexist in the atmosphere. We show that visible aerodynamic contrails are possible only in an altitude range between roughly 540 and 250 hPa, and that the ambient temperature is the most important parameter, not the relative humidity. Finally we give an argument
15
for our believe thatcurrentlyaerodynamic contrails have a much smaller climate effect than exhaust contrails, which may however change in future with more air traffic in the tropics.
1 Introduction
When air flows around the wings of an aircraft it is accelerated, and because of
conser-20
vation of total enthalpy (the sum of kinetic energy and enthalpy) it cools as the flow gets faster. This cooling implies the rising of the relative humidity of the air, an effect that is quite strong at aviation cruise levels, such that condensation and freezing can occur even in relatively dry (say RHi≈20 %) ambient air (Gierens et al., 2009). If this hap-pens even in ice (super) saturated air the formed ice crystals stay in the atmosphere
25
ACPD
13, 14667–14693, 2013Formation conditions for
aerodynamic contrails
K. Gierens and F. Dilger
Title Page
Abstract Introduction
Conclusions References
Tables Figures
◭ ◮
◭ ◮
Back Close
Full Screen / Esc
Printer-friendly Version Interactive Discussion
Discussion
P
a
per
|
Dis
cussion
P
a
per
|
Discussion
P
a
per
|
Discussio
n
P
a
per
|
a visible effect directly behind the aircraft then there is an aerodynamic contrail (in the following occasionally abbreviated as AerC) which can be distinguished from exhaust contrails once it causes pretty iridescence effects (Gierens et al., 2011).
Although air is always cooling in this way once it flows around an aircraft wing and although the effect on relative humidity is quite strong at cruise levels, occurrences
5
of aerodynamic contrails are rarely reported, at least compared to exhaust contrails. There are several reasons for this. First, it is hard to distinguish the two types of con-trails for an observer at ground because iridescence effects occur only when the view-ing angle between the sun and the contrail is relatively small (less than 30◦). The exact point of onset of the contrail is hard to see from ground (at the wing: aerodynamic,
10
at or behind the aircraft tail: exhaust contrail). Second, the ice crystals once formed must grow to a size comparable to the wavelength of light (350 to 700 nm) and this re-quires that the air has sufficient water vapour concentration. Since the latter decreases roughly exponentially with altitude throughout the troposphere it is often too dry at the higher cruise levels to form a visible aerodynamic contrail (Kärcher et al., 2009). Third,
15
at lower cruise levels, if it is too warm, the condensation over the wing might not be followed by freezing, and the tiny droplets will immediately evaporate once the air tem-perature relaxes back to its ambient value after the passage of the aircraft. Contrary to ice crystals which can survive and grow in ice supersaturated but otherwise clear air, water droplets would only survive in water saturated air which is never clear but always
20
a cloud. Thus aerodynamic droplet formation (without freezing) with stable droplets could only happen within water clouds and thus remain invisible to the human eye. There may be other effects (e.g. higher droplet number concentration, similar to ship tracks) that might be detectable for suitable instruments, but such effects, if they exist at all, should not be labelled aerodynamic contrails. Fourth, in situations where
aero-25
dynamic and exhaust contrails coexist, the aerodynamic contrail can hardly be seen since it is usually too faint against the exhaust contrail.
Thus we use the following working definition of aerodynamic contrails in the present
aerodynami-ACPD
13, 14667–14693, 2013Formation conditions for
aerodynamic contrails
K. Gierens and F. Dilger
Title Page
Abstract Introduction
Conclusions References
Tables Figures
◭ ◮
◭ ◮
Back Close
Full Screen / Esc
Printer-friendly Version Interactive Discussion
Discussion
P
a
per
|
Dis
cussion
P
a
per
|
Discussion
P
a
per
|
Discussio
n
P
a
per
cally triggered cooling over the wings of an aircraft in cruise. They are visible immedi-ately at the trailing edge of the wing or close to it.This definition serves two purposes: first, ice clouds that cannot without be traced back back to an aerodynamic effect are excluded. For instance, an invisible aerodynamic contrail can become visible later when it gets into an uplifting airmass. This is not an aerodynamic contrail according to our
def-5
inition. Second, a variety of aerodynamically triggered condensation effects occurs at low levels in the atmosphere, but we do not call them aerodynamic contrails since they consist probably of liquid water and the word contrail usually implies a phenomenon occuring on cruise levels. For practical reasons we will also exclude ice clouds formed by heterogeneous freezing at temperatures above the supercooling limit of liquid water,
10
T >235 K. First, heterogeneous freezing leads to relatively low crystal concentrations
which may often not suffice for visibility. Second, it is not clear whether and when a heterogenous freezing process would be quick enough such that an ice cloud could appear close to the aircraft wing.
Obviously, aerodynamic contrail formation requires special states in the atmosphere
15
and in this paper we will study where, when, and how frequent such appropriate condi-tions obtain. This is a necessary step towards assessment of the role of aerodynamic contrails in climate.
2 Atmospheric conditions for aerodynamic contrails
The ice crystals that constitute an aerodynamic contrail form from liquid aerosol
parti-20
cles that exist in copious numbers in the atmosphere. If the airflow around an airfoil is cooled to at least the supercooling limit for pure water, i.e. 235 K or−38◦C, then the liquid aerosol droplets can freeze, and the ice crystals formed can remain in the atmo-sphere for a while when the air is ice–supersaturated. Aerodynamic contrail formation happens but does not lead to a visible contrail if the ambient air is colder than 230 K
25
ACPD
13, 14667–14693, 2013Formation conditions for
aerodynamic contrails
K. Gierens and F. Dilger
Title Page
Abstract Introduction
Conclusions References
Tables Figures
◭ ◮
◭ ◮
Back Close
Full Screen / Esc
Printer-friendly Version Interactive Discussion
Discussion
P
a
per
|
Dis
cussion
P
a
per
|
Discussion
P
a
per
|
Discussio
n
P
a
per
|
Thus the minimum temperature at which visible aerodynamic contrails can be formed is 230 K and we have to determine the maximum temperature as that temperature at which the cooling over the wings suffices to bring the temperature below the super-cooling limit of pure water, 235 K. This maximum temperature depends on the ambient
pressure p and the pressure drop ∆p caused by the wing. This latter quantity can
5
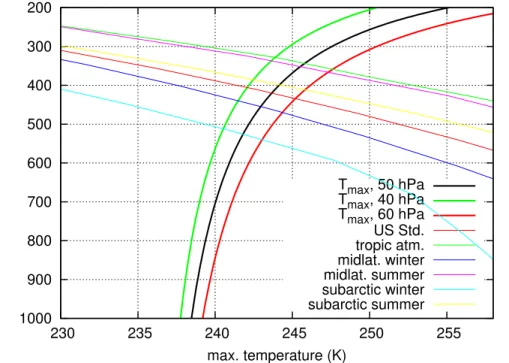
simply be calculated as an average over the wings by dividing the aircraft weight by its wing area. It turns out that −50 hPa is a typical value for a wide range of aircraft (see Fig. 1), but in order to see the sensitivity of the maximum temperature on∆p we will consider a range of−40 to −60 hPa. Since the flow is adiabatic, temperature and pressure variations are connected via Poisson’s laws, and we get:
10
Tmax(p,∆p)=235 K
1+∆p
p
1−γγ
. (1)
γ=cp/cV =1.4 is the adiabatic coefficient of air. Figure 2 shows the maximum
tem-perature as a function of air pressure for three values of the pressure drop over the wing. Additionally it shows temperature profiles for various standard atmospheres. Let us make an example. At the 700 hPa level it needs an ambient temperature of less than
15
240±1 K to form an aerodynamic contrail. However, typically the atmosphere is much warmer than this on that level, even the subarctic winter temperature is more than 10 K too warm on 700 hPa. Only when the ambient pressure is below approximately 540 hPa (i.e. where the two bundles of curves start to cross each other) aerodynamic contrails are possible. The warmest standard atmosphere (i.e. the tropical one) reaches the
20
minimum temperature of 230 K at about 250 hPa. Thus we can state that aerodynamic contrails are possible between pressure levels of about 250 and 540 hPa. The ambient temperature will rarely be higher than 247.5 K, the temperature where the maximum temperature curve for−60 hPa pressure drop intersects the tropical temperature pro-file.
25
Eu-ACPD
13, 14667–14693, 2013Formation conditions for
aerodynamic contrails
K. Gierens and F. Dilger
Title Page
Abstract Introduction
Conclusions References
Tables Figures
◭ ◮
◭ ◮
Back Close
Full Screen / Esc
Printer-friendly Version Interactive Discussion
Discussion
P
a
per
|
Dis
cussion
P
a
per
|
Discussion
P
a
per
|
Discussio
n
P
a
per
rope. An aerodynamic contrail was observed and photographed on that day over the is-land Norderney in northern Germany (Gierens et al., 2011). The data have been taken from the European Centre for Medium-Range Weather Forecasts (ECMWF) ERA In-terim reanalysis (24 h forecast initialised at 26 June 2008 12:00 UTC, spatial resolution 0.5◦×0.5◦, standard pressure levels 250 to 500 hPa). On the 250 hPa level it is too cold
5
for visible aerodynamic contrails to form over large parts of Europe. Only in the south, that is, over the Mediterranean and northern Africa it is warm enough. Over northern Europe there are confined regions with temperatures higher than 230 K. Whether aero-dynamic contrail formation is possible there depends on whether this is tropospheric or stratospheric air; stratospheric air is possibly too dry to form visible aerodynamic
con-10
trails, independent of temperature (not yet tested). As the radiosonde Emden shows the thermal tropopause at 250 hPa (see Gierens et al., 2011), these warm patches over northern Europe may well be stratospheric air. By following the pressure levels from 250 to 500 hPa we observe that the regions where aerodynamic contrails can form first extend from south to north, on 350 hPa most of the atmosphere over Europe
15
can serve as an aerodynamic contrail formation region, but further below it is getting
too warm from the south, on 400 hPa only northern Europe (north of 53◦N) can see
an aerodynamic contrail, and still further below this region shrinks until the formation of aerodynamic contrails is impossible everywhere on 500 hPa. At least for this spe-cial situation we have in some regions where aerodynamic contrails can form also ice
20
supersaturated conditions such that ice formed aerodynamically can remain in the at-mosphere without immediate sublimation after the passage of an aircraft. However, where we have ice supersaturation we have clouds as well, so the visibility of any per-sistent aerodynamic contrail is questionable and its effect on the local radiation balance probably low.
25
ACPD
13, 14667–14693, 2013Formation conditions for
aerodynamic contrails
K. Gierens and F. Dilger
Title Page
Abstract Introduction
Conclusions References
Tables Figures
◭ ◮
◭ ◮
Back Close
Full Screen / Esc
Printer-friendly Version Interactive Discussion
Discussion
P
a
per
|
Dis
cussion
P
a
per
|
Discussion
P
a
per
|
Discussio
n
P
a
per
|
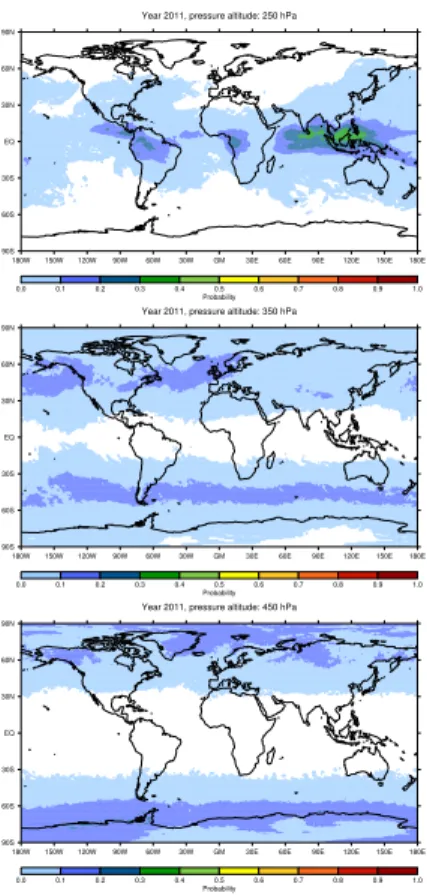
3 Climatology for the year 2011
3.1 Annual mean
Again we use data from the ERA interim reanalysis for the set-up of a climatology. We use global+24 h forecast data for the year 2011 in a horizontal resolution of 1◦×1◦. We prefer the forecasts relative to the analyses, because a quick comparison using
5
ten days in June 2011 showed that problems with supersaturation spin-up (Lamquin et al., 2009) are mitigated but seem not completely overcome. We consider 3 pressure levels sufficient and choose 250, 350, and 450 hPa. Using these data, we will study annual and seasonal distributions of regions where aerodynamic contrails can form for the year 2011.
10
The data analysis behind Fig. 4 includes only the temperature criteria, that is, it is not colder than 230 K and sufficiently cold that the temperature over the wings drops be-low 235 K. Ice supersaturation and cloudiness conditions are not considered in Fig. 4, these considerations follow below. However, we have checked that the ambient rela-tive humidity is everywhere sufficient that in the airflow over a wing the threshold for
15
homogeneous nucleation is reached. For this threshold we use the following formula (Kärcher and Lohmann, 2002):
Scrit=2.583−Twing/207.83
whereTwingis the temperature of the airflow over the wing. It turned out that the condi-tionSwing≥Scrit is always fulfilled. The saturation ratio over the wing is computed from
20
that in the ambient airSambwith:
Swing=Samb
Twing
Tamb
!cp/Ra
e∗(Tamb)
e∗(T
wing) .
ACPD
13, 14667–14693, 2013Formation conditions for
aerodynamic contrails
K. Gierens and F. Dilger
Title Page
Abstract Introduction
Conclusions References
Tables Figures
◭ ◮
◭ ◮
Back Close
Full Screen / Esc
Printer-friendly Version Interactive Discussion
Discussion
P
a
per
|
Dis
cussion
P
a
per
|
Discussion
P
a
per
|
Discussio
n
P
a
per
There is a general tendency of regions where aerodynamic contrails can form to shift from the tropics to polar regions with decreasing flight altitude (increasing pres-sure). Aerodynamic contrails form with higher than 50 % probability only in the tropical belt on the 250 hPa level (FL 340), roughly between 30◦S and 30◦N. The transition to lower than 10 % probability is rather sharp at these latitudes, caused by the poleward
5
temperature decrease at the subtropical tropopause discontinuity. The temperatures at the lower flight levels 350 hPa (FL 260 and lower) in the tropical belt allow almost no aerodynamic contrails to form; the temperature is usually too high there such that it will not drop below 235 K over an aircraft wing. North and south of the subtropics (±30◦) aerodynamic contrails can form on pressure levels 350 hPa and below, and at 450 hPa
10
this region is even confined to the polar zones north and south of±45◦. The probability values are quite high for the 250 hPa level in the tropics, mostly exceeding 80 %. Such high probabilities are also present at several locations in the northern extratropics on the 350 hPa pressure level, seemingly connected but east of the Atlantic and Pacific storm tracks, while otherwise and on the 450 hPa level the probabilities are generally
15
lower than 60 %. In the Southern Hemisphere, on the contrary, high probabilities occur on both lower pressure levels through all longitudes, and values lower than 50 % are only present over Antarctica. The latter is, however, merely an academic result since there is hardly any aviation in the southern extratropics.
Looking back at Fig. 1 it seems that the standard flight altitudes of 8 of the most
20
common aircraft are above the maximum altitude where aerodynamic contrails be-come visible. Only two of the ten aircraft are usually at an appropriate flight level, but these have lower pressure difference, around −30 hPa. If this smaller pressure diff er-ence were typical for the formation of aerodynamic contrails instead of our standard
as-sumption of−50 hPa, then the maximum temperature at which aerodynamic contrails
25
ACPD
13, 14667–14693, 2013Formation conditions for
aerodynamic contrails
K. Gierens and F. Dilger
Title Page
Abstract Introduction
Conclusions References
Tables Figures
◭ ◮
◭ ◮
Back Close
Full Screen / Esc
Printer-friendly Version Interactive Discussion
Discussion
P
a
per
|
Dis
cussion
P
a
per
|
Discussion
P
a
per
|
Discussio
n
P
a
per
|
aerodynamic contrail formation are decreased in many locations by about 0.1. Yet the patterns on the maps are very similar to those in Fig. 4. As a quick check of the next ten aircraft in the BADA data base reveals that only a small fraction of important air-craft have indeed this low pressure change, we stay for the remaining analysis with our standard pressure change value of−50 hPa.
5
3.2 Seasonal variation
Since the formation conditions of aerodynamic contrails depend strongly on the am-bient temperature we expect large seasonal variability in their frequency or probabil-ity of occurrence. This is shown in Fig. 5 again for 2011. The figure displays zonal mean probabilities for occurrence of appropriate conditions that would allow formation
10
of aerodynamic contrails. We see large seasonal variations and again large differences on the considered pressure levels, as before. The seasonal variation is weak on the 250 hPa level, as expected, since aerodynamic contrails form almost only in the tropics on this level and the seasons are weakly pronounced there. More variation is found outside of the tropics (equatorward of±20◦), where the probability values drop sharply.
15
It is worth mentioning that the probability for formation of AerC reaches unity in bo-real summer and fall at about 10◦N, roughly along and just north of the intertropical convergence zone. Note, that this maximum is not caused by the moisture brought up to 250 hPa by convection, since we considered only the temperature criteria for the construction of the figure.
20
The seasonal variation is much stronger on the lower pressure levels where aero-dynamic contrails form exclusively in the extratropics, poleward of ±15◦. The zonal probability curves have one peak in each hemisphere, and these peaks shift char-acteristically poleward and equatorward with the seasons. In the respective summer months the probability peaks shift poleward, while they shift equatorward in the
re-25
ACPD
13, 14667–14693, 2013Formation conditions for
aerodynamic contrails
K. Gierens and F. Dilger
Title Page
Abstract Introduction
Conclusions References
Tables Figures
◭ ◮
◭ ◮
Back Close
Full Screen / Esc
Printer-friendly Version Interactive Discussion
Discussion
P
a
per
|
Dis
cussion
P
a
per
|
Discussion
P
a
per
|
Discussio
n
P
a
per
latitudes on 350 hPa. On 450 hPa it is often sufficiently warm for aerodynamic contrails to get visible at the poles in all seasons.
Next, we have to consider where, when and how much aviation occurs in the regions where aerodynamic contrails can form. For this purpose we use data of flown kilome-tres per 1◦×1◦×610 m grid box and per month from the aviation inventory for the year
5
2000 produced within the European FP6 project QUANTIFY (see www.ip-quantify.eu). The air traffic data for three adjacent altitude ranges per pressure level have been in-cluded in Fig. 5 as well. Thus, each pressure level is identified here with a range of 6 flight levels (air routes vertically stacked in 10 hft, i.e. 305 m, distance). This is done for illustration only and we do not claim that these flight levels exactly match the
pres-10
sure levels selected. In detail, the following identification has been made: flight levels 4880 to 6710 m belong to 450 hPa, 6710 to 8540 m to 350 hPa, and 8540 to 10 370 m to 250 hPa. As expected, we find most traffic in the Northern Hemisphere with a max-imum due to intercontinental flights on the 250 hPa level, a local minmax-imum at 350 hPa, and a second but weaker maximum (regional flights) at 450 hPa. On the 250 hPa level
15
we see that the probability maximum for aerodynamic contrails in the tropics is of little effect since most of the air traffic occurs where the probability values for aerodynamic contrails sharply drop due to too low ambient temperatures. The traffic maximum falls directly into the region where aerodynamic contrails can form on the 350 hPa level, however, with only little air traffic. The slightly higher amount of air travel on the 450 hPa
20
level occurs a bit south of the region where aerodynamic contrails would form and the traffic and the probability curves do not completely overlap. This overlap, which is an approximate measure for the total possible amount (length) of aerodynamic contrails on a pressure level, can simply be quantified by multiplying the traffic data with the probabilities for aerodynamic contrail formation and integrating this over the globe. The
25
ACPD
13, 14667–14693, 2013Formation conditions for
aerodynamic contrails
K. Gierens and F. Dilger
Title Page
Abstract Introduction
Conclusions References
Tables Figures
◭ ◮
◭ ◮
Back Close
Full Screen / Esc
Printer-friendly Version Interactive Discussion
Discussion
P
a
per
|
Dis
cussion
P
a
per
|
Discussion
P
a
per
|
Discussio
n
P
a
per
|
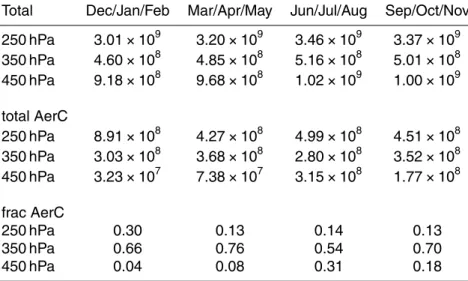
is very much more traffic at about 250 hPa than on 350 hPa, there is not much more aerodynamic contrail production on 250 than on 350 hPa (perhaps with the exception of the northern winter months, when the conditions are best on 250 hPa). Furthermore, in spite of more traffic on 450 hPa than on 350 hPa, there are generally more aerody-namic contrails on 350 than on 450 hPa (with the exception of the northern summer
5
months when the conditions are optimal on 450 hPa). Much higher fractions of flight distance allow formation of aerodynamic contrails on the 350 hPa level than on the two other levels. The seasonal variation is quite strong on all levels, which is mainly a result of the shifting weather patterns.
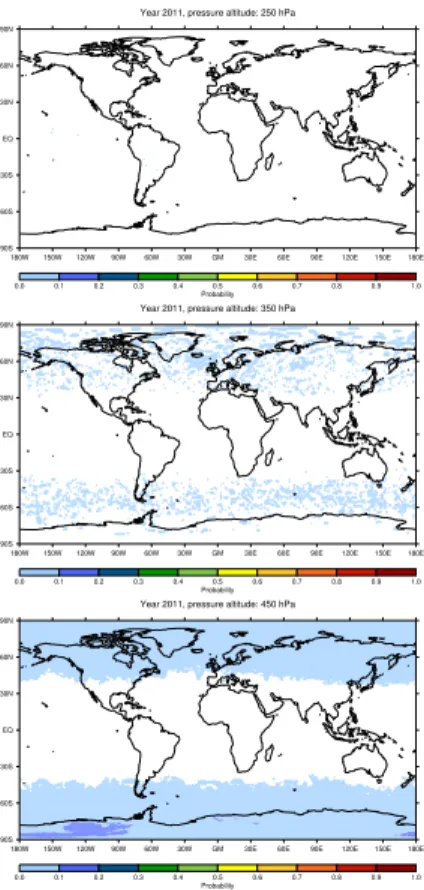
3.3 Persistent aerodynamic contrails
10
Like exhaust contrails, aerodynamic contrails can only persist for a long time (hours) if the ambient air is supersaturated with respect to ice. Thus we add a new condition,
namely RHi≥100 %, to the temperature conditions. The results are shown in Fig. 6
using the same colour coding as before for a convenient comparison. We find that conditions for persistent aerodynamic contrails are mostly given in less than 20 % of
15
the time, only over the Indonesian Warm Pool there are higher probabilities, reaching 30–40 %. Although the reduction of the probability values from the consideration above, only using the temperature criteria, to the inclusion of the supersaturation criterion is rather strong, the result is no surprise. It is well known that the current aircraft fleet meets ice supersaturation in less than 15 % of its flight time or distance (Gierens et al.,
20
1999), thus the current result is consistent with the earlier findings.
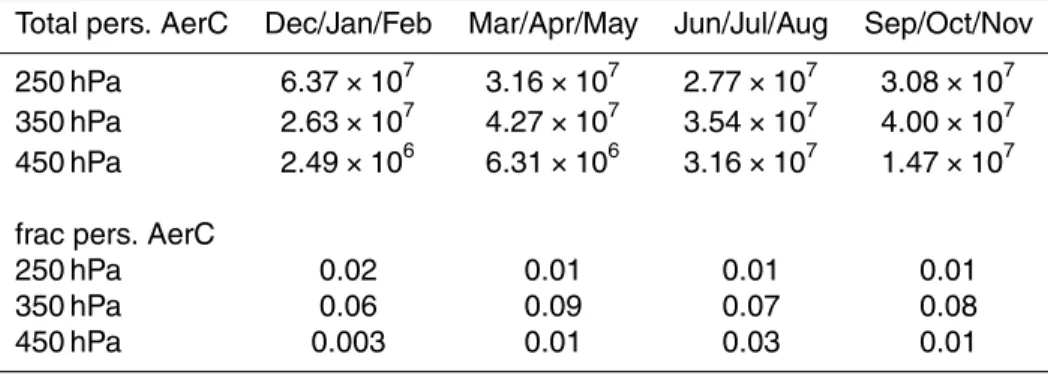
Table 2 contains the total flight distances with persistent aerodynamic contrails on the respective pressure level in the year 2011 and the ratios of these distances to the total flight distances, as before. These probability values are less than 3 % on both 250 and 450 hPa and less than 10 % on the intermediate pressure level.
25
ACPD
13, 14667–14693, 2013Formation conditions for
aerodynamic contrails
K. Gierens and F. Dilger
Title Page
Abstract Introduction
Conclusions References
Tables Figures
◭ ◮
◭ ◮
Back Close
Full Screen / Esc
Printer-friendly Version Interactive Discussion
Discussion
P
a
per
|
Dis
cussion
P
a
per
|
Discussion
P
a
per
|
Discussio
n
P
a
per
cooling rates are used in laboratories to hyperquench micron sized water droplets to form amorphous ice (Murray et al., 2005), but at much lower than tropospheric temper-atures. Thus it is not clear whether the ice that forms over wings is amorphous and if so, for what time period. Amorphous ice can gradually crystallize to cubic ice, the faster the higher the ambient temperature (Bartels-Rausch et al., 2012). In turn, cubic ice
5
transforms into the usual form of hexagonal ice within minutes or on longer timescales at middle and upper tropospheric temperatures (Murphy, 2003; Murray et al., 2005). It is possible that aerodynamic contrails consist of a mixture of cubic and hexagonal ice many kilometres behind an aircraft which would imply a higher than usual satura-tion vapour pressure for aerodynamic contrails, because saturasatura-tion for cubic ice occurs
10
only at 103 to 110 % relative humidity over hexagonal ice. If this is indeed the case then aerodynamic contrails will be persistent only at these higher relative humidities and thus be even less frequent than shown in Table 2.
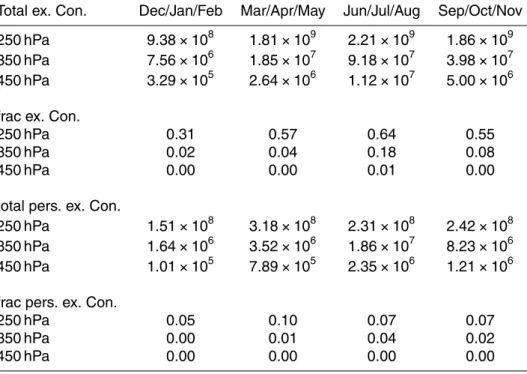
Finally, we compare the numbers of Tables 1 and 2 and with corresponding numbers for exhaust contrails in Table 3. These have been computed from the QUANTIFY
inven-15
tory as above, but using the Schmidt–Appleman criterion (Schumann, 1996) instead of the criteria for aerodynamic contrails. The persistence criterion is the same, namely ice supersaturation of the ambient air. To our knowledge, this kind of quantity (fraction of flight distance where contrails or persistent contrails are produced) has only once been computed (Schumann et al., 2011, their Table 1), because usually one prefers
20
to deal with coverage and potential coverage (for the latter notion, see Sausen et al., 1998). As expected from earlier work we find the largest probability for formation of exhaust contrails and persistent exhaust contrails on the 250 hPa level with a strong reduction at lower altitudes. This tendency results from the fact that low temperature favours formation of exhaust contrails. Thus, this behaviour is to some degree opposite
25
ACPD
13, 14667–14693, 2013Formation conditions for
aerodynamic contrails
K. Gierens and F. Dilger
Title Page
Abstract Introduction
Conclusions References
Tables Figures
◭ ◮
◭ ◮
Back Close
Full Screen / Esc
Printer-friendly Version Interactive Discussion
Discussion
P
a
per
|
Dis
cussion
P
a
per
|
Discussion
P
a
per
|
Discussio
n
P
a
per
|
produced in summer and autumn, but they are mostly short–lived. The altitude region between 350 and 250 hPa appears to offer the possibility that aerodynamic and ex-haust contrails may form together, where they might coexist. How often this is possible will thus be considered next.
3.4 Coexistence of aerodynamic and exhaust contrails
5
We have checked whether and how often in 2011 it was possible that aerodynamic and exhaust contrails could form simultaneously. Persistence was not accounted for in this check as it would dwarf the values found still further. The results for the three pressure levels are shown in Fig. 7. Generally, coexistence of the two kinds of contrails is a rare phenomenon, in our data it is even almost impossible on the 250 hPa level. On the two
10
lower levels coexistence is sometimes possible in the extratropics, with probabilities not exceeding 10 % (except for a region in Antarctica which is irrelevant). The map is very noisy for the 350 hPa level because the probability values are indeed close to zero, so exact zero (white) and close to zero (light blue) are a bit randomly distributed. On 450 hPa there isin principlemore substantial possibility for the coexistence of both
15
contrail types, but Table 3 shows that exhaust contrail formation is extremely seldom on this level, because aircraft on this altitude often fly in regions where the Schmidt– Appleman criterion is not fulfilled (e.g. equatorwards of±40◦).
Thus we conclude this section with the statement that coexistence of exhaust and aerodynamic contrails is not impossible but very improbable.
20
4 Conclusions
In the present study we have analysed atmospheric conditions that allow the formation of aerodynamic contrails which have been defined as line shaped ice clouds that visibly appear at the wings of aircraft in cruise or close to it such that no doubt exists on its formation by the adiabatic cooling of the air flow over the wing. Although only one
ACPD
13, 14667–14693, 2013Formation conditions for
aerodynamic contrails
K. Gierens and F. Dilger
Title Page
Abstract Introduction
Conclusions References
Tables Figures
◭ ◮
◭ ◮
Back Close
Full Screen / Esc
Printer-friendly Version Interactive Discussion
Discussion
P
a
per
|
Dis
cussion
P
a
per
|
Discussion
P
a
per
|
Discussio
n
P
a
per
year of weather data has been analysed (2011) we deem that our conclusions are not affected by any special conditions that might have held in 2011. From this study we can draw the following general conclusions:
– Visible aerodynamic contrails are possible in a thick layer extending from about 540 to 250 hPa. These pressure levels are determined by two temperature
thresh-5
olds. Below 230 K aerodynamic contrails generally stay invisible because there is insufficient water vapour to condense on the ice crystals (Kärcher et al., 2009). The high temperature threshold is determined by the requirement that the air-flow over the wing must cool down to at least the supercooling limit of pure water droplets, 235 K, such that droplets freeze. This threshold is given in Eq. (1). It
10
depends on the ambient pressure and the pressure change over the wing, and because of the latter it depends on aircraft type and its current weight.
– Low ambient relative humidity is almost no constraint for the possibility to form aerodynamic contrails because the saturation water vapour pressure over the wings is almost always lowered sufficiently that water saturation occurs in the
15
airflow.
– The altitude range where aerodynamic contrails can form declines from the trop-ics to the poles. In the troptrop-ics it is highest (250 hPa, typical for intercontinental and continental flights), in the extratropics and polar latitudes it is lower (350 and 450 hPa, continental and regional flights).
20
– The formation probabilities reach quite high values locally, but regions of high formation probabilities differ from regions with strong air traffic.
– Latitude bands where aerodynamic contrails can form shift in the course of the seasons because of the shift of the threshold isotherms.
– Persistent aerodynamic contrails are rare, generally with less than 10 % and more
25
ACPD
13, 14667–14693, 2013Formation conditions for
aerodynamic contrails
K. Gierens and F. Dilger
Title Page
Abstract Introduction
Conclusions References
Tables Figures
◭ ◮
◭ ◮
Back Close
Full Screen / Esc
Printer-friendly Version Interactive Discussion
Discussion
P
a
per
|
Dis
cussion
P
a
per
|
Discussion
P
a
per
|
Discussio
n
P
a
per
|
aerodynamic contrails may well consist of metastable forms of ice, e.g. cubic or amorphous ice due to their special formation conditions which are similar to hy-perquenching of cold micron sized droplets in the laboratory.
– Coexistence of aerodynamic contrails with exhaust contrails is possible but very improbable.
5
The most important question is whether aerodynamic contrails have an adverse effect on climate. From the results in this study we believe that a climate effect of aerodynamic contrails is currently considerably smaller than the climate effect of exhaust contrails, but it adds to it. This conclusion issues from the following argument: the contrail climate effect originates most from contrails at about 10 km altitude, about 250 hPa. Contrails
10
at lower altitudes contribute much less (Rädel and Shine, 2008). On 250 hPa there are currently much more exhaust contrails than aerodynamic contrails (see the absolute values in the tables), thus exhaust contrails must have the lion’s share in contrail cli-mate impact. This may change in the future when more air traffic will occur in tropical latitudes.
15
Acknowledgements. We thank Bethan Owen and David Lee from the Manchester Metropolitan
University for setting up the QUANTIFY air traffic inventory. The meteorological data have
been obtained from the European Centre for Medium-Range Weather Forecasts (ECMWF) within the Special Project spdeissr. Furthermore we thank Eurocontrol for permission to use BADA data for our institute’s research. Kaspar Graf and Andy Heymsfield made comments to
20
an early version that helped to improve the logic and the readability of the paper. This work contributes to the new DLR project WeCare.
The service charges for this open access publication have been covered by a Research Centre of the
25
ACPD
13, 14667–14693, 2013Formation conditions for
aerodynamic contrails
K. Gierens and F. Dilger
Title Page
Abstract Introduction
Conclusions References
Tables Figures
◭ ◮
◭ ◮
Back Close
Full Screen / Esc
Printer-friendly Version Interactive Discussion
Discussion
P
a
per
|
Dis
cussion
P
a
per
|
Discussion
P
a
per
|
Discussio
n
P
a
per
References
Bartels-Rausch, T., Bergeron, V., Cartwright, J., Escribano, R., Finney, J., Grothe, H., Gutiér-rez, P., Haapala, J., Kuhs, W., Pettersson, J., Price, S., Sainz-Díaz, C., Stokes, D., Straz-zulla, G., Thomson, E., Trinks, H., and Uras-Aytemiz, N.: Ice structures, patterns, and pro-cesses: a view across the icefields, Rev. Mod. Phys., 84, 885–944, 2012. 14678
5
Gierens, K., Schumann, U., Helten, M., Smit, H., and Marenco, A.: A distribution law for rela-tive humidity in the upper troposphere and lower stratosphere derived from three years of MOZAIC measurements, Ann. Geophys., 17, 1218–1226, doi:10.1007/s00585-999-1218-7, 1999. 14677
Gierens, K., Kärcher, B., Mannstein, H., and Mayer, B.: Aerodynamic contrails: phenomenology
10
and flow physics, J. Atmos. Sci., 66, 217–226, 2009. 14668, 14677
Gierens, K., Kästner, M., and Klatt, D.: Iridescent aerodynamic contrails: the Norderney case of 27 June 2008, Meteorol. Z., 20, 305–311, 2011. 14669, 14672
Kärcher, B. and Lohmann, U.: A parameterization of cirrus cloud formation: homoge-neous freezing of supercooled aerosols, J. Geophys. Res., 107, AAC 4-1–AAC 4-10,
15
doi:10.1029/2001JD000470, 2002. 14673
Kärcher, B., Mayer, B., Gierens, K., Burkhardt, U., Mannstein, H., and Chatterjee, R.: Aero-dynamic contrails: Microphysics and optical properties, J. Atmos. Sci., 66, 227–243, 2009. 14669, 14670, 14680
Lamquin, N., Gierens, K., Stubenrauch, C. J., and Chatterjee, R.: Evaluation of upper
tropo-20
spheric humidity forecasts from ECMWF using AIRS and CALIPSO data, Atmos. Chem. Phys., 9, 1779–1793, doi:10.5194/acp-9-1779-2009, 2009. 14673
Murphy, D. M.: Dehydration in cold clouds is enhanced by a transition from cubic to hexagonal ice, Geophys. Res. Lett., 30, 2230, doi:10.1029/2003GL018566, 2003. 14678
Murphy, D. and Koop, T.: Review of the vapour pressures of ice and supercooled water for
25
atmospheric applications, Q. J. Roy. Meteor. Soc., 131, 1539–1565, 2005. 14673
Murray, B., Knopf, D., and Bertram, A.: The formation of cubic ice under conditions relevant to Earths atmosphere, Nature, 434, 202–205, 2005. 14678
Rädel, G. and Shine, K.: Radiative forcing by persistent contrails and its dependence on cruise altitudes, J. Geophys. Res., 113, D07105, doi:10.1029/2007JD009117, 2008. 14681
ACPD
13, 14667–14693, 2013Formation conditions for
aerodynamic contrails
K. Gierens and F. Dilger
Title Page
Abstract Introduction
Conclusions References
Tables Figures
◭ ◮
◭ ◮
Back Close
Full Screen / Esc
Printer-friendly Version Interactive Discussion
Discussion
P
a
per
|
Dis
cussion
P
a
per
|
Discussion
P
a
per
|
Discussio
n
P
a
per
|
Sausen, R., Gierens, K., Ponater, M., and Schumann, U.: A diagnostic study of the global distribution of contrails, Part I. Present day climate, Theor. Appl. Climatol., 61, 127–141, 1998. 14678
Schumann, U.: On conditions for contrail formation from aircraft exhausts, Meteorol. Z., 5, 4– 23, 1996. 14678
5
ACPD
13, 14667–14693, 2013Formation conditions for
aerodynamic contrails
K. Gierens and F. Dilger
Title Page
Abstract Introduction
Conclusions References
Tables Figures
◭ ◮
◭ ◮
Back Close
Full Screen / Esc
Printer-friendly Version Interactive Discussion
Discussion
P
a
per
|
Dis
cussion
P
a
per
|
Discussion
P
a
per
|
Discussio
n
P
a
per
Table 1.1st part: total flight distances (in km) on the respective flight levels. 2nd part: flight distances with the possibility of aerodynamic contrail formation. 3rd part: fractions of the total flight distances where aerodynamic contrail formation is possible.
Total Dec/Jan/Feb Mar/Apr/May Jun/Jul/Aug Sep/Oct/Nov
250 hPa 3.01×10⁹ 3.20×10⁹ 3.46×10⁹ 3.37×10⁹
350 hPa 4.60×10⁸ 4.85×10⁸ 5.16×10⁸ 5.01×10⁸
450 hPa 9.18×10⁸ 9.68×10⁸ 1.02×10⁹ 1.00×10⁹
total AerC
250 hPa 8.91×10⁸ 4.27×10⁸ 4.99×10⁸ 4.51×10⁸
350 hPa 3.03×10⁸ 3.68×10⁸ 2.80×10⁸ 3.52×10⁸
450 hPa 3.23×10⁷ 7.38×10⁷ 3.15×10⁸ 1.77×10⁸
frac AerC
250 hPa 0.30 0.13 0.14 0.13
350 hPa 0.66 0.76 0.54 0.70
ACPD
13, 14667–14693, 2013Formation conditions for
aerodynamic contrails
K. Gierens and F. Dilger
Title Page
Abstract Introduction
Conclusions References
Tables Figures
◭ ◮
◭ ◮
Back Close
Full Screen / Esc
Printer-friendly Version Interactive Discussion
Discussion
P
a
per
|
Dis
cussion
P
a
per
|
Discussion
P
a
per
|
Discussio
n
P
a
per
|
Table 2.Flight distances with persistent aerodynamic contrails. 1st part: flight distances in km. 2nd part: fractions of the total flight distances where aerodynamic contrails would be persistent.
Total pers. AerC Dec/Jan/Feb Mar/Apr/May Jun/Jul/Aug Sep/Oct/Nov
250 hPa 6.37×10⁷ 3.16×10⁷ 2.77×10⁷ 3.08×10⁷
350 hPa 2.63×10⁷ 4.27×10⁷ 3.54×10⁷ 4.00×10⁷
450 hPa 2.49×10⁶ 6.31×10⁶ 3.16×10⁷ 1.47×10⁷
frac pers. AerC
250 hPa 0.02 0.01 0.01 0.01
350 hPa 0.06 0.09 0.07 0.08
ACPD
13, 14667–14693, 2013Formation conditions for
aerodynamic contrails
K. Gierens and F. Dilger
Title Page
Abstract Introduction
Conclusions References
Tables Figures
◭ ◮
◭ ◮
Back Close
Full Screen / Esc
Printer-friendly Version Interactive Discussion
Discussion
P
a
per
|
Dis
cussion
P
a
per
|
Discussion
P
a
per
|
Discussio
n
P
a
per
Table 3.Flight distances with exhaust contrails and persistent exhaust contrails. 1st part: flight distances with exhaust contrails in km. 2nd part: fractions of flight distances with exhaust con-trails. 3rd part: flight distances with persistent exhaust contrails in km. 4th part: fractions of the total flight distances where exhaust contrails would be persistent.
Total ex. Con. Dec/Jan/Feb Mar/Apr/May Jun/Jul/Aug Sep/Oct/Nov
250 hPa 9.38×10⁸ 1.81×10⁹ 2.21×10⁹ 1.86×10⁹
350 hPa 7.56×10⁶ 1.85×10⁷ 9.18×10⁷ 3.98×10⁷
450 hPa 3.29×10⁵ 2.64×10⁶ 1.12×10⁷ 5.00×10⁶
frac ex. Con.
250 hPa 0.31 0.57 0.64 0.55
350 hPa 0.02 0.04 0.18 0.08
450 hPa 0.00 0.00 0.01 0.00
total pers. ex. Con.
250 hPa 1.51×10⁸ 3.18×10⁸ 2.31×10⁸ 2.42×10⁸
350 hPa 1.64×10⁶ 3.52×10⁶ 1.86×10⁷ 8.23×10⁶
450 hPa 1.01×10⁵ 7.89×10⁵ 2.35×10⁶ 1.21×10⁶
frac pers. ex. Con.
250 hPa 0.05 0.10 0.07 0.07
350 hPa 0.00 0.01 0.04 0.02
ACPD
13, 14667–14693, 2013Formation conditions for
aerodynamic contrails
K. Gierens and F. Dilger
Title Page
Abstract Introduction
Conclusions References
Tables Figures
◭ ◮
◭ ◮
Back Close
Full Screen / Esc
Printer-friendly Version Interactive Discussion
Discussion
P
a
per
|
Dis
cussion
P
a
per
|
Discussion
P
a
per
|
Discussio
n
P
a
per
|
24000 26000 28000 30000 32000 34000 36000 38000 40000 42000
-70 -65 -60 -55 -50 -45 -40 -35 -30 -25 -20 350 300 250 200
flight altitude (ft)
pressure altitude (hPa)
pressure difference (hPa) A320
B738
A319 A321
DH8D B733
AT72
B737 E190
B735
Fig. 1. Pressure differences∆pabove minus below the wings of various aircraft representing
more than half of European air traffic in 2011.∆phas been calculated by dividing weight by wing
area. Error bars around a central reference value indicate pressure differences at maximum
ACPD
13, 14667–14693, 2013Formation conditions for
aerodynamic contrails
K. Gierens and F. Dilger
Title Page
Abstract Introduction
Conclusions References
Tables Figures
◭ ◮
◭ ◮
Back Close
Full Screen / Esc
Printer-friendly Version Interactive Discussion
Discussion
P
a
per
|
Dis
cussion
P
a
per
|
Discussion
P
a
per
|
Discussio
n
P
a
per
200
300
400
500
600
700
800
900
1000
230 235 240 245 250 255
pressure (hPa)
max. temperature (K)
Tmax, 50 hPa Tmax, 40 hPa Tmax, 60 hPa US Std. tropic atm. midlat. winter midlat. summer subarctic winter subarctic summer
ACPD
13, 14667–14693, 2013Formation conditions for
aerodynamic contrails
K. Gierens and F. Dilger
Title Page Abstract Introduction Conclusions References Tables Figures ◭ ◮ ◭ ◮ Back Close
Full Screen / Esc
Printer-friendly Version Interactive Discussion Discussion P a per | Dis cussion P a per | Discussion P a per | Discussio n P a per |
27W 7W 13E 33E
33N 43N 53N 63N 73N
potential regions for aerodynamic contrails, 27 June 2008 12 UTC, 250 hPa 230 230 230 230 230 230 233 233 233 236
27W 7W 13E 33E
33N 43N 53N 63N 73N
27W 7W 13E 33E
33N 43N 53N 63N 73N
27W 7W 13E 33E
33N 43N 53N 63N 73N
potential regions for aerodynamic contrails, 27 June 2008 12 UTC, 300 hPa
230 230 230 230 233 233 233 236 236 239 239 242 245
27W 7W 13E 33E
33N 43N 53N 63N 73N
27W 7W 13E 33E
33N 43N 53N 63N 73N
27W 7W 13E 33E
33N 43N 53N 63N 73N
potential regions for aerodynamic contrails, 27 June 2008 12 UTC, 350 hPa
230 230 230 230 230 233 233 233 233 236 236 236 236 239 239 239 242 242 242 242 245 245 248 248 251
27W 7W 13E 33E
33N 43N 53N 63N 73N
27W 7W 13E 33E
33N 43N 53N 63N 73N
27W 7W 13E 33E
33N 43N 53N 63N 73N
potential regions for aerodynamic contrails, 27 June 2008 12 UTC, 400 hPa
236 236 239 239 239 242 242 242 242 245 245 245 248 248 248 248 251 251 251 251 251 254 254 257
27W 7W 13E 33E
33N 43N 53N 63N 73N
27W 7W 13E 33E
33N 43N 53N 63N 73N
27W 7W 13E 33E
33N 43N 53N 63N 73N
potential regions for aerodynamic contrails, 27 June 2008 12 UTC, 450 hPa
242 245 245 245 245 245 248 248 248 248 251 251 251 254 254 254 254 257 257 257 257 257 260 260
27W 7W 13E 33E
33N 43N 53N 63N 73N
27W 7W 13E 33E
33N 43N 53N 63N 73N
27W 7W 13E 33E
33N 43N 53N 63N 73N
potential regions for aerodynamic contrails, 27 June 2008 12 UTC, 500 hPa
248 248 251 251 251 251 254 254 254 254 257 257 257 260 260
27W 7W 13E 33E
33N 43N 53N 63N 73N
27W 7W 13E 33E
33N 43N 53N 63N 73N
Fig. 3. Regions over Europe that are conditioned to formation of aerodynamic contrails on 27 June 2008, noon. White colour signifies too cold or too warm temperatures for aerodynamic
contrail formation, the three shades of blue correspond to pressure drop values of−60,−50,
and−40 hPa (from light to dark blue). Stippling shows areas with clouds (cloud fraction
ACPD
13, 14667–14693, 2013Formation conditions for
aerodynamic contrails
K. Gierens and F. Dilger
Title Page
Abstract Introduction
Conclusions References
Tables Figures
◭ ◮
◭ ◮
Back Close
Full Screen / Esc
Printer-friendly Version Interactive Discussion
Discussion
P
a
per
|
Dis
cussion
P
a
per
|
Discussion
P
a
per
|
Discussio
n
P
a
per
180W 150W 120W 90W 60W 30W GM 30E 60E 90E 120E 150E 180E
90S 60S 30S EQ 30N 60N 90N
Year 2011, pressure altitude: 250 hPa
0.0 0.1 0.2 0.3 0.4 0.5 0.6 0.7 0.8 0.9 1.0
Probability
180W 150W 120W 90W 60W 30W GM 30E 60E 90E 120E 150E 180E
90S 60S 30S EQ 30N 60N 90N
Year 2011, pressure altitude: 350 hPa
0.0 0.1 0.2 0.3 0.4 0.5 0.6 0.7 0.8 0.9 1.0
Probability
180W 150W 120W 90W 60W 30W GM 30E 60E 90E 120E 150E 180E
90S 60S 30S EQ 30N 60N 90N
Year 2011, pressure altitude: 450 hPa
0.0 0.1 0.2 0.3 0.4 0.5 0.6 0.7 0.8 0.9 1.0
Probability
ACPD
13, 14667–14693, 2013Formation conditions for
aerodynamic contrails
K. Gierens and F. Dilger
Title Page Abstract Introduction Conclusions References Tables Figures ◭ ◮ ◭ ◮ Back Close
Full Screen / Esc
Printer-friendly Version Interactive Discussion Discussion P a per | Dis cussion P a per | Discussion P a per | Discussio n P a per |
Year 2011, pressure altitude: 250 hPa
0 10 20 30 40 50 60 70 80 90 100 110 120 130 140 150 0 10 20 30 40 50 60 70 80 90 100 110 120 130 140 150 10
6 km travelled per degree latitude
-90 -60 -30 0 30 60 90
latitude 0.0 0.1 0.2 0.3 0.4 0.5 0.6 0.7 0.8 0.9 1.0 0.0 0.1 0.2 0.3 0.4 0.5 0.6 0.7 0.8 0.9 1.0 probability
km travelled SON km travelled JJA km travelled MAM km travelled DJF probability SON probability JJA probability MAM probability DJF
km travelled SON km travelled JJA km travelled MAM km travelled DJF probability SON probability JJA probability MAM probability DJF
Year 2011, pressure altitude: 350 hPa
0 10 20 30 40 50 60 70 80 90 100 110 120 130 140 150 0 10 20 30 40 50 60 70 80 90 100 110 120 130 140 150 10
6 km travelled per degree latitude
-90 -60 -30 0 30 60 90
latitude 0.0 0.1 0.2 0.3 0.4 0.5 0.6 0.7 0.8 0.9 1.0 0.0 0.1 0.2 0.3 0.4 0.5 0.6 0.7 0.8 0.9 1.0 probability
km travelled SON km travelled JJA km travelled MAM km travelled DJF probability SON probability JJA probability MAM probability DJF
km travelled SON km travelled JJA km travelled MAM km travelled DJF probability SON probability JJA probability MAM probability DJF
Year 2011, pressure altitude: 450 hPa
0 10 20 30 40 50 60 70 80 90 100 110 120 130 140 150 10
6 km travelled per degree latitude
-90 -60 -30 0 30 60 90
latitude 0.0 0.1 0.2 0.3 0.4 0.5 0.6 0.7 0.8 0.9 1.0 probability
km travelled SON km travelled JJA km travelled MAM km travelled DJF probability SON probability JJA probability MAM probability DJF
Fig. 5. Seasonal variation of zonally averaged probability that an aircraft with ∆p=50 hPa produces an aerodynamic contrail when flying on the indicated pressure level, 250, 350, and 450 hPa (from top to bottom). Only temperature criteria are considered for this figure.
Further-more the seasonal and latitudinal distribution of air traffic at about the indicated pressure level
ACPD
13, 14667–14693, 2013Formation conditions for
aerodynamic contrails
K. Gierens and F. Dilger
Title Page
Abstract Introduction
Conclusions References
Tables Figures
◭ ◮
◭ ◮
Back Close
Full Screen / Esc
Printer-friendly Version Interactive Discussion
Discussion
P
a
per
|
Dis
cussion
P
a
per
|
Discussion
P
a
per
|
Discussio
n
P
a
per
180W 150W 120W 90W 60W 30W GM 30E 60E 90E 120E 150E 180E
90S 60S 30S EQ 30N 60N 90N
Year 2011, pressure altitude: 250 hPa
0.0 0.1 0.2 0.3 0.4 0.5 0.6 0.7 0.8 0.9 1.0
Probability
180W 150W 120W 90W 60W 30W GM 30E 60E 90E 120E 150E 180E
90S 60S 30S EQ 30N 60N 90N
Year 2011, pressure altitude: 350 hPa
0.0 0.1 0.2 0.3 0.4 0.5 0.6 0.7 0.8 0.9 1.0
Probability
180W 150W 120W 90W 60W 30W GM 30E 60E 90E 120E 150E 180E
90S 60S 30S EQ 30N 60N 90N
Year 2011, pressure altitude: 450 hPa
0.0 0.1 0.2 0.3 0.4 0.5 0.6 0.7 0.8 0.9 1.0
Probability
ACPD
13, 14667–14693, 2013Formation conditions for
aerodynamic contrails
K. Gierens and F. Dilger
Title Page
Abstract Introduction
Conclusions References
Tables Figures
◭ ◮
◭ ◮
Back Close
Full Screen / Esc
Printer-friendly Version Interactive Discussion
Discussion
P
a
per
|
Dis
cussion
P
a
per
|
Discussion
P
a
per
|
Discussio
n
P
a
per
|
180W 150W 120W 90W 60W 30W GM 30E 60E 90E 120E 150E 180E
90S 60S 30S EQ 30N 60N 90N
Year 2011, pressure altitude: 250 hPa
0.0 0.1 0.2 0.3 0.4 0.5 0.6 0.7 0.8 0.9 1.0
Probability
180W 150W 120W 90W 60W 30W GM 30E 60E 90E 120E 150E 180E
90S 60S 30S EQ 30N 60N 90N
Year 2011, pressure altitude: 350 hPa
0.0 0.1 0.2 0.3 0.4 0.5 0.6 0.7 0.8 0.9 1.0
Probability
180W 150W 120W 90W 60W 30W GM 30E 60E 90E 120E 150E 180E
90S 60S 30S EQ 30N 60N 90N
Year 2011, pressure altitude: 450 hPa
0.0 0.1 0.2 0.3 0.4 0.5 0.6 0.7 0.8 0.9 1.0
Probability