UFOP - CETEC - UEMG
REDEMAT
R
EDET
EMÁTICA EME
NGENHARIA DEM
ATERIAISUFOP – CETEC – UEMG
Tese de Doutorado
Autora: Adarlêne Moreira Silva
Orientador: Prof. Versiane Albis Leão
Fevereiro/2012
REDEMAT
UFOP
–
CETEC - UEMG
Adarlêne Moreira Silva
Remoção do Manganês e do Sulfato de Água de Mina
Tese de Doutorado apresentada ao Programa de Pós-Graduação em Engenharia de Materiais da REDEMAT, como parte integrante dos requisitos para a obtenção do título de Doutor em Engenharia de Materiais.
Área de concentração: Processos de fabricação
Orientador: Prof. Versiane Albis Leão
AGRADECIMENTOS
Eu gostaria de agradecer a todos aqueles que diretamente ou indiretamente me ajudaram na realização desta Tese de Doutorado.
Ao Professor Dr. Versiane Albis Leão, pela confiança, dedicação, exigência e competência na orientação deste trabalho.
Ao meu sobrinho, Felipe Trindade Silva, pelo carinho, atenção, companheirismo e ajuda na montagem e na apresentação da Tese.
Ao Flávio Luciano dos Santos Cruz, pela amizade, ajuda na realização e na análise dos resultados.
À Flávia Donária Reis da Silva, pela amizade, auxílio na análise dos resultados, pelo incentivo, ajuda na montagem da apresentação e na correção da Tese.
À Emmanoelle Cintra da Cunha, pela ajuda na realização dos ensaios, pelas análises
químicas conduzidas por Espectrometria de Absorção Atômica e no ICP - OES, no Laboratório de Bio&Hidrometalurgia - DEMET-UFOP.
Aos colegas do Laboratório de Bio&Hidrometalurgia.
Ao Graciliano Dimas Francisco e ao Laboratório de Bio&Hidrometalurgia -
DEMET-UFOP, pelas análises das amostras utilizando a técnica de adsorção de nitrogênio.
Ao Professor Anderson Dias e ao Laboratório de Espectroscopia IV – Departamento
de Física da UFMG, pela análise das amostras por espectroscopia no infravermelho (FTIR) e análise dos resultados.
Ao Luiz Nogueira de Faria representante da Empresa Pró-Calcareo – MG, pelas amostras de calcários utilizadas na Tese.
Ao José Roberto Wardi representante da Empresa ICAL Indústria de Calcinação Ltda
– MG, pelas amostras de calcários utilizadas na Tese.
À Camila Gesteira Braga, pela amizade, incentivo e pelas aulas de redação que foram essenciais para a elaboração desta Tese.
À Vallourec&Sumitomo Tubos do Brasil, pelas análises de Microscopia Eletrônica de Varredura.
À Rede Temática em Engenharia de Materiais REDEMAT.
Resumo
As remoções de manganês e de sulfato são importantes desafios no tratamento de águas de mina. O manganês é de difícil remoção devido a sua alta solubilidade em meio ácido ou neutro e pode ser encontrado em altas concentrações nessas águas, conforme a mineralogia das rochas. Por outro lado, a presença de íons sulfato é normalmente devida à oxidação de minerais sulfetados e também pode ser encontrado em concentrações elevadas nas drenagens de mina. Portanto, este trabalho investigou a remoção do manganês e do sulfato das águas neutras de mina, com experimentos em tanques agitados e em colunas de leito fixo. Para a remoção de manganês, este estudo envolveu a precipitação dos íons Mn (II) presentes em águas de mina com concentração de 140 mg.L-1 e pH 6,5, aplicando misturas do carbonato de sódio e do calcário. Observou-se que, além da concentração total do carbonato, o pH também influenciou na precipitação do carbonato de manganês. Uma remoção de 99,9% do manganês foi alcançada com íons carbonatos, para pH da solução acima de 8,5. Avaliou-se também a aplicação do calcário para adsorção do manganês nas águas de mina para baixa concentração do elemento (1,5 e 15,0 mg.L-1). Observou-se que o equilíbrio da adsorção pode ser descrito pelas equações de Freundlich ou de Langmuir, sendo o carregamento máximo alcançado de 0,91 mgMn.g-1 calcário em sistemas agitados. Os modelos de Thomas, de Yoon e Nelson e de Dose-resposta apresentaram uma boa correlação com os resultados obtidos em coluna de leito fixo. O modelo BDST conformou o baixo carregamento de manganês, ou seja 0,057 mgMn.mL-1 leito, para concentração de
15,0 mgMn.L-1 e vazão de 1 mL.min-1. Nos experimentos de remoção do sulfato, em sistema contínuo a concentração deste íon foi reduzida de 588 para 87 mg.L-1, em 210 minutos. Os experimentos de equilíbrio mostraram que o carregamento do sulfato no calcário pode ser descrito pela isoterma de Langmuir, com carregamento máximo de 23,7 mgSO4 2-.g-1 de calcário. O processo de adsorção em leito fixo pode também ser
descrito por modelos de Thomas, de Yoon e Nelson e de Dose-resposta. Nestes sistemas, para partículas de calcário na faixa granulométrica entre 0,42-0,59 mm, o carregamento foi de 20 mgSO42-.L-1 leito. A espectrofotometria no infravermelho
indicou a presença de íons sulfato e de carbonato do manganês na superfície do calcário. Observou-se que o calcário é efetivo na remoção do manganês somente para baixa concentração do metal (1,5 mg.L-1). Entretanto, pode ser utilizado como etapa de polimento para água neutra de mina contendo entre 250 e 1200 mg.L-1 de sulfato, onde a precipitação de gesso não é mais efetiva.
Abstract
Both sulfate and manganese removals are important challenges in the treatment of mine waters. Manganese is difficult to remove due its high solubility in acid or neutral effluents. It can be found in high concentrations in mine waters, depending on the rock mineralogy. On the other hand, the presence of sulfate ions is normally due to the oxidation of sulfide minerals. Therefore, this work investigated the removal of manganese and sulfate from neutral mine waters, through experiments in agitated tanks and fixed-bed columns. The study addressed Mn(II) precipitation in mine waters containing 140 mg.L-1 Mn at pH 6.5, applying mixtures of sodium carbonate and limestone. It was observed that, in addition to the carbonate concentration, pH also influenced manganese precipitation as MnCO3. A removal of 99.9% Mn was reached
with carbonate ions, provided the solution pH was above 8.5. In addition, the application of limestone as a sorbent for low concentration Mn waters (1.5 mg.L-1 and 15.0 mg. L-1) was also assessed. It was observed that sorption can be described by either Freundlich or Langmuir equations with 0.91 mgMn.g-1 limestone as the maximum value. The models of Thomas, Yoon and Nelson and Dose-response were able to describe manganese sorption in fixed-bed columns. The BDST model confirmed the low manganese loading on limestone, as a maximum of 0.057 mgMn.mL-bed-1 was observed for a 15.0 mgMn.L-1 mine water, at a flow rate of 1 mL.min-1. In the experiments of sulfate removal, the concentration of this ion was reduced from 588 mg.L-1 to 87 mg.L-1, in 210 minutes. Sulfate sorption on limestone was described by the Langmuir isotherm, with maximum loading of 23.7 mgSO42-.g-1. The adsorption
process was also modeled with the Thomas, Yoon and Nelson and Dose-response models, whereby sorption parameters were determined. With a limestone particle size between 0.42 and 0.59 mm, a bed loading of 20 mgSO42-.L-1 was observed. Infrared
spectrofotometry indicated the presence of sulfate ions and manganese carbonate on the limestone surface. It was observed that the limestone is effective in the removal of manganese only at low metal concentration (1.5 mg.L-1). However, it can be applied in sulfate removal from neutral mine waters containing between 250 mg.L-1 and
1200 mg.L-1, for which gypsum precipitation is not effective.
SUMÁRIO
CAPÍTULO 1 ... 1
1.1-INTRODUÇÃO ... 1
1.2–PARÂMETROS E PROCESSOS ... 4
1.3–ATIVIDADES DESENVOLVIDAS E ORGANIZAÇÃO DA TESE ... 6
1.4–REFERÊNCIAS BIBLIOGRÁFICAS ... 8
CAPÍTULO 2 ... 11
2.1-INTRODUCTION ... 13
2.2-MATERIALS AND METHODS ... 15
2.2.1 - Calcite limestone and mine waters ... 15
2.2.2 - Stirred-tank experiments ... 16
2.2.3 - Kinetics experiments ... 17
2.2.4 - Equilibrium experiments ... 17
2.2.5 - Fixed –bed experiments ... 17
2.2.6 - Sorption characterization ... 18
2.3-MODELING ... 19
2.4-RESULTS AND DISCUSSIONS ... 22
2.4.1- Experiments in stirred tank with fine ground limestone... 22
2.4.2 - Experiments with the coarser limestone particles ... 24
2.4.3 - Kinetics testing ... 25
2.4.4 - Equilibrium experiments ... 26
2.4.5 - Fixed-bed experiments ... 27
2.4.6 - Breakthrough modeling ... 31
2.5-MANGANESE UPTAKE CHARACTERIZATION ... 38
2.6-CONCLUSIONS ... 42
2.7-REFERENCES ... 43
CAPÍTULO 3 ... 47
3.1–INTRODUCTION ... 49
3.2–EXPERIMENTAL ... 51
3.2.1 – Characterization ... 52
3.3-RESULTS AND DISCUSSIONS ... 53
3.4–CONCLUSIONS... 68
3.5–REFERENCES ... 69
CAPÍTULO 4 ... 72
4.1-INTRODUCTION ... 74
4.2-MATERIALS AND METHODS ... 76
4.2.1 - Calcite limestone and mine waters ... 76
4.2.3 - Continuous experiments ... 77
4.2.4 - Fixed-bed experiments ... 77
4.2.5 - Infrared analysis and scanning electron microscopy ... 78
4.3-KINETICS MODELING ... 79
4.4-RESULTS AND DISCUSSION... 80
4.4.1 - Removal in stirred tanks ... 82
4.4.2 - Fixed-bed sorption ... 84
CAPÍTULO 5 ... 107
5.1-CONSIDERAÇÕES FINAIS ... 107
CAPÍTULO 6 ... 109
6.1-CONTRIBUIÇÕES AO CONHECIMENTO ... 109
CAPÍTULO 7 ... 110
LISTA DE FIGURAS
Figure 2.1 - Influence of time on manganese removal and pH from an industrial effluent
containing 1.5 mg.L-1. Continuous experiment, 4.2 g.L-1 of limestone <0.045 mm, initial pH 8.0 and 23±2°C. ... 23
Figure 2.2 - Variation of manganese concentration with time (a) and fitting to the
pseudofirst-order model (b). Experimental conditions: 37.5 g.L-1 limestone, 1.5 L manganese solution, 1.5 mg.L-1 and pH 8.0 or 15 mg.L-1 and pH 6.5, 23±2°C. ... 25
Figure 2.4 - Experimental breakthrough curves for manganese sorption on limestone.
C0= 1.5 mg.L-1 at 1 mL.min-1 (a) and 3 mL.min-1, pH 8.0 (b). Experiments at 20 cm bed depth
15 mg.L-1, pH 6.5 (c); 0.59-0.85 mm particle size, 23±2oC. ... 28 Figure 2.5 - Time for breakthrough compared to bed length for manganese sorption on a
limestone surface according to the BDST model. C0 = 1.5 mg.L-1 Mn2+, pH 8.0; 1mL.min-1 (a)
e 3.0 mLmin-1 (b). ... 32 Figure 2.6 - Comparison of experimental and theoretical breakthrough curves for manganese
sorption on limestone applying the Thomas model. C0 = 1.5 mg.L-1 at 1 mL.min-1 (a) and
3 mL.min-1 (b); Z = 20 cm. Initial manganese concentration: 1.5 mg.L-1, pH 8.0, or 15 mg.L-1 pH 6.5 (c); 0.59-0.85 mm particle size, 23±2oC. ... 33
Figure 2.7 - Comparison of experimental and theoretical breakthrough curves for manganese
sorption on limestone applying the Yoon-Nelson model. C0 = 1.5 mg.L-1 at 1 mL.min-1 (a)
and 3 mL.min-1 (b); Z = 20 cm; C0 = 1.5 mg.L-1, pH 8.0, or 15 mg.L-1, pH 6.5 (c);
0.59-0.85 mm particle size, 23±2oC... 37
Figure 2.8 - Comparison of experimental and theoretical breakthrough curves for manganese
and 3 mL.min-1 (b). Z = 20 cm; C0 = 1.5 mg.L-1, pH 8.0; C0 = 15 mg.L-1, pH 6.5 (c); 0.59-0.85
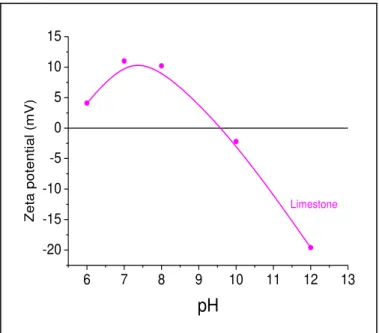
mm particle size, 23±2oC... 37 Figure 2.9 - Zeta potential measurements for limestone used in the experiments ... 39
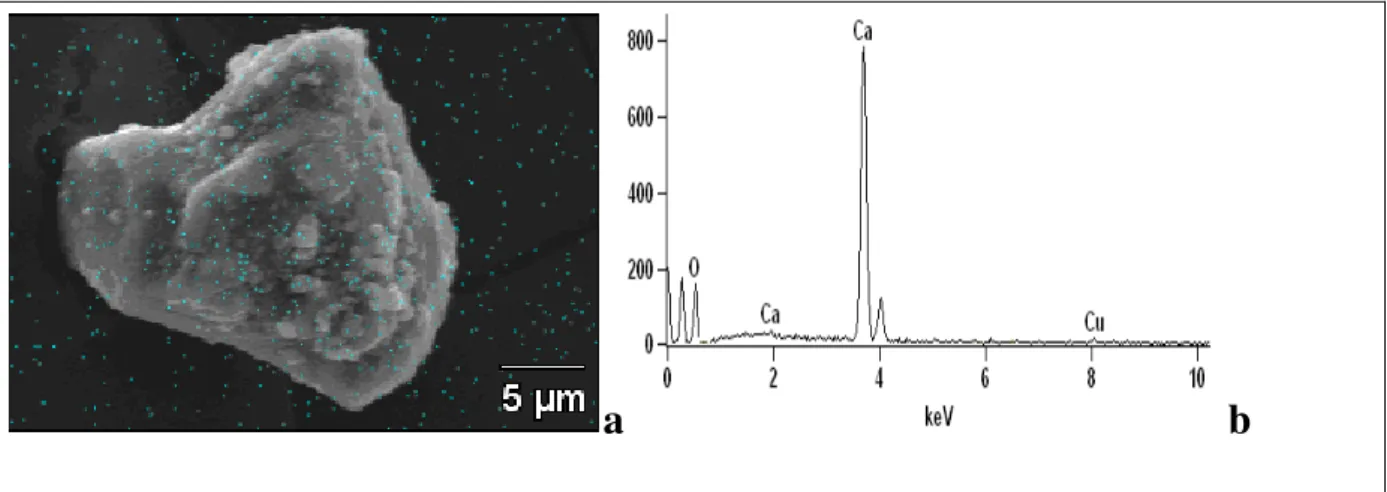
Figure 2.10 - SEM image of manganese loaded limestone (a) and EDS spectra (b) from the
low manganese mine water (1.5 mg.L-1), 4.2 g.L-1 of limestone (d50 = 8.6 µm), pH 8.0 and
23±2°C. ... 40
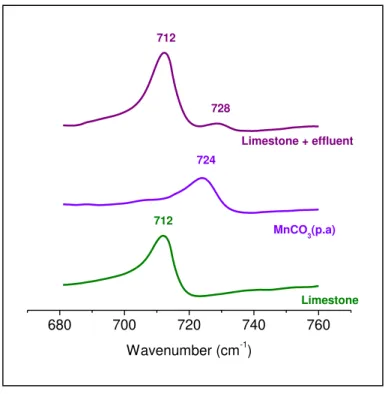
Figure 2.11 - IR spectra for calcite limestone, pure manganese carbonate and manganese
sorbed limestone. ... 41
Figure 3.1 - Manganese carbonate and hydroxide solubility as function of pH at 25oC and
I ↦0. [CO3]tot represents total dissolved carbonate species. ... 55
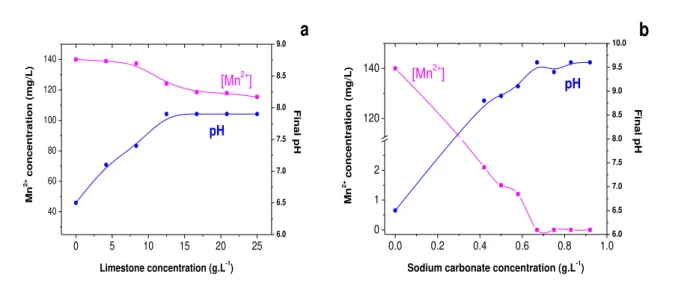
Figure 3.2 - Effects of powdered limestone proportion (a) and sodium carbonate concentration
(b) on manganese removal from synthetic solutions. Experimental conditions: 140.0 mg.L-1 initial pH 6.5, 23±2οC. ... 57
Figure 3.3 - Effect of different precipitants on manganese removal with limestone.
Experimental conditions: 140.0 mg.L-1 Mn synthetic solutions, initial pH 6.5, 12.5 g.L-1 limestone (<0.045 mm), 0.21 g.L-1 or 0.67 g.L-1 sodium bicarbonate, 23±2οC. ... 59
Figure 3.4 - Effect of sodium carbonate concentration on manganese removal. Experimental
conditions: 140.0 mg.L-1 Mn in both mine water and synthetic solutions, 12.5 g.L-1 limestone
(<0.045 mm), 0.26 g.L-1 or 0.67 g.L-1 sodium carbonate, initial pH 6.5, 23±2οC. ... 60 Figura 3.5 - Effect of sodium carbonate concentration in manganese removal from synthetic
solutions. Experimental conditions: 90 min experiments, pH 2.3 (initial); 12.5 g.L-1 limestone
(<0.045 mm), 23±2οC. ... 61
Figure 3.6 - Manganese removal with limestone-sodium carbonate mixtures in continuous
solution (300 mg.L-1), at initial pH 2.3 and 0.83 g.L-1 sodium carbonate. Residence time:
60 min. ... 62
Figure 3.7 - Infrared spectra of pure manganese carbonate, limestone and manganese
carbonate precipitated on limestone surface. The mine water contained 140.0 mg.L-1 Mn(II),
while ppt I and ppt II refere to manganese laden limestone precipitated from 300 mg.L-1 (ppt I) and 2000 mg.L-1 (ppt II) manganese solutions. ... 64
Figure 3.8 - SEM images and EDS spectra of manganese precipitated over limestone surfaces:
mine water (a and b); manganese precipitated from synthetic solutions: 300 mg.L-1 (c) and 2,0 g.L-1 (d). Manganese mapping is shown in figures (b) and (c). Experimental conditions:
Batch precipitation 12.5 g.L-1 limestone, 23±2oC. ... 67 Figure 4.1 - Influence of time on sulfate removal and pH from mine water containing
588.0 mg.L-1 sulfate, 25 g.L-1 limestone; initial pH 6.5, 300 min-1, 23±1oC. Particle size <0.045 mm (a); 0.42-0.59 mm (b). ... 83
Figure 4.2 - Influence of time on sulfate removal and pH from mine water containing
588.0 mg.L-1 in continue system, 25.0 g.L-1 limestone (<0.045 mm), pH initial 6.5, 300 min-1, 23±1oC. ... 84
Figure 4.3 - Sulfate sorption isotherm at 23±1oC and pH initial 6.5. Experimental conditions: 25g.L-1 limestone, particle size 0.42-0.59 mm. ... 85 Figure 4.4 - Experimental breakthrough curves for sulfate sorption on limestone.
C0=588.0 mg.L-1 SO42-, Z = 10 cm (a), 15 cm (b), 20 cm (c), 25 cm (d); initial pH 6.5, particle
size 0.42- 0.59 mm, T= 23°C. ... 86
Figure 4.5 - EBRT plot for the sorption of sulfate ions on limestone. Experimental conditions
Figure 4.6 - Time for breakthrough compared to bed lengths for sulfate sorption on limestone
applying the BDST model. C0=588.0 mg.L-1 SO42-, Q = 1 mL.min-1 (a), 2 mL.min-1 (b),
3 mL.min-1 (c), 10 mL.min-1 (d); particle size 0.42-0.59 mm, initial pH 6.5, T=23±1°C. ... 90 Figure 4.7 - Comparison of experimental and theoretical breakthrough curves for sulfate
sorption on limestone using the Thomas model. Experimental values are shown by data points
and model predictions are represented by lines. C0=588.0 mg.L-1 SO42-, Z = 10 cm (a),
15 cm (b), 20 cm (c), 25 cm (d); particle size 0.42-0.59 mm, initial pH 6.5, 23±1°C. ... 94
Figure 4.8 - Comparison of experimental and theoretical breakthrough curves for sulfate
sorption on limestone using the Yoon and Nelson model. Experimental values are shown by
data points and model predictions are represented by lines. C0=588.0 mg.L-1 SO42-, Z = 10 cm
(a), 15 cm (b), 20 cm (c), 25 cm (d); particle size 0.42-0.59 mm, initial pH 6.5, T=23±1°C. . 95
Figure 4.9 - Comparison of experimental and theoretical breakthrough curves for sulfate
sorption on limestone using the Dose-response model. Experimental values are shown by data
points and model predictions are represented by lines. C0=588.0 mg.L-1 SO42-, Z = 10 cm (a),
15 cm (b), 20 cm (c), 25 cm (d); particle size 0.42-0.59 mm, initial pH 6.5, T=23±1°C. ... 97
Figure 4.10 - Infrared spectra for limestone, calcium sulfate di-hydrate and sulfate-laden
limestone. ... 99
Figure 4.11 - Limestone particles before and after sulfate sorption in fixe-bed experiments. (a)
limestone particles before sulfate sorption; (b) oxygen and (c) calcium mapping;(d) Composed image showing limestone particles and sulfur mapping (red); (e) manganese
LISTA DE TABELAS
Tabela 1.1 – Resumo de alguns trabalhos de remoção de manganês com calcário. ... 5
Tabela 1.2 – Resumo de alguns trabalhos de remoção de sulfato. ... 6
Table 2.1 - Model equations applied to predict breakthrough curves. ... 21
Table 2.2 - Mine water composition studied in this work. Values are in mg.L-1. ... 22
Table 2.3 - Experimental values for fixed-bed manganese sorption by limestone under different conditions. ... 30
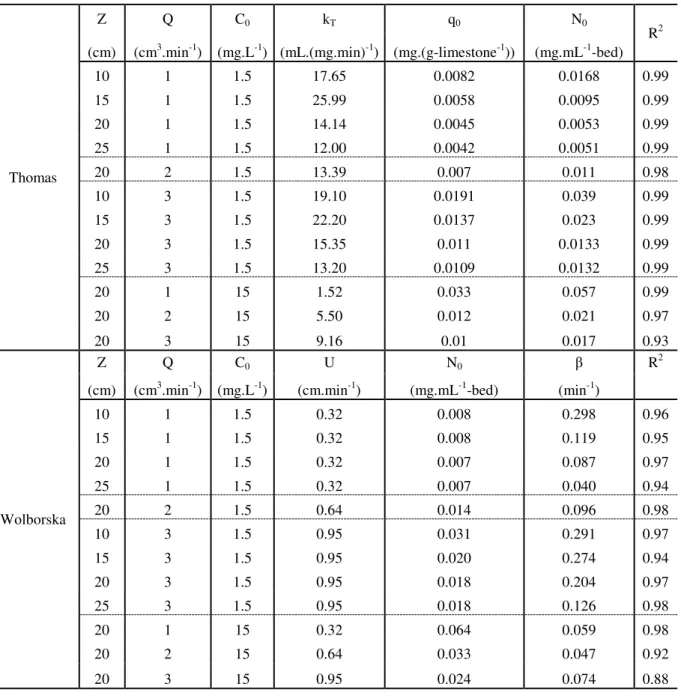
Table 2.4 - Parameters predicted by Thomas and Wolborska models for manganese sorption on calcite limestone. ... 34
Table 2.5 - Parameters predicted by the Yoon and Nelson and Dose-response equations for manganese sorption on calcite limestone. ... 35
Table 3.1 - Mine water composition before and after continuous manganese removal experiments, 12.5 g.L-1 CaCO 3, 0.67 g.L-1 Na2CO3. ... 54
Table 4.1 - Models equations applied for prediction of breakthrough curve. ... 79
Table 4.2 - Sulfate removal in batch experiments. Experimental conditions: 25.0 g.L-1 limestone, pH initial 6.5, 300 min-1, particle size 0,42-0,59 mm, 23±1°C. ... 81
Table 4.3 - Experimental values for fixed-bed sulfate sorption by limestone for different bed depths and flow rates. ... 87
Table 4.4 - Bed capacity, rate Constant and slope values for sulfate loading on limestone at different flow rates, according to the BDST model. ... 92
Table 4.6 - Parameters predicted using both Yoon and Nelson as well as Dose-response
Nomenclatura
a reaction order
AUR adsorbent exhaustion rate (g.mL-1)
C0 initial solute concentration (mg.L-1)
Ceq equilibrium solute concentration (mg.L-1)
Ct solute concentration at time t (mg.L-1)
EBCT empty bed contact time (min)
k rate constant [L.(min.g)-1]
kBA Adams-Bohart rate constant (mL.(mL.min)-1)
kT Thomas rate constant [L.(min.mg)-1]
kYN Yoon-Nelson rate constant (min-1)
m mass of sorbent in the column (g)
MTZ mass transfer zone (cm)
Nb Bed volumes at breakthrough
N0 sorptive capacity of the bed (mg.L-1)
Q flow rate (mL.min-1)
q0 solid concentration of the solute (mg.g-1)
qe equilibrium adsorption capacity (mg.g-1)
qmax maximum loading according to the Langmuir equation (mg.g-1)
qt adsorption capacity (mg.g-1) at time t
Rq ratio of the maximum sorption capacity
t time (min)
t0.5 time to 50% sorbate breakthrough (min)
tb Breakthrough time (min)
te exhaustion time (min)
U linear flow velocity of the feed to the bed (m.min-1)
Ut Fractional attainment of equilibrium
V solution volume (mL)
Vb volume of solution treated at the breakthrough point (dm3)
Ve exhaustion volume (mL)
Vef throughput volume (L)
Z bed height (cm)
Greek letters
Β kinetic coefficient of external mass transfer (min-1)
Capítulo 1
1.1 - Introdução
A indústria minero-metalúrgica é uma grande consumidora de água, e em vários de seus
diferentes processos esta é utilizada com especial destaque nas etapas de tratamento a úmido
de minérios. Merecem destaque os processos de tratamento de minérios (moagem,
espessamento, flotação, deslamagem, entre outros) e os que formam a chamada “Metalurgia
Extrativa dos Metais Não-Ferrosos”, mais especificamente os Processos Hidrometalúrgicos,
ou Hidrometalurgia. A Hidrometalurgia visa à produção de metais (ouro, prata, zinco,
cobre, níquel, cobalto, entre outros) através de reações que se realizam em meio aquoso. Os
impactos dessas atividades sobre os corpos de água são diversos, uma vez que se faz
necessário devolver aos leitos dos rios e lagos a água utilizada nesses processos de
produção. Porém, essa devolução não pode ser feita de qualquer maneira, já que existem
contaminantes que podem provocar danos ao meio ambiente. Os efluentes líquidos
industriais, por exemplo, precisam primeiro, ser tratados para retornar à natureza e, para
isso, existem políticas e normas a serem seguidas, que estabelecem a quantidade de
contaminantes que podem ser lançados no meio ambiente.
Os principais contaminantes encontrados nos efluentes da indústria mineral são os cátions
e ânions, como sulfato e cloreto, entre outros. As remoções do manganês e do sulfato são
consideradas, atualmente, um dos principais desafios no tratamento de efluentes da
indústria mineral no país. O manganês não é facilmente removido pelo fato de sua química
cobre, uma vez que sua precipitação não ocorre pelo simples ajuste do pH, a prática mais
utilizada na indústria. Além disso, como ocorre associado ao ferro, é muito comum nas
minerações, tanto de metais ferrosos quanto de não-ferrosos (Silva, 2007). A presença de
elevados teores de íons sulfato em efluentes líquidos é devida ao uso do ácido sulfúrico,
um reagente barato e estável, em diversos processos, como por exemplo: nas indústrias de
produção de cobre e de níquel; nas linhas de galvanização de aços; na produção de ácido
fosfórico; na remoção ácida de impurezas; entre outros (Rampinelli, 2007).Outra fonte de
poluição por sulfato na indústria mínero metalúrgica é a formação da drenagem ácida de
mina (DAM). A DAM é formada pela oxidação, catalisada por micro-organismos de
sulfetos de ferro como pirita (FeS2) e pirrotita (Fe1-xS). O baixo valor de pH da DAM
favorece a dissolução dos metais presentes na rocha e por isso diferentes íons metálicos
podem ser encontrados em elevadas concentrações dependendo da mineralogia da rocha.
Muitos desses íons são removidos durante o tratamento da DAM com substâncias
alcalinas, pois o aumento do pH provoca a precipitação de vários metais, entretanto,
elementos como, arsênio e manganês são de difícil remoção. Quando na rocha há a
presença de minerais portadores de alcalinidade, a acidez da DAM é neutralizada, tendo-se
a drenagem neutra de mina. Nesse caso, a concentração de metais dissolvidos é menor,
mas ainda podem ser encontrados níveis elevados de sulfato e de manganês.
Em termos de efeitos sobre a saúde humana, o manganês pode produzir irritação neuro
muscular (WHO, 1981). O consumo de água contaminada com sulfato em níveis elevados
deve ser evitado, principalmente por crianças e gestantes, pois ainda não são
completamente conhecidos os riscos à saúde humana decorrentes do consumo de teores
tóxicos, o descarte de efluentes líquidos é regulado pelo Conselho Nacional do Meio
Ambiente - CONAMA, através de sua Resolução nº 357 art. 24, e pelo Conselho Estadual
de Política Ambiental - COPAM / Conselho Estadual de Recursos Hídricos - CERH – MG,
através de sua Deliberação Normativa Conjunta 001, que afirmam: “os efluentes de
qualquer fonte poluidora somente poderão ser lançados, direta ou indiretamente, nos
corpos de água, após o devido tratamento e desde que obedeçam às condições, padrões e
exigências dispostos nesta (...) e em outras normas aplicáveis”. Segundo esses órgãos, o
padrão de lançamento contendo manganês para efluentes é de 1,0 mg.L-1 e para águas de Classe 2 é de 0,1 mg L-1, e o padrão de lançamento de sulfato é de 250,0 mg. L-1 para águas de Classe 2.
Segundo o International Network for Acid Prevention (2003), o tratamento de efluentes
contendo altos teores de sulfato, geralmente, inclui a combinação das etapas de
neutralização e precipitação com cal, osmose reversa, eletrodiálise, adsorção, troca iônica,
entre outras. Entretanto, algumas dessas técnicas têm sido pouco utilizadas, por serem
economicamente inviáveis ou ineficientes. A remoção de sulfato pode ser obtida por
precipitação com a adição de hidróxido de cálcio (Ca(OH)2) ou carbonato de cálcio
(CaCO3) (Garcia et. al., 2001). Entretanto, a concentração residual de sulfato, quando há
precipitação de gesso, situa-se entre 1500 e 2000 mg.L-1, ou seja, muito acima do requerido pela legislação. Kothari (1988) e Laus et al. (2005) observaram que a remoção de
manganês pode ser alcançada por meio de vários métodos e que o tipo de tratamento
depende da água a ser tratada. Podem ser citados como exemplos de métodos para a
remoção de manganês: a precipitação (Silva, 2007; Aziz et al., 2008), a troca iônica
(Dayube e Trindade, 2004) e a adsorção (Babel e Kurniawan, 2003; Mohan e Chander,
Dentre os métodos de remoção de manganês e sulfato citados, a adsorção é uma das
técnicas mais aplicadas no mundo. Viu-se na aplicação da técnica e na utilização do
calcário uma opção para remoção do manganês e do sulfato, pois o calcário é um material
amplamente disponível no país e pode ser uma alternativa viável para esse processo de
remoção, ao se considerar a aplicabilidade técnica, a simplicidade do processo e o
custo-eficácia como sendo fatores chaves na escolha do tratamento mais adequado para efluentes
inorgânicos (Sengupta, 1993; Silva, 2007; Barakat, 2008). Por outro lado, os efluentes das
minerações brasileiras contêm teores de manganês maiores que os encontrados em outras
águas de mina ao redor do mundo. Estes elevados teores não são facilmente removíveis
apenas por adsorção, dessa forma, outras técnicas, como a precipitação, precisam ser
avaliadas, sendo a precipitação com o íon carbonato solúvel uma das alternativas em
potencial. A remoção dos metais presentes em um efluente industrial é feita, normalmente,
pela elevação do valor do pH até que os metais tenham sua concentração em solução
reduzida ao limite requerido pela legislação, entretanto, para os elementos cuja química em
solução é mais complexa, como é o caso do manganês e o sulfato, essa alternativa não é
efetiva. No processo de remoção de manganês, é preciso ter em conta a sua origem, a
forma com que este elemento se encontra presente na água, a sua concentração, a
quantidade de água a tratar e os aspectos econômicos (Dayube e Trindade, 2004).
1.2 – Parâmetros e Processos
Existem parâmetros importantes para a avaliação de qualquer sistema de remoção do
manganês e do sulfato de efluentes industriais, como: concentração dos contaminantes,
valor do pH inicial, tipo de agente precipitante ou adsorvente, tamanho de partícula do
As Tabelas 1.1 e 1.2 contêm, de forma sucinta, alguns trabalhos de remoção de manganês e sulfato, respectivamente, com as suas respectivas técnicas utilizadas, concentrações das espécies e a percentagem de remoção do contaminante para cada estudo.
Tabela 1.1 – Resumo de alguns trabalhos de remoção de manganês com calcário.
Autor Concentração manganês
(mg.L-1)
Remoção
(%) Técnica
Tamanho de partícula
(mm)
Aziz (1992) 1,0
Solução sintética 95 Adsorção 3,35 a 4,76
Aziz (1996) 1,0
Solução sintética 97 Adsorção 2,0 a 4,0
Hammastrom et al.
(2003) 9,8 – DAM 2,04 Adsorção 0,14 a 0,86
Bamforth et al.
(2006) 2,6 a 3,0 – DAM 23 Precipitação 1,0 a 2,0
Silva (2007) Solução sintética 0 a 155,0 100 Precipitação <0,045
Silva (2007) 16,5 – DAM 100 Precipitação <0,045
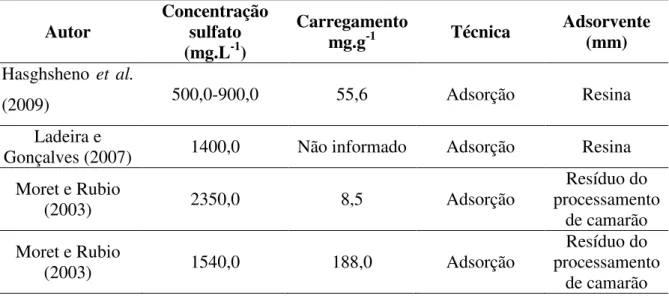
Nos resultados obtidos nos diferentes artigos, observa-se que a maioria dos autores utilizou
solução de manganês com concentração baixa (<10,0 mg.L-1). Já nos artigos referentes à
remoção de sulfato, usam como adsorvente resinas de troca iônica (Haghsheno et al. 2009),
Ladeira e Gonçalves (2007), Feng et al. 2000)), zeólitas (Oliveira, 2006), goetita (Rietra et
al., 1999 e Xu et al., 2006) ou adsorventes alternativos, como resíduo do processamento de
camarão (Moret e Rubio, 2003) e celulose extraída do bagaço de cana de açúcar (Mulinari
Tabela 1.2 – Resumo de alguns trabalhos de remoção de sulfato.
Autor Concentração sulfato
(mg.L-1)
Carregamento
mg.g-1 Técnica Adsorvente (mm)
Hasghsheno et al.
(2009) 500,0-900,0 55,6 Adsorção Resina
Ladeira e
Gonçalves (2007) 1400,0 Não informado Adsorção Resina
Moret e Rubio
(2003) 2350,0 8,5 Adsorção
Resíduo do processamento
de camarão Moret e Rubio
(2003) 1540,0 188,0 Adsorção
Resíduo do processamento
de camarão
O presente projeto caracteriza-se pelo desenvolvimento de um processo para a remoção de
sulfato e de manganês, com alta concentração, de efluentes da indústria mineral; esse
estudo justifica-se uma vez que a indústria mineral tem solicitado à comunidade científica
o desenvolvimento de tecnologia para remoção de manganês e sulfato de seus efluentes,
como uma etapa para a recirculação de água na indústria.
Dessa forma, a presente tese de Doutorado, parte integrante do projeto CT-HIDRO
040/2006, foi realizada com o intuito de estudar como o sulfato e o manganês são
removidos com a utilização do calcário e/ou carbonatos solúveis. Como parte dos
resultados desta tese, tem-se a publicação dos três artigos científicos submetidos a
periódicos internacionais, apresentados nesta Tese.
1. 3 – Atividades Desenvolvidas e Organização da Tese
posteriormente, um efluente da indústria minero-metalúrgica. Trata-se de uma drenagem
neutra de mina (pH 6,5) contendo elevados teores de manganês (até 140 mg.L-1) e
moderados níveis de sulfato (600-1100 mg.L-1). Os objetivos específicos foram:
Realizar ensaios de remoção de manganês e sulfato, em sistema batelada e
contínuo, em reatores de mistura perfeita e em coluna de leito fixo, com soluções
sintéticas e efluentes da indústria minero-metalúrgica;
Observar a influência do tempo de ensaio e da massa de carbonatos (calcário e
carbonato de sódio) na remoção do manganês, por precipitação.
Observar a influência do tempo de ensaio e a massa de calcário na remoção do
sulfato;
Observar o carregamento de manganês e de sulfato em sistemas de adsorção em
leito fixo;
Caracterizar os resíduos sólidos obtidos durante o processo de remoção em sistema
batelada e contínuo, por meio das técnicas de Espectroscopia no Infravermelho (IR)
e Microscopia eletrônica de varredura (MEV).
A tese foi organizada em Capítulos, sendo que no Capítulo 2 será apresentado o artigo
Fixed-bed and stirred-tank studies of manganese sorption by calcite limestone, onde será
discutida a adsorção em calcário de baixas concentrações de manganês (1,5 a 15,0 mg.L-1)
contido em drenagem de mina. Este artigo foi submetido ao periódico “Industrial &
Engineering Chemistry Research”
No Capítulo 3 será apresentado o artigo Treatment of high-manganese mine water with
Neste artigo será investigada remoção de altas concentrações do manganês (140,0 mg.L-1 ) de água de mina com a utilização de calcário combinado com carbonato de sódio.
No Capítulo 4 será apresentado o artigo Mine water treatment with limestone for sulfate
removal, o qual aborda a adsorção do sulfato em calcário como um dos métodos para a
remoção do elemento de água de mina. Este artigo foi submetido ao periódico “Journal of
Hazardous Materials”
As considerações finais discutem a aplicabilidade dos estudos a águas de minas contendo
sulfato e manganês.
1. 4 – Referências Bibliográficas
AZIZ, H. A., SMITH, P. G. (1992). The influence of pH and coarse media on manganese
precipitation from water. Water Research, 6, pp.853-855.
AZIZ, H. A., SMITH, P. G. (1996). Removal of manganese from water using crushed dolomite filtration technique. Water Research , 2, pp.489-492.
AZIZ, H. A., ADLAN, M. N., ARIFFIN, K. S. (2008). Heavy metalsCd, Pb, Zn, Ni, Cu
and Cr (III) removal from water in Malaysia: Post treatment by high quality limestone. Bioresource Technology, 99, pp. 1578-1583.
BABEL, S., KURNIAWAN, T.A. (2003). A research study on Cr (VI) removal from contaminated waswater using natural zeolit. Ion Exchange, 14, pp. 289-292.
BAMFORTH, (2006).
BARAKAT, M. A. (2008). Adsorption of heavy metals from aqueous solutions on
synthetic zeolite. Research Journal of Environmental Sciences 2 (1), pp. 13-22.
CONAMA - Conselho Nacional do Meio Ambiente - Resolução nº 357, 17/03/2005.
www.mma.gov.br– (acesso 23/03/2006).
baixa concentração em drenagem ácida de minas. www.cetem.gov.br (acesso 26/07/2006).
Deliberação Normativa Conjunta do Conselho Estadual de Política Ambiental
(COPAM) / Conselho Estadual de Recursos Hídricos (CERH) / MG 001 de
05/05/2008, (acesso 10.07/2010).
EMMANUEL, K. A., VEERABHADRA RAO, A. (2009). Comparative stud on
Adsorption of Mn (II) from aqueous solutions on various activated carbons. E-Journal of chemistry 6 (3), pp. 693-704.
FENG, D., ALDRICH, C., TAN, H. (2000). Treatment of acid mine water by use of heavy metal precipitation and ion exchange. Minerals Engineering, 13, 6, pp. 623-642.
GARCIA, C., MORENO, A. D., BALLESTER, A., BLÁZQUEZ, M. L., GONZÁLEZ (2001). Bioremediation of an industrial acid mine water by metal-tolerant sulphate-reducing bacteria. Minerals Engineering, 14(9), pp. 997-1008.
HAGHSHENO, R., MOHEBBI, A., HASHEMIPOUR, H., SARRAFI, A. (2009).
Study of kinetic and fixed bed operation of removal of sulfate anions from an industrial wastewater by an anion exchange resin. Journal of Hazardous Materials 166, pp. 961-966.
INAP – International Network for Acid Prevention: Treatment of sulfate in mine
effluents – Lorax Environmental. Outubro de 2003, 129 páginas.
www.inap.com.au/public_donloads/Research_Projectsem/Treatment_of_sulphate_in_Mine
_Effluents_-_Lorax_Report.pdf, acesso30/06/2011.
KOTHARI, N. (1988). Groundwater, Iron and manganese: An unwelcome trio –
Water/Engineering & Management, pp. 25-26.
LADEIRA, A. C., GONÇALVES, C. R. (2007). Influence of anionic species on uranium
separation from acid mine water using strong base resins. Journal of Hazardous Materials, pp. 499-504.
LAUS, R., LARANJEIRA, M. C. M., MARTINS, A.O., FÁVERE, V. T., PEDROSA,
R. C., BENASSI, J. C., GEREMIAS, R. (2005). Chitosan microspheres crosslinked with
tripolyphosphate used for the removal of the acidity, iron (III) and manganese (II) in water contaminated in coal mining, Química Nova, pp.1-13.
LEE, S.; TIWARI, D.; CHOI, K., YANG, J.; CHANG, Y.; LEE, H. (2009). Removal
MOHAN, D., CHANDER, S. (2006). Removal and recory ofmetals ions from acid mine drainage using lignite – A low cost sorbent. Journal of Hazardous Materials B 137, pp. 1545-1553.
MORET, A., RUBIO, J. (2003). Sulfate and molybdate ions uptake by chitin-based shirimp shells. Minerals Engineering, 16, pp. 715-722.
MULINARI, D. e SILVA, M. L. C. P. (2008). Application of coconut coir pith for the
removal sulphate and other anions from water. Desalination, 219, pp.1 – 13.
OLIVEIRA, C. R. (2006). Adsorção – remoção de sulfato e isopropilxantato em zeólita
natural funcionalizada. 107 páginas. Dissertação de mestrado – Universidade Federal do Rio Grande do Sul.
RAMPINELLI, L. R. (2007). Isolamento e caracterização de uma nova espécie de
bactéria redutora de sulfato obtida de drenagem ácida de Mina. 85 páginas. Dissertação de mestrado. Universidade Federal de Ouro Preto.
RIETRA, R. P. J. J., HIEMSTRA, T., van RIEMSDIJK, W. H. (1999). Sulfate
adsorption on goethite. Journal of Colloid and Interface Science, 218, pp. 511-521.,
SENGUPTA, M. (1993). Environmental impacts of mining monitoring, restoration and control, 1ªed., Florida: Boca Raton. - Lewis Publishers. Chapter 5: Acid Rock Drainage and Metal Migration, pp. 167 – 259; Chapter 8: Wetlands, pp. 325 – 424.
SILVA, A. M. (2007). Remoção do manganês de efluentes industriais utilizando calcário.
Dissertação de Mestrado – REDEMAT/UFOP.
WHO - World Health Organization (1981). Manganese. Geneva. Environmental Health
Criteria, 17.
WHO - World Health Organization (2004). Sulphate in Drinking water. Background for
development of WHO Guidelines for Drinking water quality. Geneva. Environmental Health Criteria, acesso em 30/06/2011.
XU, N., HOCHELLA, N., BROWN, M. F., PARKS, G. A. (1996). Co (II) sorption at
Capítulo 2
Fixed-bed and stirred-tank studies of manganese sorption by calcite
limestone
Adarlêne M. Silva, Fabrício C. M. Cordeiro, Emannoelle C. Cunha, Versiane A. Leão
Bio&Hydrometallurgy Laboratory. Universidade Federal de Ouro Preto.
Campus Morro do Cruzeiro, Ouro Preto, MG, 35400-000, Brazil.
Phone: +55.31.3559.1102, Fax +55.31.3559.1561
versiane@demet.em.ufop.br; adarlenems@gmail.com.
Corresponding author:
Versiane Albis Leão
Bio&Hydrometallurgy Laboratories.
Department of Metallurgical and Materials Engineering.
Campus Morro do Cruzeiro, s.n., Bauxita, Ouro Preto, MG, 35400-000, Brazil.
Tel.: +55.31.3559.1102
Fax.:+55.31.3559.1561
Abstract
This study addressed manganese removal from mine waters in stirred-tank as well as fixed
bed experiments. Manganese sorption in limestone is a slow process, which can be
described by pseudofirst order kinetics. Equilibrium sorption could be successfully
modeled by the Freundlich and Langmuir isotherms, and limestone showed a maximum
manganese loading of 0.91 mg.g-1. Fixed-bed sorption was also studied, and limestone
uptake was observed to increase with the flow rate at low manganese concentration
(1.5 mg.L-1) but decreased for mine water containing 15 mgMn.L-1. The Bed Depth Service Time (BDST), Thomas, Yoon and Nelson, Wolborska and Dose response models
were fitted to breakthrough curves to determine the characteristic design parameters of the
column. With the exception of the Wolborska model, all studied equations could describe
the sorption process well. The maximum uptake was 0.0033 mg.g-1 for a 15 mg.L-1 manganese solution at 1 mL.min-1, and zeta potential determinations showed that the limestone surfaces were negatively charged. The solid residues obtained during the
removal process were characterized using infrared spectroscopy (FTIR) and scanning
electron microscopy (SEM) to identify the reaction product. The presence of manganese
carbonate (MnCO3) on the limestone surface was verified during the experiments with
mine water.
2.1 - Introduction
Water in the mining industry has been a source of concern because of its contamination by
toxic metals and other substances that require treatment before discharge. Such treatments
must be carried out using operations and processes that aim to reduce the contaminant
concentration to levels required by environmental regulations or alternatively to those that
enable water recycling in the production process. Manganese removal is one of the most
difficult challenges for water management in the mining industry. The removal of this and
other elements is one of the required steps for effective water recycling.
Manganese is one of the most abundant toxic elements in both superficial and underground
waters (Aziz and Smith, 1996; Franklin and Morse, 1983) as well as in the effluents and
drainages of several mining companies. Its solubility in natural waters is influenced by
such factors as redox potential, pH and the presence of complexing agents such as
bicarbonate and sulfate (Hem and Lind, 1994). Nevertheless, manganese is usually present
in mining effluents as Mn2+.
Manganese removal from wastewaters can be carried out by different approaches (Kothari,
1988; Laus et al., 2006). Mn2+ oxidation and precipitation as MnO2 followed by
clarification is a common method. Oxidation can be performed by applying strong
oxidizing agents such as potassium permanganate, hypochlorite or ozone (Silva et al.,
2010). Nevertheless, the presence of both ferrous iron and organic matter increases oxidant
consumption such that iron removal is required prior to manganese oxidation. Manganese
can also be removed by precipitation as manganese carbonate (MnCO3) in the presence of
alkalinity (Hem and Lind, 1994) or bio-oxidized to Mn(III), precipitating as
Limestone is commonly used as a neutralizer for acid effluents and acid mine drainages
(Sun et al., 2000). Limestone was studied as a reactive barrier for acidic waters (pH 2.2),
and its efficiency was compared with that of red mud (Komnitsas et al., 2004). Limestone
increased the solution pH to 8, which facilitated iron and aluminum removal, while
manganese and zinc uptakes were not as effective because the solution pH decreased when
reactivity was lost as a result of iron precipitation over the limestone surface. For neutral
drainages, limestone can also be applied as an adsorbent for toxic metals. Aziz et al. (2008)
studied the sorption of a series of metals (Cu, Zn, Pb, Cd, Ni, Cr) on limestone in batch
experiments where monovalent metal solutions (2 mg.L-1) were equilibrated with powdered limestone (2.36-4.77 mm) at pH 8.5. The sorption data were fitted to the
Langmuir isotherm, and nickel showed the highest loading (38 mg.Kg-1 limestone) compared with the other metals. Similarly, experiments were performed for lead and
cadmium sorption at neutral pH (5.0-7.0). Lead (40 mg.Kg-1) showed a higher affinity for limestone compared with cadmium (1 mg.Kg-1); this was attributed to a stronger interaction with the limestone surface due to a smaller hydrated ionic radius
(Rangel-Porras et al., 2010).
Early studies on Mn2+ calcite interactions indicated strong sorption at low concentrations (below MnCO3 solubility) (Franklin and Morse, 1983). The lack of a sorption maximum
was interpreted to be an indication that both precipitation as well as adsorption accounted
for Mn2+ uptake by calcite. Zachara et al. (1991) suggested that manganese sorption on
calcium carbonate occurs by either sorption, precipitation on the solid surface or formation
of solid MeCO3(s)-CaCO3(s) solutions. Manganese carbonate or hydroxide formation was
Despite its widespread use as neutralizer for acidic effluents, the application of limestone
in the treatment of neutral drainages and effluents is far less studied. In addition, no
comprehensive investigation has been undertaken regarding its utilization in fixed bed
sorption of manganese, which is considered the most difficult toxic metal to remove from
mine waters. Therefore, this work was undertaken to study the potential of applying
limestone for manganese sorption in both stirred and fixed bed reactors.
2.2 - Materials and methods
2.2.1 - Calcite limestone and mine waters
A limestone sample (2.68 ton/m3) assaying 40.3% calcium and 1.23% magnesium was kindly provided by Brazilian producers. Calcite was confirmed as the main mineral phase
by XRD diffraction. The solid material was first dry sieved using Tyler sieves and the
<45 mm fraction was selected for dry grinding in a vibrating cup mill (Pulverisette 9,
Fritsch). Its particle size distribution was assessed by laser diffraction (CILAS -
Compagnie Industrielle Des Lasers 1064) and resulted in a d50 value of 8.6 µm. Surface
and micropore areas were determined as 1.54 m2.g-1 and 1.90 m2.g-1, respectively, by N 2
adsorption (Nova 1000, Quantachrome). This solid sample was utilized in experiments in a
stirred reactor. Another limestone sample with a particle size between 590 µm and 850 µm
(0.569 m2.g-1 specific surface area, 0.365 m2.g-1 micropore area) was tested in both equilibrium and fixed bed experiments.
2.2.2 - Stirred-tank experiments
Preliminary manganese removal experiments were carried out batchwise with the low
manganese mine water (1.5 mg.L-1). A volume of 0.12 L of mine water was transferred to
erlenmeyer (0.25 L capacity) flasks and mixed with fine calcite limestone (d50= 8.6 µm) to
produce different pulp densities. The pulp was stirred in an orbital shaker (News
Brunswick) at 300 min-1, pH 8.0 and 232oC, during 10 hours. At the end of the
experiment, the pH was measured, the pulp was filtered (45 µm porosity), and the
manganese concentration in the aqueous phase was determined. This experiment was
performed to define the mass of limestone and the residence time for continuous testing.
Continuous experiments were carried out in a 1.67 L capacity stirred reactor at 232oC and
pH 8.0 with the low-manganese water (1.5 mg.L-1). The latter was fed separately with (i)
mine water and (ii) a pulp made up of limestone and distilled water. The solid content of
the pulp was defined so that 4.2 g.L-1 limestone was achieved within the reactor (after mixing both streams). Both flows were pumped at 24.0 mL.min-1 (mine water) and
4.0 mL.min-1 (limestone pulp) into the reactor. The residence time was set at 60 minutes, and experiments were run for at least 9 residence times to ensure steady-state conditions.
Every 60 minutes, an aliquot was withdrawn from the reactor, filtered and the manganese
content was determined by ICP-OES (Varian, 725); the solid residue was preserved for
further analysis (MEV-EDS and infrared spectrophotometry). Prior to and during the
experiments, the mine water was stored in plastic containers at room temperature.
2.2.3 - Kinetics experiments
Kinetics modeling was applied to the sorption data and the pseudo-first-order and
pseudosecond-order models were tested. These experiments were performed by mixing
1.5 L of the low manganese water at pH 8.0 containing 1.5 mg.L-1 Mn2+ and 25 g.L-1
limestone in an orbital shaker at 300 min-1 and 232oC. Another experiment was carried
out following the same procedure with the 15 mg.L-1 Mn2+ mine water at pH 6.5 (initial
value), which increased to 7.7 during the experiment. In both cases, samples were
withdrawn after 5 minutes in the first half hour and after 1, 2, 3, 4, 5, 6, 8 and 24 hours. At
the end of the experiment, the pulp pH was measured, the slurry was filtered, and the
manganese concentration in the aqueous phase was determined. Manganese concentration
in the solid phase was determined by mass balance.
2.2.4 - Equilibrium experiments
A pseudo-sorption isotherm was drawn from the batch data using synthetic solution so that
the maximum limestone loading could be assessed. The procedure involved shaking at
300 min-1 in an orbital shaker, 0.12 L of the limestone pulp (3 g.L-1 solids) added to 0.25 L erlenmeyer flasks. Manganese concentrations varied from 1.5 to 25 mg.L-1 at pH 8.6-8.9
and the experiments were run for 10 hours. Afterwards, the sorption process was modeled
according to the Freundlich and Langmuir isotherms.
2.2.5 - Fixed –bed experiments
These experiments were performed with the low and high manganese mine waters
size range) were transferred to a glass column (2 cm diameter). The column to particle
diameter ratio was approximately 23, which is considered sufficient to minimize wall
effect. Glass wood felts were placed on the top and bottom of the fixed bed to prevent loss
of the solid particles. Experiments were carried out with bed heights (Z) varying from 100
to 250 mm, which correspond to a limestone mass ranging from 38.57 to 98.71 g. The
column height exceeds 100 particle diameters, thus backmixing may be disregarded. After
loading, distilled water was passed through the limestone bed (during 60 min) to remove
any fine particles that could have been loaded in the column. The column was fed upward
by peristaltic pumps (Milan) to either avoid or minimize low resistance pathways for the
solution, and the flow rate was varied from 1 to 3 mL.min-1. Effluent samples were
collected from the column every 30 minutes. These samples were then analyzed with
respect to manganese concentration, and metal loading on limestone was determined by
mass balance.
2.2.6 - Sorption characterization
A limestone sample was pulverized (d90<10 µm) and analyzed in a Zetasizer Nano ZS
zetameter (Malvern). A pulp containing 0.5% solid and deionized water was prepared
under agitation, and either NaOH or HCl was used to obtain the desired pH (6-12).
Scanning electron microscopy (SEM) was used to examine the morphology of the leach
residues. The samples were coated with graphite by electro-deposition using a JEOL JEE
4C instrument and investigated by a JEOL JSM 5510 scanning electron microscope (SEM)
with an accelerating voltage 0.5–30 kV equipped with a spectrometer for micro-analysis
Infrared spectroscopy (FTIR) analyses were carried out in a Nicolet Nexus 470 model
spectrophotometer equipped with a Centaurus microscope, an attenuated total reflectance
(ATR) apparatus (Thermo) and a ZnSe internal reflection device. Medium infrared
measurements were produced with a KBr beam splitter and a HgCdTe detector. The
samples were pressed against a flat glass surface and mounted under the ATR apparatus.
The spectra were collected in the 400-4000 cm-1 region with a minimum of 32 scans at a resolution of 4 cm-1.
Both mine waters were analyzed before and after the experiments with respect to metal
concentration by inductively coupled plasma optical emission spectrometry (ICP-OES,
Varian 725) or atomic absorption spectrometry (AAS) (Perkin Elmer AAnalist 100).
Unless otherwise stated, the detection limit for manganese was determined using the
procedure proposed by Osório Neto (1996) and was calculated to be 0.02 mg.L-1.
2.3 - Modeling
Batchwise sorption kinetic models have been extensively discussed in the literature, and a
review can be found in the work of Qiu et al. (2009). Here, this matter will be briefly
reviewed.
Manganese loading kinetics on limestone can be modeled according to the general
differential equation
at e tq
t q
q q k d d
Pseudo-first-order kinetics is followed when a = 1, and by integrating equation 2.1
equation 2.2 is achieved. A plot of ln(1-U) versus t produces a straight line.
1Ut
ktln with
eq o t o eq t t C C C C q q U
(2.2)
For a = 2, pseudo-second-order kinetics are observed, and upon integration for the
boundary conditions t = 0 to t = t and qt = 0 to qt = qt the following expression can be
written:
kt q q
qeq t e
1 ) ( 1 or eq t t q t kq q
t
2
1 (2.3)
Equations 2.2 and 2.3 were applied to model batch manganese sorption kinetics on
limestone.
Different models were applied to the breakthrough curves, namely, (i) Bohart-Adams
(1920), (ii) Thomas (1944), (iii) Yoon and Nelson (1984), (iv) Wolborska (1989) and (v)
Dose-response (Yan et al., 2001). The Bohart-Adams equation was applied in the Bed
Depth Service Time (BDST) model. These models have also been reviewed (Singh et al.,
2009; Wolborska, 1989; Yan et al., 2001), and the corresponding equations are presented
in Table 2.1. The Bohart-Adams model assumes that the sorption rate is controlled by
surface reaction, which is proportional to both the sorbent residual capacity and the
the Langmuir equation and that sorption kinetics is described by a second-order reversible
equation. Therefore, this model is suitable for sorption processes that are not controlled by
film or surface diffusion. The main assumption of the Yoon and Nelson model is that the
rate of decrease in the sorption probability of each molecule is proportional to the
probability of sorbate sorption and that of sorbate breakthrough (Calero et al., 2009).
Wolborska (1989) aimed to model the low-concentration region of the breakthrough curve
during mass transfer control by either film or axial diffusion.
Table 2.1 - Model equations applied to predict breakthrough curves.
Model Equation Reference
Bohart-Adams
t kC U Z kN C C 0 0
0 1 exp
1 Bohart-Adams (1920) Thomas Q V kC Q m kq C C 0 0
0 1 exp
1
Thomas (1944)
Yoon and Nelson
0.5
5 . 0 0 1 expexp t k t k t k t k C C yn yn yn yn
Yoon and Nelson
(1984) Wolborska U Z t N C C C o o 0
ln Wolborska (1989)
Dose-response a
mq VC C C 0 0 0 1 1 1
Yan et al., 2001
The model applies to the linear part of a ln(C/C0) versus t curve in which both the
adsorbate concentration in solution and at the sorbent at a determined level of the bed is
considered constant and mass transfer is at a steady state. Finally, the modified
Dose-response model is an empirical equation proposed by Yan et al. (2001) to model fixed-bed
biosorption, which was later applied to zinc (Senthilkumar et al., 2006) and chromium
2.4 - Results and discussions
In this work, two approaches were studied to investigate manganese removal by limestone, namely, (i) manganese sorption by finely powdered limestone in a stirred reactor and (ii) manganese removal in fixed-bed columns.
2.4.1- Experiments in stirred tank with fine ground limestone
Preliminary batch experiments using manganese-laden mining water (Table 2.2) were
carried out to verify the mass of fine powdered material (<45 mm, d50 = 8.6 µm) required
for metal removal (C0 = 1.5 mg.L-1), and the value of 4.2 g.L-1 was chosen. This value
enabled the manganese concentration to be reduced from 1.5 mg.L-1 to 0.28 mg.L-1 within
60 minutes; this time was considered to be the residence time in the subsequent continuous
experiments.
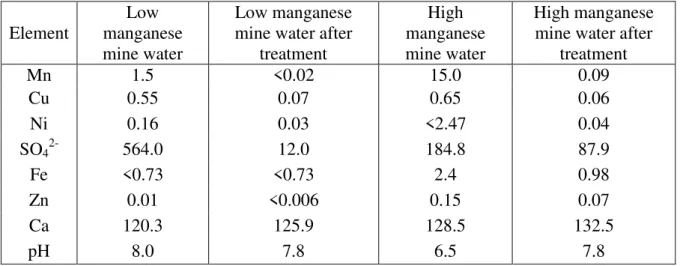
As shown in Table 2.2, in addition to sulfate, the low manganese mine water contained
1.5 mg.L-1 manganese while the high-manganese mine water contained 15.0 mg.L-1 manganese.
Table 2.2 - Mine water composition studied in this work. Values are in mg.L-1.
Element
Low manganese mine water
Low manganese mine water after
treatment
High manganese mine water
High manganese mine water after
treatment
Mn 1.5 <0.02 15.0 0.09
Cu 0.55 0.07 0.65 0.06
Ni 0.16 0.03 <2.47 0.04
SO42- 564.0 12.0 184.8 87.9
Fe <0.73 <0.73 2.4 0.98
Zn 0.01 <0.006 0.15 0.07
Ca 120.3 125.9 128.5 132.5
Figure 2.1 shows the influence of time in both manganese removal and pulp pH for the
low-manganese mine water (1.5 mg.L-1) in a continuous experiment. Both manganese
removal and the pH increased with time. Within 60 minutes, the residual manganese
concentration reached 1.28 mg.L-1, and the solution pH was 8.6; after 300 min, the pH level increased to 8.8, and the manganese concentration was reduced to 0.1 mg.L-1; after 9
residence times, the residual manganese concentration was 0.07 mg.L-1 and this corresponds to a loading of 0.34 mg Mn.g-1 limestone. Franklin and Morse (1983) observed
manganese removal to be defined by the mass of limestone but not by the initial
manganese concentration. The authors also observed metal removals varying from 90 to
99% from diluted manganese solutions (0.55 mg.L-1) whereas Silva
et al. (2010) noticed
that by increasing the limestone mass in the pulp the residual manganese concentration
decreased.
Figure 2.1 - Influence of time on manganese removal and pH from an industrial effluent
containing 1.5 mg.L-1. Continuous experiment, 4.2 g.L-1 of limestone <0.045 mm, initial
pH 8.0 and 23±2°C.
0 100 200 300 400 500 600
8.0 8.2 8.4 8.6 8.8
pH
0.00 0.25 0.50 0.75 1.00 1.25 1.50
Mn conc. pH
Time (min)
Mn
2+
c
o
n
c.
(m
g
.L
-1
Under similar experimental conditions, (1.64 L reactor, 60 minutes residence time and
23±2oC), Silva et al. (2010) studied the effect of pH on manganese removal from mine
waters and observed 97% removal from a 15.0 mg.L-1 manganese-containing mine water at pH 8.3-8.5 in the presence of 20.8 g.L-1 calcite limestone (0.77 mgMn.g-1 limestone). Therefore, stirred-reactor sorption can be an option for treating mine waters containing low
to moderate manganese concentrations, as was also pointed out by Rose et al. (2003) in a
review of AMD treatment with limestone.
In addition to manganese, other metals present in the mine water were also removed from
the low manganese water as shown in Table 2.2. The sulfate concentration in particular
decreased from 564.0 mg.L-1 to 12.0 mg.L-1, indicating the high sorption affinity between sulfate and limestone. This observation is consistent with the work of Silva et al. (2010),
which revealed the presence of sulfate on a limestone surface after mixing with mine
water. Notwithstanding, this phenomenon is currently being investigated.
2.4.2 - Experiments with the coarser limestone particles
Given the low manganese concentration in the mine water, fixed-bed sorption is also an
alternative method of manganese removal because sorption is especially suitable for the
treatment of low-concentration effluents. In this regard, a series of experiments were
carried out with the two mine water samples (Table 2.2) and a coarser (590-850 µm)
2.4.3 - Kinetics testing
First, the manganese sorption kinetics in the coarser particle size fraction was assessed.
Figure 2.2a depicts the influence of time on manganese removal in a batch system for both
low and high manganese mine waters. For the experiment carried out with 15.0 mg.L-1
manganese mine water, it can be observed in Figure 2.2a that a fast reduction in
manganese concentration occurred within the first 15 min, followed by a slower step
between 15 min and 60 min and a third phase (60–180 min), when the removal kinetics
increase again. Therefore, both the pseudofirst order and the pseudosecond order models
could not successfully describe the sorption kinetics. This is because such simple models
sometimes cannot account for sorption on solid surfaces, which are usually
inhomogeneous. Furthermore, the sorption mechanism can be complex.
Figure 2.2 - Variation of manganese concentration with time (a) and fitting to the
pseudofirst order model (b). Experimental conditions: 37.5 g.L-1 limestone, 1.5 L
manganese solution, 1.5 mg.L-1 and pH 8.0 or 15 mg.L-1 and pH 6.5, 23±2°C.
However, if a two-step sorption process is considered, the entire sorption process can be
modeled by applying a pseudo-first-order model Figure 2.2b. The manganese sorption can
be described by a rate constant value of 2.2x10⁻³ L.g-1.min-1 (r2 = 0.95), during the first
0 60 120 180 240 300 360 420 480 540 600
0.0 0.5 1.0 1.5 8 10 12 14 16 a [Mn2+
]0 = 1.5mg/L
[Mn2+
]0 = 15mg/L
C on cn et ra çã o re si du al M n
2+ (m
g.
L
-1 )
Tempo (min)
0 100 200 300 400 500
-9 -8 -7 -6 -5 -4 -1.0 -0.8 -0.6 -0.4 -0.2 0.0 b 1o [Mn2+
]0 = 15.0mg.L-1 y = -0.0057t - 3.12 [Mn2+
]0 = 15.0mg.L-1 y = -0.002t - 0.061
[Mn2+
]0 = 1.5mg.L -1
y = -0.0118t - 5.82 [Mn2+]
0 = 1.5mg.L -1
y = -0.005t - 0.092
60 min, which increases to 5.8x10⁻³ L.g-1.min-1 (r2 = 0.97) in the 180-480 min range (in the experiments with 15.0 mg.L-1 Mn2+). The different values for the rate constant characterize
manganese sorption as a multiple pseudofirst order process (Ho and McKay, 1999),
representing different sorption mechanisms. The first stage corresponds to the binding of
manganese atoms to the active sites on the adsorbent surface and manganese carbonate
nucleation. Afterward, this manganese carbonate acts as a catalyst for further sorption on
the adsorbent surface (Franklin and Morse, 1983). This sorption mechanism will be
discussed later in this work.
For the experiment with 1.5 mg.L-1, the sorption process was faster, and the rate constants
were increased to 4.98x10⁻³ and 11.8x10⁻³ L.g-1.min-1 (r2 = 0.95) for the first and second stages, respectively. These values are consistent with those found by Franklin and Morse
(1983), who also observed that manganese sorption follows a pseudofirst order model with
a rate constant of 3.0 L.g-1.min-1. When both manganese concentrations are compared, for a ten-fold increase in the manganese concentration, there is an approximately 50% reduction
in the rate constant values.
2.4.4 - Equilibrium experiments
After defining the time required for sorption equilibrium, a pseudo-sorption isotherm was
produced so that the maximum sorption capacity could be determined (Figure 2.3). The
sorption process can be described by both the Freundlich (r2 = 0.98) and Langmuir
maximum uptake value of 0.0034 mg.g-1, whereas Aziz et al. (2008) observed limestone
loadings varying from 0.012 mg.g-1 (Zn) to 0.038 mg.g-1 (Ni) while studying Cu, Zn, Ni,
Pb, Cd and Cr(III) on limestone. These values are lower than that observed for manganese
sorption on zeolites (7.1 mg.g-1), for instance (Taffarel and Rubio, 2009).
Figure 2.3 - Manganese sorption isotherm at 23±2oC and pH 6.5.
2.4.5 - Fixed-bed experiments
Fixed-bed experiments were performed to study the effects of bed height, flow rate and
initial metal concentration on manganese sorption by limestone. Table 2.3 depicts the most
important experimental parameters of the breakthrough curves presented in Figure 2.4. The
breakthrough point was defined as 0.05 C0 and the saturation point was defined as 0.95 C0.
0 20 40 60 80 100 120
0.0 0.2 0.4 0.6 0.8 1.0 1.2
Langmuir r2 = 0.981 Freundlich
r2 = 0.978
Ceq (mgMn2+.L-1)
Q
eq
(m
g M
n