Typhi-Specific CD8
+
T Cells in Volunteers following
Ty21a Typhoid Immunization
Monica A. McArthur1,2, Marcelo B. Sztein1,2*
1Center for Vaccine Development, University of Maryland School of Medicine, Baltimore, Maryland, United States of America,2Department of Pediatrics, University of Maryland School of Medicine, Baltimore, Maryland, United States of America
Abstract
Salmonella entericaserovar Typhi (S. Typhi), the causative agent of typhoid fever, continues to cause significant morbidity and mortality world-wide. CD8+T cells are an important component of the cell mediated immune (CMI) response againstS. Typhi. Recently, interleukin (IL)-17A has been shown to contribute to mucosal immunity and protection against intracellular pathogens. To investigate multifunctional IL-17A responses againstS. Typhi antigens in T memory subsets, we developed multiparametric flow cytometry methods to detect up to 6 cytokines/chemokines (IL-10, IL-17A, IL-2, interferon-c(IFN-c), tumor necrosis factor-a(TNF-a) and macrophage inflammatory protein-1b(MIP-1b)) simultaneously. Five volunteers were immunized with a 4 dose regimen of live-attenuatedS. Typhi vaccine (Ty21a), peripheral blood mononuclear cells (PBMC) were isolated before and at 11 time points after immunization, and CMI responses were evaluated. Of the 5 immunized volunteers studied, 3 produced detectable CD8+T cell responses following stimulation withS. Typhi-infected autologous B lymphoblastoid cell lines (B-LCL). Additionally, 2 volunteers had detectable levels of intracellular cytokines in response to stimulation withS. Typhi-infected HLA-E restricted cells. Although the kinetics of the responses differed among volunteers, all of the responses were bi- or tri-phasic and included multifunctional CD8+T cells. Virtually all of the IL-17A detected was derived from multifunctional CD8+T cells. The presence of these multifunctional IL-17A+CD8+T cells was confirmed using an unsupervised analysis program, flow cytometry clustering without K (FLOCK). This is the first report of IL-17A production in response toS. Typhi in humans, indicating the presence of a Tc17 response which may be important in protection. The presence of IL-17A in multifunctional cells co-producing Tc1 cytokines (IL-2, IFN-cand TNF-a) may also indicate that the distinction between Tc17 and Tc1 responses in humans is not as clearly delineated as suggested byin vitroexperiments and animal models.
Citation:McArthur MA, Sztein MB (2012) Heterogeneity of Multifunctional IL-17A ProducingS. Typhi-Specific CD8+T Cells in Volunteers following Ty21a Typhoid Immunization. PLoS ONE 7(6): e38408. doi:10.1371/journal.pone.0038408
Editor:Mauricio Martins Rodrigues, Federal University of Sa˜o Paulo, Brazil
ReceivedMarch 10, 2012;AcceptedMay 4, 2012;PublishedJune 5, 2012
Copyright:ß2012 McArthur, Sztein. This is an open-access article distributed under the terms of the Creative Commons Attribution License, which permits unrestricted use, distribution, and reproduction in any medium, provided the original author and source are credited.
Funding:This work was supported by National Institute of Allergy and Infectious Disease (NIAID), National Institutes of Health (NIH) federal research grants R01 AI036525 and U19 AI082655 (CCHI) to MBS. The content is solely the responsibility of the authors and does not necessarily represent the official views of the NIAID or NIH. The funders had no role in study design, data collection and analysis, decision to publish, or preparation of the manuscript.
Competing Interests:The authors have declared that no competing interests exist. * E-mail: [email protected]
Introduction
Salmonella entericaserovar Typhi (S. Typhi), a human restricted
pathogen, is the causative agent of typhoid fever. S. Typhi is a
Gram-negative, facultative intracellular pathogen that poses a significant threat to public health, particularly in the developing world [1,2]. Typhoid fever is responsible for an estimated 21 million illnesses and 200,000 deaths annually and increasing antibiotic resistance amongS. Typhi isolates has further
exacer-bated the problem [1,2,3,4,5,6,7,8]. T cells, and particularly CD8+T cells are thought to play an important role in the immune response againstS. Typhi by producing interferon-c(IFN-c) and
other T helper (Th) 1/T cytotoxic (Tc) 1 cytokines [9,10,11,12,13,14,15,16,17], as well as killing S. Typhi infected
cells [10,18]. Additionally, multifunctional CD8+ T cells have been identified in volunteers immunized with live-attenuated typhoid vaccine Ty21a [13]. Of note, the latter study has shown multiphasic cytokine production by CD8+T cells in response to
human leukocyte antigen E (HLA-E)-restricted antigenic stimula-tion [13].
Interleukin-17A is a pro-inflammatory cytokine that is involved in protection against extracellular and intracellular bacterial pathogens, as well as fungi and viruses [19,20,21,22,23]. IL-17A and associated Th17 cytokines promotes neutrophil recruitment via induction of chemokines and granulopoietic factors [19,23]. Additionally, IL-17 has been shown to regulate Th1 responses by altering IL-12p70 production by dendritic cells [24]. In addition to Th17, the presence of CD8+Tc17 cells that produce IL-17A have recently been described [25,26,27,28].
Therefore, to evaluate the hypothesis that IL-17A may play a role in protection from S. Typhi infection, we investigated the
presence of IL-17A producing CD8+T cells in peripheral blood mononuclear cells (PBMC) obtained from Ty21a recipients followingex vivostimulation with S. Typhi-infected autologous
B-lymphoblastoid cell lines (B-LCL) or anS. Typhi-infected HLA-E
S. Typhi-Specific IL-17A Producing CD8+T Cells
defense from other human infections [29,30,31], we investigated the concomitant production of IL-17A with 5 other cytokines/ chemokines (IL-10, IL-2, IFN-c, tumor necrosis factor-a(TNF-a), and macrophage inflammatory protein-1b(MIP-1b) as a first step to investigate the potential role of multifunctional T cells in protection fromS.Typhi infection.
Materials and Methods
Volunteers and Isolation of Peripheral Blood Mononuclear Cells (PBMC)
PBMC collected from 6 healthy adult volunteers, recruited from the Baltimore-Washington area and University of Maryland, Baltimore campus, were used in this study. Written informed consent was obtained and all procedures were approved by the University of Maryland, Baltimore IRB. PBMC were isolated immediately after blood draws by density gradient centrifugation and cryopreserved in liquid nitrogen following standard tech-niques [18,32].
Target/stimulator Cells
Epstein Barr virus (EBV)-transformed B-LCL were generated from PBMC obtained from Ty21a vaccinees and control volunteers as previously described [18]. Briefly, B-LCL were established using supernatants from the B95.8 cell line (ATCC CRL1612; American Type Culture Collection) as the source of EBV. PBMC from each volunteer were incubated with EBV containing supernatant and cyclosporine (0.5mg/mL; Sigma,
Saint Louis, MO) at 37uC with 5% CO2for 2–3 weeks. B-LCL
were maintained in culture or cryopreserved until use.
An HLA class I-defective B cell line transfected with HLA-E fused to the HLA-A2 leader peptide (therefore expressing the HLA-E*0101 allele, but not HLA-A, -B, -C on the cell surface), 721.221.AEH (AEH cells), were provided by Dr. D. Geraghty [9,13,33]. AEH cells were maintained in RPMI 1640 media (Gibco, Carlsbad, CA) supplemented with 100 U/mL penicillin (Sigma), 100mg/mL streptomycin (Sigma), 50mg/mL gentamicin
(Gibco), 2 mM L-glutamine (Gibco), 10 mM HEPES buffer (Gibco), 10% fetal bovine serum (Gemini Bioproducts, West Sacramento, CA), and 100mg/mL hygromycin (Sigma).
Infection of Target/stimulator Cells
Target cells were infected by incubation with wild-typeS. Typhi
strain ISP1820 in RPMI without antibiotics for 3 hours at 37uC with 5% CO2as previously described [18]. On the day following
infection the cells were gamma irradiated (6000 rad). To confirm that targets were infected with S.Typhi, cells were stained with
anti-Salmonellacommon structural Ag (CSA-1)-FITC (Kierkegaard
& Perry, Gaithersburg, MD) and analyzed by flow cytometry using an LSR-II instrument (BD). The percentage of cells infected with
S. Typhi was recorded for each experiment. Infected targets were
only used if infection was.30% of viable cells.
Ex vivo Stimulation
PBMC were thawed and rested overnight at 37oC, 5% CO2in
complete media (RPMI 1640 media (Gibco) supplemented with 100 U/mL penicillin (Sigma), 100mg/mL streptomycin (Sigma),
50mg/mL gentamicin (Gibco), 2 mM L-glutamine (Gibco),
2.5 mM sodium pyruvate (Gibco), 10 mM HEPES buffer (Gibco), and 10% fetal bovine serum (Gemini Bioproducts,)) at a concentration of 16106 cells/mL in 6 or 12 well plates. Cells
were then resuspended in complete media and stimulated withS.
Typhi-infected autologous B-LCL or S. Typhi-infected HLA-E
restricted AEH cells. Media alone and uninfected autologous B-LCL or HLA-E restricted AEH cells were used as negative controls. Staphylococcal enterotoxin B (SEB) (10mg/mL; Sigma) was used as a positive control. Cells were incubated at 37uC in 5% CO2. After 2 hours, Golgi Stop (containing monensin) and Golgi
Plug (containing brefeldin A) from BD were added at concentra-tions of 0.5ml/mL and cultures continued overnight at 37uC in 5% CO2.
Surface and Intracellular Staining for Flow Cytometric Analyses
Following stimulation as described above, cells were plated in 96-well V-bottom plates for staining. Cells were washed once with staining buffer (phosphate buffered saline with 0.5% BSA and 0.1% sodium azide) and stained for live/dead discrimination using Invitrogen LIVE/DEAD fixable violet dead cell stain kit (Invitrogen, Carlsbad, CA). Fc receptor blocking was performed with human immunoglobulin (3mg/mL; Sigma) followed by surface staining, performed as previously described [13]. Briefly, cells were stained with CD14-Pacific Blue (TuK4, Invitrogen) and CD19-Pacific Blue (SJ25-C1, Invitrogen), CD3-biotin (UCHT1, Beckman Coulter, Danvers, MA), CD4-Qdot 655 (S3.5, Invitro-gen), CD8-Qdot 705 (3B8, InvitroInvitro-gen), CD45RA-Qdot 605 (MEM56, Invitrogen), and CD62L-PE-Cy5 (Dreg 56, BD, Franklin Lakes, NJ) at 4uC for 30 minutes. Staining with streptavidin-Pacific Orange (Invitrogen) was performed for panels that included biotin-conjugated monoclonal antibodies for 30 minutes at 4uC. The cells were then fixed and permeabilized using IC fixation and permeabilization buffers from eBiosciences according to manufacturer’s recommendations. Intracellular staining with IL-17A-PerCP-Cy5.5 (eBio64DEC17, eBioscience), IL-2-PE-Cy7 (MQ1-17H12, BD), IFN-c-Alexa 647 or APC-Alexa 750 (B27, BD or Invitrogen), TNF-a-Alexa 700 (MAb11, BD), IL-10-FITC (127107, R&D, Minneapolis, MN), MIP-1b-APC (24006, R&D), and CD69-PE (FN50, eBioscience) was performed at 4uC overnight. After staining, cells were fixed in 1% paraformaldehyde and stored at 4uC until analyzed. Cells stained with the 13-color panels described above were analyzed by flow cytometry using a customized LSRII flow cytometer (BD). Flow cytometry data were analyzed using WinList version 7 (Verity Software House, Topsham, ME) and FLOCK (ImmPort, NIH web site www.immport.org) software packages. Graphs were generated using GraphPad Prism version 5.03 (Graphpad Software, San Diego, CA).
Figure 1. Detection of intracellular cytokines/chemokines produced by CD8+T cell memory subsets in response to stimulation with S.Typhi-infected autologous B-LCL.Histograms from a representative volunteer (53 s at day 7 post infection) showing the production of 6 cytokines/chemokines by memory T cell subsets following stimulation withS. Typhi-infected autologous B-LCL. CD69 (a marker of recent activation) is displayed on the y-axis and each of the 6 cytokines/chemokines measured are displayed on the x-axes. Column 1 represents total CD8+T cells, column 2 represents T central memory (TCM; CD62L+CD45RA-), column 3 represents T naı¨ve (TN; CD62L+CD45RA+), column 4 represents T effector memory (TEM; CD62L- CD45RA-), and column 5 represents T effector memory CD45RA+(TEMRA; CD62L- CD45RA+). The percentage of positive cells is
S. Typhi-Specific IL-17A Producing CD8+T Cells
Statistical Analyses
All tests were performed using GraphPad Prism version 5.03 (Graphpad Software). Comparisons between groups were per-formed using Mann-Whitney and Kruskal-Wallis tests. In flow cytometry experiments a response was considered significant if the differential in the number of positive events between experimental (S.Typhi-infected) and negative control (non-infected) cultures was
significantly increased by Chi-square tests. P values ,0.05 were considered significant.
Results
Kinetics of S. Typhi-specific CD8+T Cells in Response to Stimulation with S. Typhi-infected Autologous Cells
Previous studies have indicated that CD8+T cells are a major component of the CMI response to S. Typhi [10,14,15,18].
Therefore we set out to determine the kinetics of CD8+ T cell responses toin vitrostimulation with autologousS.Typhi-infected
cells following Ty21a immunization. Five healthy adult volunteers received 4 doses of the licensed oral, live-attenuated S. Typhi
vaccine Ty21a on days 0, 2, 4, and 7. One volunteer did not receive Ty21a (negative control). PBMC were isolated before immunization and at 11 time-points up to 1 year after immunization (days 2, 4, 7, 10, 14, 28, 42, 56, 120, 180, and 360). Following isolation, PBMC were stimulated withS.
Typhi-infected autologous B-LCL. UnTyphi-infected B-LCL and SEB were used as negative and positive controls respectively. PBMC were stained with monoclonal antibodies against CD3, CD4, CD8, CD14, CD19, CD45RA, and CD62L followed by intracellular staining for CD69, IL-10, IL-17A, IL-2, IFN-c, TNF-a, and MIP-1b. Due to unavailability of the antibody, MIP-1bstaining was not performed in 2 of the volunteers (48 s and 50 s). The samples were then analyzed by multichromatic flow cytometry. The gating strategy is shown in Figure S1. CD3+ CD8+ T cells were categorized by their expression of CD62L and CD45RA into naı¨ve T cells (TN; CD62L+CD45RA+), T central memory cells
(TCM; CD62L+ CD45RA-), T effector memory (TEM;
CD62L-CD45RA-), and T effector memory CD45RA+(TEMRA;
CD62L-CD45RA+) as previously described (Figure S1) [34]. We observed the intracellular production of multiple cytokines to be predom-inantly by the TEM subset with a smaller contribution by the
TEMRAsubset (Figure 1).
Low levels of cytokine production were detected in PBMC stimulated with uninfected autologous B-LCL and this background was subtracted to calculate theS. Typhi-specific response. There
was some variable baseline responsiveness on day 0 in most volunteers, likely due to cross-reactivity with other enteric Gram negative rods. Therefore, the net value (day x post immunization – day 0) was used to normalize the data. We found that 3 of the 5 immunized volunteers (60%) showed detectable intracellular cytokine responses above baseline responsiveness at day 0 (Figure 2 and Figure S2). This is consistent with our previous data using PBMC from subjects immunized with Ty21a and, interestingly, with most field studies which report a vaccine efficacy of 65–70% [10,13,35]. Intracellular IL-10 was not detected in any of the volunteers at any time-point. MIP-1bwas
measured in only 2 of the 3 responders (53 s and 54 s). There was significant production of MIP-1bby both TEMand TEMRAfrom
volunteer 53 s (Figure 2 A & B); however, volunteer 54 s produced no detectable MIP-1b (Figure 2 C & D). CD8+TEMfrom all 3
volunteers (53 s, 54 s, and 50 s) produced high levels of TNF-a
and IFN-c(5–15% of circulating TEMat the peak times), followed
by IL-2 (4–8% of circulating TEMat the peak times), and then
IL-17A (2–5% of circulating TEM at the peak times) (Figure 2).
Intracellular IL-17A production was found in all 3 responders with kinetics that followed those of the other cytokines/chemokines measured (except MIP-1b) (Figure 2). The kinetics of the responses varied considerably among volunteers; however, all 3 volunteers showed bi- or tri-phasic responses. Early peaks were observed in volunteers 53 s and 50 s at days 4 to 7 post immunization (Figure 2 A, B, E, & F). In volunteer 53 s, additional peaks were observed at days 42 and 180–360 post immunization (Figure 2 A). The kinetics of MIP-1bdiffered from the kinetics of the other 5 cytokines with only 2 peaks at day 4 to 7 and days 28 to 56 (Figure 2 A). Volunteer 54 s had a bi-phasic response without an early peak. Peaks occurred at days 42 and 120 post immunization (Figure 2 C & D). In addition to the early peak at day 4 post immunization, volunteer 50 s demonstrated a peak from days 10 to 28 and a third peak at days 56–120 post immunization. The peaks in volunteer 50 s responses were not as dramatic as those observed in volunteer 53 s and 54 s.
The TEMRAresponses were generally lower in magnitude than
TEMresponses in volunteer 53 s, essentially absent in volunteer
54 s, and substantially lower than TEMresponses in volunteer 50 s
(Figure 2 B, D, & F). There were also some differences in the kinetics of the TEMand TEMRAresponses (Figure 2 A–F).
Differences in Kinetics of S. Typhi-specific HLA-E Restricted CD8+ T Cells
Here we investigated whether IL-17A was produced following stimulation by HLA-E restricted CD8+T cells, as well as defined the kinetics of this response. As described for PBMC stimulated with S. Typhi-infected autologous B-LCL, PBMC from
immu-nized volunteers were stimulated with theS. Typhi-infected
HLA-E restricted cell line (721.221.AHLA-EH), stained, and analyzed by multichromatic flow cytometry. The same gating strategy was applied (Figure S1). We found that TEM and to a lesser extent
TEMRA subsets were the major sources of intracellular cytokine
production (Figure 3). In contrast to stimulation with S.
Typhi-infected autologous B-LCL, HLA-E restricted stimulation resulted in responses in 2 of the volunteers, 53 s and 54 s (Figure 4 and Figure S3). This is unlikely to be the result of technical difficulties. For all volunteers, including 50 s, there were equivalent viability and percentages ofS. Typhi-infected autologous B-LCL and
HLA-E restricted AHLA-EH cells (data not shown). With the exception of MIP-1b production by volunteer 53 s, the levels of detectable intracellular cytokines were lower in response to HLA-E restricted stimulation compared to autologous B-LCL stimulation (Figures 2 & 4). As seen following stimulation with S. Typhi-infected
autologous B-LCL, MIP-1b production was the predominant response by volunteer 53 s (Figure 4 A & B). CD8+ TEMfrom
volunteer 54 s only produced MIP-1bat day 7 post immunization
Figure 2. Kinetics of intracellular cytokine/chemokine production following stimulation of PBMC withS. Typhi-infected autologous B-LCL.Intracellular cytokine/chemokine production is shown as the percentage of positive cells. Responses are expressed as net values with day 0 subtracted to normalize for differences in base-line responses toS. Typhi in different volunteers. A) CD8+TEMcells for volunteer 53 s B) CD8+TEMRA
cells for volunteer 53 s C) CD8+TEMcells for volunteer 54 s D) CD8+TEMRAcells for volunteer 54 s E) CD8+TEMcells for volunteer 50 s F) CD8+TEMRA
cells for volunteer 50 s. Increases of.0.5% cytokine positive cells over uninfected targets were found to be consistently statistically significant (P,0.01) by chi-square analyses. * MIP-1b not measured.
S. Typhi-Specific IL-17A Producing CD8+T Cells
(Figure 4 C). TNF-a(5.29–6.37%) and IFN-c(5.31–7.32%) had the highest percentage of cells with detectable intracellular cytokines, followed by IL-2 (2.87–3.85%) and IL-17A (2.64– 4.71%) at peak time points (Figure 4). Although the kinetics were also bi- or tri-phasic, there were differences between the peak time-points following stimulation withS. Typhi-infected autologous
B-LCL and HLA-E restricted cells (Figures 2 & 4). Volunteer 54 s showed a bi-phasic response to stimulation withS. Typhi-infected
autologous B-LCL (Figure 2 C & D) but a tri-phasic response toS.
Typhi-infected HLA-E restricted cells (Figure 4 C & D).
Differences in the Kinetics of IL-17A Producing CD8+ T Cells in Response to Stimulation with S. Typhi-infected Autologous or HLA-E Restricted Cells
This is, to our knowledge, the first description of CD8+T cells producing IL-17A in response toS. Typhi. IL-17A was produced
by all responding volunteers in response to stimulation with S.
Typhi-infected autologous B-LCL (53 s, 54 s, and 50 s) and HLA-E restricted (53 s and 54 s) cells. TEM were the predominant
source of IL-17A, with intracellular IL-17A also detected in TEMRAof volunteer 53 s (Figure 5 A & B). Only a small amount of
intracellular IL-17A was detected in TEMRAfrom volunteer 54 s in
response to S. Typhi-infected HLA-E restricted cells on days 28
and 180 (Figure 5 D). The kinetics of IL-17A production were consistent with those of other cytokines measured (e.g, IL-2,
IFN-c, etc) and demonstrated bi- or tri-phasic responses that differed according to theS.Typhi-infected targets used in the stimulation
(Figure 5).
S. Typhi-specific CD8+T Cells are Primarily Multifunctional
Because recent reports suggested that multifunctional T cells are likely to play a prominent role in protection from infection [25,26,27], we next investigated the multifunctionality of CD8+T cell responses to Ty21a. Using the FCOM function of WinList (Verity software) we analyzed all possible combinations (64 total) of the 6 cytokines/chemokines measured (IL-10, IL-17A, IL-2,
IFN-c, TNF-a, and MIP-1b) at each time-point. Only combinations with at least 1 time-point $0.5% of CD8+ TEM or TEMRA
cytokine positive cells are shown. This percentage represents a minimum of ,10–50 events for TEMRA and TEM respectively.
Results from a representative volunteer (53 s) are shown in response to stimulation with S. Typhi-infected autologous cells
(Figure 6) andS. Typhi-infected HLA-E restricted cells (Figure 7).
Data from the other responding volunteers are shown in Figures S3,S4,S5. Due to the complexity of the data (64 combinations for each of 12 time-points) we determined the median value for each combination that was$0.5% based on all time-points (Figures 6A, 7A, S3A, S4A, S5A). Each combination is shown on the X-axis with the values from each time-point (in % positive cells) on the Y-axis. The median value was determined for each combination and the kinetics of the top 5 combinations are shown (Figures 6B, 7B). Multifunctional responses predominated over single cytokine producing cells in all volunteers (Figures 6 and 7, and S3,S4,S5). As demonstrated in Figure 6, 4 of the top 5 combinations identified were multifunctional for volunteer 53 s in response to
autologous stimulation. All of the top 5 combinations for volunteer 53 s produced MIP-1b(either singly or in combination with other cytokines). The top 5 combinations for volunteer 53 s were the same for both autologous and HLA-E restricted stimulation (Figures 6 & 7). In contrast, in volunteer 54 s the top combinations differed depending on the type of stimulation (Figures S3 and S4). Volunteer 50 s did not respond to HLA-E restricted stimulation.
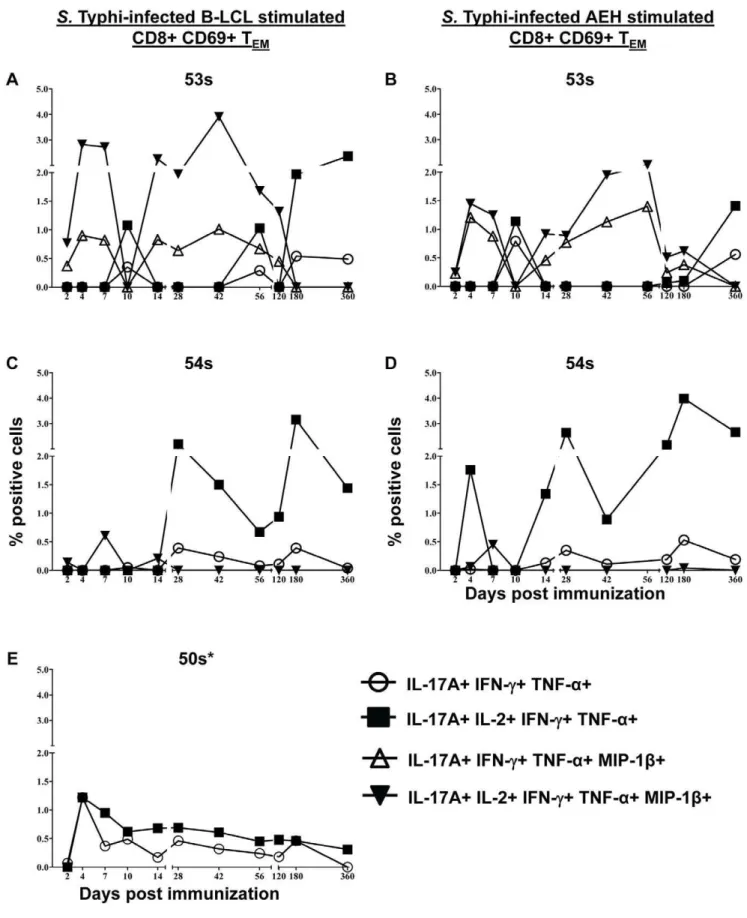
IL-17A Producing Cells are Multifunctional and co-produce IL-2, IFN-c, TNF-a, and/or MIP-1b
As shown above, IL-17A production was detected in all of the responding volunteers following stimulation with both autologous and HLA-E restricted cells (Figures 2, 4, and S3,S4,S5). To further characterize the IL-17A producing cells, we studied their multifunctional characteristics in further detail. We found that virtually all of the IL-17A producing cells were multifunctional, co-producing IL-2, IFN-c, TNF-a, and/or MIP-1b(Figure 8). All IL-17A+ populations were IL-10-. We identified 4 IL-17A+
populations: IL-17A+IL-2+IFN-c+TNF-a+MIP-1b- (‘‘quadru-ple positive’’), IL-17A+ IL-2- IFN-c+ TNF-a+ MIP-1b- (‘‘triple positive’’), IL-17A+IL-2+IFN-c+TNF-a+MIP-1b+(‘‘quintuple positive’’), and IL-17A+IL-2- IFN-c+ TNF-a+ MIP-1b+ (‘‘qua-druple positive’’). IL-17A production by volunteer 53 s was predominantly by quintuple-positive cells co-producing IL-17A, IL-2, IFN-c, TNF-a, and MIP-1bat most time points. The peak of the quintuple-positive cells was on day 42 post immunization following stimulation with S. Typhi-infected autologous B-LCL
(3.91% of CD8+ CD69+ TEM) and day 56 post immunization
following stimulation withS. Typhi-infected HLA-E restricted cells
(2.01% of CD8+ CD69+ TEM) (Figure 8 A & B).
Quadruple-positive (IL-17A+IL-2- IFN-c+TNF-a+MIP-1b+) cells were also present at lower percentages with similar kinetics. Additionally, at day 10 post immunization there was no MIP-1b; however production of IL-17A+IL-2+IFN-c+TNF-a+ MIP-1b- and IL-17A+IL-2- IFN-c+TNF-a+MIP-1b- populations were identified (although at lower levels) (Figure 8 A & B). Volunteer 54 s did not show any MIP-1bproduction except on day 7 post immunization (Figure 2C and Figure 4C). IL-17A+ populations reflected this with the predominant populations being quadruple positive (IL-17A+IL-2+IFN-c+TNF-a+MIP-1b-) followed by triple positive (IL-17A+IL-2- IFN-c+TNF-a+MIP-1b-) TEMcells at all
time-points except at day 7 post immunization (Figure 8 C & D). MIP-1bwas not measured in volunteer 50 s so only 2 populations were identified. These populations varied only in their production of IL-2 (Figure 8 E).
Unsupervised Analysis Using Flow Cytometry Clustering without K (FLOCK) Confirms the Multifunctionality of S. Typhi-specific CD8+ IL-17A+T Cells
To further examine the multifunctional IL-17A+ populations identified by conventional, user-guided, flow cytometry analyses, we used the novel unsupervised analysis program FLOCK. FLOCK uses computational methods to determine the number of unique populations in multidimensional flow cytometry data [36]. A subset of time-points (days 0, 7, 10, and 42 post immunization) for volunteers 53 s and 54 s following stimulation
Figure 3. Detection of intracellular cytokines/chemokines produced by CD8+T cell memory subsets in response to stimulation with S.Typhi-infected HLA-E restricted cells.Histograms from a representative volunteer (53 s at day 7 post infection) showing the production of 6 cytokines/chemokines by memory T cell subsets following stimulation withS. Typhi-infected AEH cells. CD69 (marker of recent activation) is displayed on the y-axis and each of the 6 cytokines/chemokines measured are displayed on the x-axes. Column 1 represents total CD8+T cells, column 2 represents TCM, column 3 represents TN, column 4 represents TEM, and column 5 represents TEMRA. The percentage of positive cells is shown for the
S. Typhi-Specific IL-17A Producing CD8+T Cells
withS.Typhi-infected B-LCL were analyzed. The same data that
were analyzed for intracellular detection of IL-10, IL-17A, IL-2, IFN-c, TNF-a, and MIP-1b by conventional, user-guided methods (Figures 1, 6, and S3) were analyzed by FLOCK. Prior to FLOCK analyses, gating was performed as described in Figure S1 to select CD3+CD8+TEMevents. Data for the 4 selected
time-points for each volunteer were uploaded to the ImmPort website (http://immport.niaid.nih.gov) and FLOCK analyses performed. The number of unique populations varied at different time-points and between volunteers (9–29 individual populations). In order to compare data across time-points and between volunteers, a cross-sample analysis was performed. In this cross cross-sample analysis, the populations identified in a single sample (volunteer 53 s day 10 post infection following stimulation withS. Typhi-infected B-LCL)
were applied to all samples. Six unique CD69+ (i.e., recently activated) populations were identified (Figure 9 A). All 6 populations were negative for IL-10 production. MIP-1b produc-tion was dependent on the time-point and volunteer. In other words, at those time-points for volunteer 53 s at which intracellular MIP-1b was detected (days 7 and 42 post immuni-zation), MIP-1b was produced by populations 1, 3, 5, and 6. However, for volunteer 54 s, only populations 3 and 5 produced MIP-1bon day 7 post immunization. Population 4 was negative for all cytokines/chemokines measured. Populations 1 and 6 were IL-17A+(Figure 9). The IL-17A+populations identified were both multifunctional co-producing IL-2, IFN-c, TNF-a, and/or MIP-1b (Figure 9). Population 1 was IL-10- IL-17A+ IL-2+ IFN-c+
TNF-a+MIP-1b+/2, while population 6 was IL-10- IL-17A+ IL-2- IFN-c+ TNF-a+ MIP-1b+/2 (Figure 9). Figure 9 depicts a representative sample which did not produce MIP-1b (volunteer 53 s day 10 post immunization). The IL-17A+ populations that were identified differed in their production of IL-2.
In addition to identifying multifunctional cells, FLOCK analysis distinguished bright (++) and dim (+) populations of IFN-cand TNF-abased on mean fluorescence intensity (MFI) (Figure 9 A). Brighter intensity of staining indicates higher intracellular cytokine content. Populations 1, 5, and 6 stained brightly for IFN-c, while populations 1 and 6 stained brightly for TNF-a(Figure 9). These data from unsupervised analysis indicate that IL-17A-producing cells produce high levels of both IFN-cand TNF-a.
Figure 10A shows 3-dimensional representation of IL-2 (x-axis), IFN-c(y-axis), and TNF-a(z-axis) for 4 of the CD69+populations (populations 1, 2, 4, and 6). Each panel shows an approximately 30urotation around the z-axis. Population 4 (purple) is negative for all measured cytokines, population 2 (lime green) is IFN-cand TNF-adim, while populations 1 (pink) and 6 (aqua) are IFN-cand TNF-abright. Populations 1 and 6 are both IL-17A+but differ in their production of IL-2 as described above (Figures 9A and B and 10A).
The net percentage of positive cells for each population at the 3 time-points, as determined by cross-sample analysis, is shown in Figure 10B. IL-17A+multifunctional cells were identified at days 7, 10, and 42 post immunization for volunteer 53 s with a peak at day 10 post immunization (Figure 10B). Volunteer 54 s had low levels of IL-17A+ multifunctional cells on day 7 post immuniza-tion, but the predominant response was at day 42 post
immunization which correlates with the later peak cytokine production previously demonstrated for volunteer 54 s (Figure 2C).
Discussion
Here we demonstrate the presence and persistence of multi-functional IL-17A producingS. Typhi-specific CD8+ T cells in
response to bothS.Typhi-infected autologous B-LCL and HLA-E
restricted stimulation. Multifunctional IL-17A+cells demonstrated multiphasic kinetics and were still detectable one year after immunization. We identified quadruple and quintuple positive CD8+ TEMand TEMRAIL-17A producing cells that co-produce
pro-inflammatory cytokines/chemokines IL-2, IFN-c, TNF-a, and/or MIP-1bbut not IL-10. These multifunctional populations were confirmed using unsupervised flow cytometric analysis with FLOCK.
IL-17 has been increasingly implicated in host responses against intracellular pathogens [19]. Specifically, the importance of IL-17 in mucosal immune responses to intracellular enteric pathogens has been demonstrated in animal models [20,21]. It was shown that depletion of Th17 cells during simian immunodeficiency virus (SIV) infection results in increased dissemination of Salmonella
Typhimurium from the gut [20]. Additionally, antigen-specific IL-17A+ cells were identified in response to Salmonella Enteriditis
infection and IL-17A knockout mice had an elevated bacterial burden in the liver and spleen as compared to wild-type mice [37]. Thus, it was of great importance to initiate studies to evaluate whether IL-17A might play a role in protection from S.Typhi.
Because the gastrointestinal mucosa is the first point of contact for
S. Typhi, mucosal immune responses are likely to play an
important role in protection. This is to our knowledge, the first report of IL-17A production in response toS. Typhi, both toS.
Typhi-infected autologous targets, as well as HLA-E restricted stimulation. The presence of S. Typhi-specific CD8+ T cells
producing IL-17A suggests that these cells may play a role in the mucosal response. CD8+T cells with characteristics of the Th17 lineage, Tc17, have been described in the setting of chronic hepatitis C virus infection [25]; however, in these studies, stimulation with phorbol myristate acetate (PMA) and ionomycin was used rather than specific antigen. Thus, the results presented in this manuscript are, to our knowledge, the first demonstration in humans of the presence of CD8+
Tc17 cells responsive to antigens from infectious agents.
Multifunctional T cells,i.e., those producing 2 or more cytokines
simultaneously, have been shown to produce higher levels of individual cytokines, have enhanced function, and are more likely to correlate with protection from disease, when compared to single cytokine producing cells [29,30,31]. Although T cells co-produc-ing IL-17A with IFN-cor TNF-ain response to PMA/ionomycin stimulation have been identified [38,39], to our knowledge, this is the first study to examine the simultaneous production of IL-17A with 5 other cytokines/chemokines, which play key roles in inflammatory processes, in a human-pathogen specific system. Of note, unsupervised flow cytometric FLOCK analysis showed higher levels of IFN-c and TNF-a being produced by IL-17A-producing multifunctional cells (i.e., multifunctional IL-17A+
populations are bright for IFN-c and TNF-a). In addition, we
Figure 4. Kinetics of intracellular cytokine/chemokine production following stimulation of PBMC withS. Typhi-infected HLA-E restriced cells.Intracellular cytokine/chemokine production is shown as the percentage of positive cells. Responses are expressed as net values with day 0 subtracted to normalize for differences in base-line responses toS. Typhi in different volunteers. A) CD8+TEMcells for volunteer 53 s B) CD8+
TEMRAcells for volunteer 53 s C) CD8+TEMcells for volunteer 54 s D) CD8+TEMRAcells for volunteer 54 s E) CD8+TEMcells for volunteer 50 s F) CD8+ TEMRAcells for volunteer 50 s. Increases of.0.5% cytokine positive cells over uninfected targets were found to be statistically significant (P,0.01). *
MIP-1b not measured.
S. Typhi-Specific IL-17A Producing CD8+T Cells
observed that IL-17A was produced exclusively by multifunctional cells and that the predominant IL-17A+responses were IL-17A+
IL-2+ IFN-c+ TNF-a+ MIP-1b+/2 as assessed by both super-vised (FCOM) and unsupersuper-vised (FLOCK) flow cytometric analyses. The co-production of IL-17A with cytokines typically associated with Tc1 responses, suggest that the Tc17 lineage is not as distinct in humans asin vitroand animal studies have previously
suggested.
Multiphasic kinetics have previously been demonstrated in response to Ty21a immunization following stimulation in an HLA-E restricted manner [13]. Here we confirm and extend these findings by showing that multiphasic kinetics are also typical of responses to autologous stimulation with B-LCL. Interestingly, despite their bi- or tri-phasic nature, the kinetics of responses to autologous stimulation and HLA-E restricted stimulation differed. HLA-E is a non-classical major histocompatibility (MHC) molecule which is highly conserved [40] and it is expressed ubiquitously on PBMC (at various levels depending on the individual cell types) in combination with classical MHC molecules [41]. Given the differences in kinetics between autologous and HLA-E restricted stimulation, as well as the fact that volunteer 50 s showed responses to autologous stimulation but not to HLA-E restricted stimulation, our results clearly indicate that while HLA-E restricted responses may contribute to the responses seen when PBMC were stimulated with S.
Typhi-infected autologous B-LCL, they represent only a portion of these responses. It will be important to confirm these findings using different targets such as autologous blasts. However, these data are supported by the fact that in previous studies, monoclonal antibodies against HLA-E were only able to partially block CTL activity against S. Typhi-infected targets, while monoclonal
antibody against a pan-MHC class I marker (W6/32) showed almost complete abrogation of CTL against S. Typhi-infected
targets [9]. Moreover, the observations that at different times after immunization there are considerable differences in the effector subsets that respond to autologous and HLA-E restrictedS.
Typhi-infected cells raises the likely possibility that various effector cells might contribute differently to the host defense at various times after exposure. These observations also point to the importance of the timing of specimen collection following immunization and its impact on the magnitude of effector immune responses which can be measured. Finally, it is important to mention that these data confirm and extend previous observations on the longevity of CMI responses (at least 1 year) elicited following immunization with Ty21a and other attenuated typhoid vaccine candidates [12,13].
The significance of the multiphasic responses observed is not entirely clear; however, it is possible that the decline in the levels of cytokine producingS. Typhi-specific CD8+T cells at various times
could represent these cells homing cells to the gut. Previous studies have, in fact, shown expression of gut-homing molecules on S.
Typhi-specific CD8+ T cells [12,17]. While these multiphasic responses have previously been described for HLA-E restricted responses [13], this is the first report of multiphasic kinetics in response to autologous stimulation over the course of 1 year post-immunization with the Ty21a typhoid vaccine. As has previously been shown, the responses following HLA-E restricted stimulation
peaked as early as 4–7 days post immunization which is earlier than typically expected for CMI responses [13]. Interestingly, in 2 of the 3 responding volunteers (50 s and 53 s), a peak as early as days 4–7 post immunization was observed in response to autologous stimulation as well. In summary, multifunctional IL-17A+ CD8+ T cells display multiphasic kinetics in response to both classical and non-classical MHC restricted stimulation. These responses persist at least 1 year after immunization. Future studies in which the presence of these multifunctional Tc17 responses are evaluated in the context of clinical outcome following challenge of volunteers with wild-typeS. Typhi will provide key information to
assess the role of multifunctional cells producing high levels of IL-17A and other cytokines in protection from infection. These studies are likely to contribute to accelerate the development of much needed novel typhoid vaccines.
Supporting Information
Figure S1 Gating strategy used for flow cytometry analyses.Lymphocytes were gated based on forward and side scatter, followed by doublet exclusion. Live (ViViD negative) CD14- CD19- CD3+T cells were then selected. CD8+CD4- cells were further divided into memory subsets based on CD62L and CD45RA expression. Naı¨ve T cells (TN; CD62L+CD45RA+), T
central memory cells (TCM; CD62L+ CD45RA-), T effector
memory (TEM; CD62L- CD45RA-), and T effector memory
CD45RA+(TEMRA; CD62L- CD45RA+)
(TIF)
Figure S2 Kinetics of cytokine/chemokine production following stimulation of PBMC with S. Typhi-infected
autologous B-LCL (non-responders and a non-immu-nized control).Responses are expressed as net values with day 0 subtracted to normalize for differences in base-line responses toS.
Typhi in different volunteers. A) CD8+ TEMcells for volunteer
48 s B) CD8+TEMRAcells for volunteer 48 s C) CD8+TEMcells
for volunteer 52 s D) CD8+ TEMRA cells for volunteer 52 s E)
CD8+ TEM cells for volunteer 196 s F) CD8+ TEMRAcells for
volunteer 196 s * MIP-1b not measured (TIF)
Figure S3 Multifunctional CD8+ TEM responses to S. Typhi-infected autologous B-LCL.A) Scatter plot showing all combinations of the 6 cytokines/chemokines measured that were positive at one or more time points for volunteer 54 s. Increases of
.0.5% cytokine positive cells over uninfected targets were found to be statistically significant (P,0.01). Each point represents a single time-point and the median value is denoted by a horizontal bar. The cyokine/chemokine combinations with the top 2 median values are indicated by red squares. Median values of the subsets of multifunctional cells that show a significant difference (*P,0.05, **P,0.01), when compared to the subsets without asterisks, are indicated. B) Kinetics of the top 2 populations (as determined by median value) over time.
(TIF)
Figure S4 Multifunctional CD8+ TEM responses to S. Typhi-infected HLA-E restricted cells. A) Scatter plot
Figure 5. Kinetics of intracellular IL-17A production following stimulation with eitherS. Typhi-infected autologous B-LCL or HLA-E restricted cells.Intracellular cytokine/chemokine production is shown as the percentage of positive cells. Responses are expressed as net values with day 0 subtracted to normalize for differences in base-line responses to S. Typhi in different volunteers. Responses toS. Typhi-infected autologous B-LCL are indicated by a filled square (&) and responses toS.Typhi-infected HLA-E restricted cells are indicated by open triangles (n). A) CD8+TEMcells for volunteer 53 s B) CD8+TEMRAcells for volunteer 53 s C) CD8+TEMcells for volunteer 54 s D) CD8+TEMRAcells for volunteer 54 s E)
CD8+TEMcells for volunteer 50 s F) CD8+TEMRAcells for volunteer 50 s. Increases of.0.5% cytokine positive cells over uninfected targets were found
showing all combinations of the 6 cytokines/chemokines measured that were positive at one or more time points for volunteer 54 s. Net increases of .0.5% cytokine positive cells over uninfected targets were found to be statistically significant (P,0.01). Each point represents a single time-point and the median value is denoted by a horizontal bar. The cyokine/chemokine
combina-tions with the top 2 median values are indicated by red rectangles. Median values of the subsets of multifunctional cells that show a significant difference (*P,0.05, **P,0.01), when compared to the subsets without asterisks, are indicated. B) Kinetics of the top 2 populations (as determined by median value) over time.
(TIF)
Figure 6. Multifunctional CD8+TEMresponses toS. Typhi-infected autologous B-LCL.A) Scatter plot showing all combinations of the 6
cytokines/chemokines measured that were positive at one or more time points for representative volunteer 53 s. Increases of.0.5% positive cells over uninfected targets were statistically significant (P,0.01). Each point represents a single time-point and the median value is denoted by a horizontal bar. The cyokine/chemokine combinations with the top 5 median values are indicated by red rectangles. Median values of the subsets of multifunctional cells that show a significant difference (**P,0.01), when compared to the subsets without asterisks, are indicated. B) Kinetics of the top 5 populations (as determined by median value) over time.
doi:10.1371/journal.pone.0038408.g006
S. Typhi-Specific IL-17A Producing CD8+T Cells
Figure S5 Multifunctional CD8+ TEM responses to S. Typhi-infected autologous B-LCL.A) Scatter plot showing all combinations of the 5 cytokines/chemokines measured (MIP-1b
was not measured) that were positive at one or more time points for volunteer 50 s. Net increases of.0.5% cytokine positive cells over uninfected targets were found to be statistically significant (P,0.01). Each point represents a single time-point and the median value is denoted by a horizontal bar. The cyokine/
chemokine combinations with the top 3 median values are indicated by red rectangles. Median values of the subsets of multifunctional cells that show a significant difference (*P,0.05, **P,0.01, ***P#0.001), when compared to the subsets without asterisks, are indicated. B) Kinetics of the top 3 populations (as determined by median value) over time.
(TIF)
Figure 7. Multifunctional CD8+TEMresponses toS. Typhi-infected HLA-E restricted cells.A) Scatter plot showing all combinations of the 6
cytokines/chemokines measured that were positive at one or more time points for representative volunteer 53 s. Increases of.0.5% positive cells over uninfected targets were statistically significant. Each point represents a single time-point and the median value is denoted by a horizontal bar. The cyokine/chemokine combinations with the top 5 median values are indicated by red rectangles. Median values of the subsets of multifunctional cells that show a significant difference (**P,0.01, ***P,0.001), when compared to the subsets without asterisks, are indicated. B) Kinetics of the top 5 populations (as determined by median value) over time.
Figure 8. Multifunctional CD8+TEMIL-17A+populations.Kinetics of multifunctional IL-17A+populations (if net.0.5%) following stimulation with eitherS. Typhi-infected autologous B-LCL (A, C, & E) or HLA-E restricted cells (B & D). Net increases of.0.5% cytokine positive cells over uninfected targets were found to be statistically significant (P,0.01). 50 s had no response to HLA-E restricted stimulation. * MIP-1b was not measured.
doi:10.1371/journal.pone.0038408.g008
S. Typhi-Specific IL-17A Producing CD8+T Cells
Figure 9. CD69+populations identified by unsupervised FLOCK analyses.CD3+CD8+TEMevents followingS. Typhi-infected autologous
B-LCL stimulation were uploaded to ImmPort for FLOCK analyses. A) Cytokine/chemokine production patterns of the 6 CD69+populations identified by FLOCK. B) Histograms showing FLOCK of representative volunteer 53 s at day 10 post immunization with the IL-17A+populations highlighted (population 1- pink and population 6- aqua).
Acknowledgments
We are indebted to the volunteers who allowed us to perform this study. We also thank Dr. Robin Barnes and the staff from the Recruiting Section of Center for Vaccine Development for their help in collecting blood specimens; Ms. Regina Harley and Catherine Storrer for excellent technical assistance. Additionally, we would like to think the ImmPort
technical support staff, particularly Dr. Patrick Dunn, for assistance with the FLOCK analyses.
Author Contributions
Conceived and designed the experiments: MAM MBS. Performed the experiments: MAM. Analyzed the data: MAM MBS. Contributed reagents/materials/analysis tools: MBS. Wrote the paper: MAM MBS.
References
1. Bhutta ZA, Threlfall J (2009) Addressing the global disease burden of typhoid fever. JAMA 302: 898–899.
2. Crump JA, Mintz ED (2010) Global trends in typhoid and paratyphoid Fever. Clin Infect Dis 50: 241–246.
3. Atkins BL, Gottlieb T (1998) Emerging drug resistance and vaccination for typhoid fever. JAMA 279: 579; author reply 580.
4. Bhutta ZA (1996) Impact of age and drug resistance on mortality in typhoid fever. Arch Dis Child 75: 214–217.
5. Crump JA, Luby SP, Mintz ED (2004) The global burden of typhoid fever. Bull World Health Organ 82: 346–353.
6. Harish BN, Menezes GA (2011) Antimicrobial resistance in typhoidal salmonellae. Indian J Med Microbiol 29: 223–229.
7. Lynch MF, Blanton EM, Bulens S, Polyak C, Vojdani J, et al. (2009) Typhoid fever in the United States, 1999–2006. JAMA 302: 859–865.
8. Mirza SH, Beeching NJ, Hart CA (1996) Multi-drug resistant typhoid: a global problem. J Med Microbiol 44: 317–319.
9. Salerno-Goncalves R, Fernandez-Vina M, Lewinsohn DM, Sztein MB (2004) Identification of a human HLA-E-restricted CD8+T cell subset in volunteers immunized with Salmonella enterica serovar Typhi strain Ty21a typhoid vaccine. J Immunol 173: 5852–5862.
Figure 10. Three-dimensional representation of FLOCK data and percentages for each of the CD69+populations at 3 time-points.A) Populations 1 (pink), 2 (lime green), 4 (purple), and 6 (aqua) shown in 3-dimensions. IL-2 is shown on the x-axis, IFN-con the y-axis, and TNF-aon the z-axis. B) Cross-sample analysis results showing net (day 0 subtracted) percentages of CD8+TEMfor each of the CD69+populations at days 7, 10, and
42 post immunization for volunteers 53 s and 54 s. Peak responses for each population are bolded. doi:10.1371/journal.pone.0038408.g010
S. Typhi-Specific IL-17A Producing CD8+T Cells
10. Salerno-Goncalves R, Pasetti MF, Sztein MB (2002) Characterization of CD8(+) effector T cell responses in volunteers immunized with Salmonella enterica serovar Typhi strain Ty21a typhoid vaccine. J Immunol 169: 2196–2203. 11. Salerno-Goncalves R, Sztein MB (2009) Priming of Salmonella enterica serovar
typhi-specific CD8(+) T cells by suicide dendritic cell cross-presentation in humans. PLoS One 4: e5879.
12. Salerno-Goncalves R, Wahid R, Sztein MB (2005) Immunization of volunteers with Salmonella enterica serovar Typhi strain Ty21a elicits the oligoclonal expansion of CD8+T cells with predominant Vbeta repertoires. Infect Immun 73: 3521–3530.
13. Salerno-Goncalves R, Wahid R, Sztein MB (2010) Ex Vivo kinetics of early and long-term multifunctional human leukocyte antigen E-specific CD8+cells in volunteers immunized with the Ty21a typhoid vaccine. Clin Vaccine Immunol 17: 1305–1314.
14. Salerno-Goncalves R, Wyant TL, Pasetti MF, Fernandez-Vina M, Tacket CO, et al. (2003) Concomitant induction of CD4+and CD8+T cell responses in volunteers immunized with Salmonella enterica serovar typhi strain CVD 908-htrA. J Immunol 170: 2734–2741.
15. Sztein MB (2007) Cell-mediated immunity and antibody responses elicited by attenuated Salmonella enterica Serovar Typhi strains used as live oral vaccines in humans. Clin Infect Dis 45 Suppl 1: S15–19.
16. Wahid R, Salerno-Goncalves R, Tacket CO, Levine MM, Sztein MB (2007) Cell-mediated immune responses in humans after immunization with one or two doses of oral live attenuated typhoid vaccine CVD 909. Vaccine 25: 1416–1425. 17. Wahid R, Salerno-Goncalves R, Tacket CO, Levine MM, Sztein MB (2008) Generation of specific effector and memory T cells with gut- and secondary lymphoid tissue- homing potential by oral attenuated CVD 909 typhoid vaccine in humans. Mucosal Immunol 1: 389–398.
18. Sztein MB, Tanner MK, Polotsky Y, Orenstein JM, Levine MM (1995) Cytotoxic T lymphocytes after oral immunization with attenuated vaccine strains of Salmonella typhi in humans. J Immunol 155: 3987–3993. 19. Khader SA, Gopal R (2010) IL-17 in protective immunity to intracellular
pathogens. Virulence 1: 423–427.
20. Raffatellu M, Santos RL, Verhoeven DE, George MD, Wilson RP, et al. (2008) Simian immunodeficiency virus-induced mucosal interleukin-17 deficiency promotes Salmonella dissemination from the gut. Nat Med 14: 421–428. 21. Sellge G, Magalhaes JG, Konradt C, Fritz JH, Salgado-Pabon W, et al. (2010)
Th17 cells are the dominant T cell subtype primed by Shigella flexneri mediating protective immunity. J Immunol 184: 2076–2085.
22. Marques JM, Rial A, Munoz N, Pellay FX, Van Maele L, et al. (2011) Protection against Streptococcus pneumoniae serotype 1 acute infection shows a signature of Th17- and IFN-gamma-mediated immunity. Immunobiology. 23. Khader SA, Gaffen SL, Kolls JK (2009) Th17 cells at the crossroads of innate
and adaptive immunity against infectious diseases at the mucosa. Mucosal Immunol 2: 403–411.
24. Kolls JK, Khader SA (2010) The role of Th17 cytokines in primary mucosal immunity. Cytokine Growth Factor Rev 21: 443–448.
25. Billerbeck E, Kang YH, Walker L, Lockstone H, Grafmueller S, et al. (2010) Analysis of CD161 expression on human CD8+T cells defines a distinct functional subset with tissue-homing properties. Proc Natl Acad Sci U S A 107: 3006–3011.
26. Hamada H, Garcia-Hernandez Mde L, Reome JB, Misra SK, Strutt TM, et al. (2009) Tc17, a unique subset of CD8 T cells that can protect against lethal influenza challenge. J Immunol 182: 3469–3481.
27. Yeh N, Glosson NL, Wang N, Guindon L, McKinley C, et al. (2010) Tc17 cells are capable of mediating immunity to vaccinia virus by acquisition of a cytotoxic phenotype. J Immunol 185: 2089–2098.
28. Nigam P, Kwa S, Velu V, Amara RR (2011) Loss of IL-17-producing CD8 T cells during late chronic stage of pathogenic simian immunodeficiency virus infection. J Immunol 186: 745–753.
29. Darrah PA, Patel DT, De Luca PM, Lindsay RW, Davey DF, et al. (2007) Multifunctional TH1 cells define a correlate of vaccine-mediated protection against Leishmania major. Nat Med 13: 843–850.
30. Kannanganat S, Ibegbu C, Chennareddi L, Robinson HL, Amara RR (2007) Multiple-cytokine-producing antiviral CD4 T cells are functionally superior to single-cytokine-producing cells. J Virol 81: 8468–8476.
31. Kannanganat S, Kapogiannis BG, Ibegbu C, Chennareddi L, Goepfert P, et al. (2007) Human immunodeficiency virus type 1 controllers but not noncontrollers maintain CD4 T cells coexpressing three cytokines. J Virol 81: 12071–12076. 32. Sztein MB, Wasserman SS, Tacket CO, Edelman R, Hone D, et al. (1994)
Cytokine production patterns and lymphoproliferative responses in volunteers orally immunized with attenuated vaccine strains of Salmonella typhi. J Infect Dis 170: 1508–1517.
33. Lee N, Goodlett DR, Ishitani A, Marquardt H, Geraghty DE (1998) HLA-E surface expression depends on binding of TAP-dependent peptides derived from certain HLA class I signal sequences. J Immunol 160: 4951–4960.
34. Sallusto F, Geginat J, Lanzavecchia A (2004) Central memory and effector memory T cell subsets: function, generation, and maintenance. Annu Rev Immunol 22: 745–763.
35. Levine MM, Taylor DN, Ferreccio C (1989) Typhoid vaccines come of age. Pediatr Infect Dis J 8: 374–381.
36. Qian Y, Wei C, Eun-Hyung Lee F, Campbell J, Halliley J, et al. (2010) Elucidation of seventeen human peripheral blood B-cell subsets and quantifi-cation of the tetanus response using a density-based method for the automated identification of cell populations in multidimensional flow cytometry data. Cytometry B Clin Cytom 78 Suppl 1: S69–82.
37. Schulz SM, Kohler G, Holscher C, Iwakura Y, Alber G (2008) IL-17A is produced by Th17, gammadelta T cells and other CD4- lymphocytes during infection with Salmonella enterica serovar Enteritidis and has a mild effect in bacterial clearance. Int Immunol 20: 1129–1138.
38. Annunziato F, Cosmi L, Santarlasci V, Maggi L, Liotta F, et al. (2007) Phenotypic and functional features of human Th17 cells. J Exp Med 204: 1849–1861.
39. Infante-Duarte C, Horton HF, Byrne MC, Kamradt T (2000) Microbial lipopeptides induce the production of IL-17 in Th cells. J Immunol 165: 6107–6115.
40. Rodgers JR, Cook RG (2005) MHC class Ib molecules bridge innate and acquired immunity. Nat Rev Immunol 5: 459–471.