AMTD
4, 4073–4104, 2011On-line water isotope analysis of ice cores
V. Gkinis et al.
Title Page
Abstract Introduction
Conclusions References
Tables Figures
◭ ◮
◭ ◮
Back Close
Full Screen / Esc
Printer-friendly Version Interactive Discussion
Discussion
P
a
per
|
Dis
cussion
P
a
per
|
Discussion
P
a
per
|
Discussio
n
P
a
per
|
Atmos. Meas. Tech. Discuss., 4, 4073–4104, 2011 www.atmos-meas-tech-discuss.net/4/4073/2011/ doi:10.5194/amtd-4-4073-2011
© Author(s) 2011. CC Attribution 3.0 License.
Atmospheric Measurement Techniques Discussions
This discussion paper is/has been under review for the journal Atmospheric Measure-ment Techniques (AMT). Please refer to the corresponding final paper in AMT
if available.
Water isotopic ratios from a continuously
melted ice core sample
V. Gkinis1, T. J. Popp1, T. Blunier1, M. Bigler2, S. Sch ¨upbach2, and S. J. Johnsen1,3
1
Centre for Ice and Climate, Niels Bohr Institute, University of Copenhagen, Juliane Maries Vej 30, 2100 Copenhagen, Denmark
2
Physics Institute, Climate and Environmental Physics and Oeschger Centre for Climate Change Research University of Bern, Sidlerstrasse 5, 3012 Bern, Switzerland
3
Science Institute, University of Iceland, Dunhaga 3, 107, Iceland
Received: 13 May 2011 – Accepted: 14 June 2011 – Published: 27 June 2011 Correspondence to: V. Gkinis ([email protected])
AMTD
4, 4073–4104, 2011On-line water isotope analysis of ice cores
V. Gkinis et al.
Title Page
Abstract Introduction
Conclusions References
Tables Figures
◭ ◮
◭ ◮
Back Close
Full Screen / Esc
Printer-friendly Version Interactive Discussion
Discussion
P
a
per
|
Dis
cussion
P
a
per
|
Discussion
P
a
per
|
Discussio
n
P
a
per
|
Abstract
A new technique for on-line high resolution isotopic analysis of liquid water, tailored for ice core studies is presented. We build an interface between an Infra Red Cavity Ring Down Spectrometer (IR-CRDS) and a Continuous Flow Analysis (CFA) system. The system offers the possibility to perform simultaneuous water isotopic analysis of
5
δ18O andδD on a continuous stream of liquid water as generated from a continuously melted ice rod. Injection of sub µl amounts of liquid water is achieved by pumping sample through a fused silica capillary and instantaneously vaporizing it with 100 % efficiency in a home made oven at a temperature of 170◦C. A calibration procedure allows for proper reporting of the data on the VSMOW scale. We apply the necessary
10
corrections based on the assessed performance of the system regarding instrumental drifts and dependance on humidity levels. The melt rates are monitored in order to assign a depth scale to the measured isotopic profiles. Application of spectral methods yields the combined uncertainty of the system at below 0.1 ‰ and 0.5 ‰ for δ18O and δD, respectively. This performance is comparable to that achieved with mass
15
spectrometry. Dispersion of the sample in the transfer lines limits the resolution of the technique. In this work we investigate and assess these dispersion effects. By using an optimal filtering method we show how the measured profiles can be corrected for the smoothing effects resulting from the sample dispersion. Considering the significant advantages the technique offers, i.e. simultaneuous measurement of δ18O and δD,
20
potentially in combination with chemical components that are traditionally measured on CFA systems, notable reduction on analysis time and power consumption, we consider it as an alternative to traditional isotope ratio mass spectrometry with the possibility to be deployed for field ice core studies. We present data acquired in the framework of the NEEM deep ice core drilling project in Greenland, during the 2010 field season.
AMTD
4, 4073–4104, 2011On-line water isotope analysis of ice cores
V. Gkinis et al.
Title Page
Abstract Introduction
Conclusions References
Tables Figures
◭ ◮
◭ ◮
Back Close
Full Screen / Esc
Printer-friendly Version Interactive Discussion
Discussion
P
a
per
|
Dis
cussion
P
a
per
|
Discussion
P
a
per
|
Discussio
n
P
a
per
|
1 Introduction
Polar ice core records provide some of the most detailed views of past environmental changes up to 800 000 years before present, in large part via proxy data such as the water isotopic composition and embedded chemical impurities. One of the most im-portant features of ice cores as climate archives, is their continuity and the potential
5
for high temporal resolution. Greenland ice cores are particularly well suited for high resolution paleoclimatic studies, because relatively high snow accumulation rates al-low seasonal changes in proxy data to be identified more than 50 000 years in the past (Johnsen et al., 1992; NGRIP members, 2004).
The isotopic signature of polar precipitation, commonly expressed through theδ
no-10
tation1(Epstein, 1953; Mook, 2000) is related to the temperature gradient between the evaporation and condensation site (Dansgaard, 1964) and has so far been used as a proxy for the temperature of the cloud at the time of condensation (Jouzel and Mer-livat, 1984; Jouzel et al., 1997; Johnsen et al., 2001). One step further, the combined signal ofδD andδ18O commonly referred to as the deuterium excess (hereafter Dxs), 15
constitutes a usefull paleothermometer tool. Via it’s high correlation with the temper-ature of the evaporation source (Johnsen et al., 1989), it has been used to resolve issues related to changes in the location of the evaporation site (Cuffey and Vimeux, 2001; Kavanaugh and Cuffey, 2002). A relatively recent advance in the use of water isotope ratios as a direct proxy of firn temperatures, is introduced by Johnsen et al.
20
(2000). Assessment of the diffusivity of the water isotopologues in the porous medium of the firn column can yield a temperature history, provided a dating model is available.
1
Isotopic abundances are typically reported as deviations of a sample’s isotopic ratio relative to that of a reference water (e.g. VSMOW) expressed through theδnotation:δi=
i
Rsample iRSMOW− 1[‰] where2R=
2
H
1H and 18
R=
18
O
AMTD
4, 4073–4104, 2011On-line water isotope analysis of ice cores
V. Gkinis et al.
Title Page
Abstract Introduction
Conclusions References
Tables Figures
◭ ◮
◭ ◮
Back Close
Full Screen / Esc
Printer-friendly Version Interactive Discussion
Discussion
P
a
per
|
Dis
cussion
P
a
per
|
Discussion
P
a
per
|
Discussio
n
P
a
per
|
The measurement of water stable isotopic composition is typically performed off-line via discrete sampling with traditional isotope ratio mass spectrometry (hereafter IRMS). While high precision and accuracy can routinely be achieved with IRMS systems, water isotope analysis remains an elaborate process, which is demanding in terms of sample preparation, power consumption, sample size, consumables and standard and carrier
5
gases. The analysis of a deep ice core at its full length in high resolution (typically 2.5 to 5 cm per sample) requires the process of a vast amount of water samples and can take years to complete. Additionally, these procedures often come at the expense of not fully exploiting the temporal resolution available in the ice core.
Laser spectroscopy in the near and mid infrared region has been demonstrated as
10
a potential alternative for water isotope analysis, presenting numerous advantages over IRMS (Kerstel et al., 1999; Kerstel, 2005). A major advantage of the technique is the ability to directly inject the sampled water vapour in the optical cavity of the spectrom-eter where both isotopic ratios18O/16O and 2H/1H are measured simultaneuously. In contrast, in the most common IRMS techniques water is not measured as such, but has
15
to be converted to a different gas prior to measurement. Forδ18O analysis, the CO2
equilibration method (Epstein, 1953) has been widely used, whereasδD analysis com-monly involves the reduction of water to hydrogen gas on hot uranium (Bigeleisen et al., 1952; Vaughn et al., 1998; Huber and Leuenberger, 2003). However, the combined use of these two methods rules out simultaneous analysis of both water isotopologues on
20
a given sample. More recently, in combination with the use of continuous flow mass spectrometers, conversion of water to CO and H2 is performed in a pyrolysis furnice
(Begley and Scrimgeour, 1997) and allows simultaneousδD andδ18O measurement, but still on a single discrete sample. Nowadays, commercial IR spectrometers are available with a precision comparable to IRMS systems (Lis et al., 2008; Brand et al.,
25
2009). These units typically receive a continuous stream of water vapor and offer ease of use and portability.
AMTD
4, 4073–4104, 2011On-line water isotope analysis of ice cores
V. Gkinis et al.
Title Page
Abstract Introduction
Conclusions References
Tables Figures
◭ ◮
◭ ◮
Back Close
Full Screen / Esc
Printer-friendly Version Interactive Discussion
Discussion
P
a
per
|
Dis
cussion
P
a
per
|
Discussion
P
a
per
|
Discussio
n
P
a
per
|
techniques. With the advent of Continuous Flow Analysis (heareafter CFA) from contin-uously melted ice core segments, the measurement of chemical impurities has reached the point of largely exploiting the high resolution available in the core while it is often performed in the field (Sigg et al., 1994; R ¨othlisberger et al., 2000; Kaufmann et al., 2008). The continuous, on-line nature of the technique has resulted in a considerable
5
reduction in sample preparation and processing times. Recently, Sch ¨upbach et al. (2009) demonstrated the measurement of CH4 mixing ratios in an on-line semi con-tinuous mode with the use of a gas chromatograph combined with a pulsed discharge and a thermal conductivity detector.
Here, we demonstrate the ability to perform continuous measurements of water
iso-10
tope ratios from a stream of water vapor derived from a continuously melting ice rod by coupling a commercial IR spectrometer to a CFA system via a passive, low vol-ume flash evaporatotion module. In the following, we assess the system’s precision, accuracy, and efficient calibration. We then comment on issues related to sample dis-persion in the sample transfer lines, the evaporation module and the optical cavity of
15
the spectrometer itself in order to determine the expected smoothing imposed on the acquired data sets. Finally, isotopic analysis of ice core samples from the NEEM deep ice core are presented and compared to measurements performed in discrete mode.
2 Experimental
2.1 Continuous flow analysis
20
In the system described here, (Fig. 1) an ice rod measuring 3.2×3.2×110 cm (here-after CFA run) is continuously melted on a copper, gold-nickel coated melter at a reg-ulated temperature of 20◦C. The concentric arrangement of the melter’s surface fa-cilitates the separation of the sample that originates from the outer and inner part of the core. Approximately 90 % of the sample from the inner part is transfered to the
25
AMTD
4, 4073–4104, 2011On-line water isotope analysis of ice cores
V. Gkinis et al.
Title Page
Abstract Introduction
Conclusions References
Tables Figures
◭ ◮
◭ ◮
Back Close
Full Screen / Esc
Printer-friendly Version Interactive Discussion
Discussion
P
a
per
|
Dis
cussion
P
a
per
|
Discussion
P
a
per
|
Discussio
n
P
a
per
|
configuration provides an overflow of ≈10 % from the inner to the outer part of the melter and ensures that the water sample that is introduced into the analytical system is not contaminated.
A stainless steel weight sitting on top of the ice rod enhances the stability and conti-nuity of the melting process. An optical encoder connected to the stainless steel weight,
5
records the displacement of the rod. This information is used to accurately define the depth scale of the produced water isotope data. Breaks in the ice rod are logged prior to the melting process and accounted for, during the data analysis procedure.
Gases included in the water stream originating from the air bubbles in the ice core are extracted in a sealed debubbler, with a volume of≈300 µl. The melt rate of the present
10
system is approximately 3.2 cm min−1, thus resulting in an analysis time of ≈35 min per CFA run. During the intervals between CFA runs, mQ water is pumped through the system. A 4-port injection valve (V1 in Fig. 1) allows the selection between the mQ and sample water. The mQ water is spiked with isotopically enriched water (99.8 % in D2O, Cortecnet Inc.) in a mixing ratio of≈1 ppm. In this way a distinction between sample
15
and mQ water is possible, facilitating the identification of the beginning and end times of a CFA run.
For further details on the analysis of chemical components or the extraction of gases for greenhouse gas measurements the reader is refered to Kaufmann et al. (2008) and Sch ¨upbach et al. (2009).
20
2.2 The water isotope measurement
We follow the same approach as previously presented in Gkinis et al. (2010) by cou-pling a commercially available Cavity Ring Down IR spectrometer (hereafter IR-CRDS) purchasecd by Picarro Inc. (Picarro L1102-i) (Crosson, 2008). The spectrometer oper-ates with a gas flow rate of 30 sml min−1. In the optical cavity the pressure is regulated
25
AMTD
4, 4073–4104, 2011On-line water isotope analysis of ice cores
V. Gkinis et al.
Title Page
Abstract Introduction
Conclusions References
Tables Figures
◭ ◮
◭ ◮
Back Close
Full Screen / Esc
Printer-friendly Version Interactive Discussion
Discussion
P
a
per
|
Dis
cussion
P
a
per
|
Discussion
P
a
per
|
Discussio
n
P
a
per
|
the environmental parameters of the spectrometer, result in a performance compera-ble to modern mass spectrometry systems taylored for water stacompera-ble isotope analysis.
A 6-port injection valve (V2 in Fig. 1) selects sample from the CFA line or a set of local water standards. The isotopic composition of the local water standards is determined with conventional IRMS and reported with respect to VSMO water. A 6-port selection
5
valve (V3 in Fig. 1) is used for the switch between different water standards. A peristaltic pump (P3 in Fig. 1) in this line with variable speeds, allows adjustment of the water vapor concentration in the spectrometer’s optical cavity, by varying the pump speed. In that way, the system’s sensitivity to different humidity levels can be investigated and a calibration procedure can be implemented. We use high purity Perfluoroalkoxy (PFA)
10
tubing for all sample transfer lines.
Injection of water sample into the evaporation oven takes place via a∅40 µm fused
silica capillary where immediate and 100 % evaporation takes place avoiding any frac-tionation affects. The setpoint of the evaporation temperature is set to 170◦C and is regulated with a PID controller. The amount of the injected water to the oven can be
15
adjusted by the pressure gradient maintained between the inlet and waste ports of the T1 tee-split (Fig. 1). The latter depends on the ratio of the inner diameters of the tubes connected to the two ports as well as the length of the waste line. The total water sam-ple consumption is≈0.1 ml min−1 maintained by the peristaltic pump P2 (Fig. 1). For a detailed description of the sample preparation and evaporation module the reader
20
may reffer to Gkinis et al. (2010). A smooth and undisturbed sample delivery to the spectrometer at the level of≈20 000 ppm results in optimum performance of the sys-tem. Fluctuations of the sample flow caused by air bubbles or impurities are likely to result in a deteriorated performance of the measurement and are occasionally ob-served as extreme outliers on bothδ18O andδD measurements. The processes that
25
AMTD
4, 4073–4104, 2011On-line water isotope analysis of ice cores
V. Gkinis et al.
Title Page
Abstract Introduction
Conclusions References
Tables Figures
◭ ◮
◭ ◮
Back Close
Full Screen / Esc
Printer-friendly Version Interactive Discussion
Discussion
P
a
per
|
Dis
cussion
P
a
per
|
Discussion
P
a
per
|
Discussio
n
P
a
per
|
3 Results and discussion – from raw data to isotope records
In this study we present data collected in the framework of the NEEM ice core drilling project. Measurements were carried out in the field during the 2010 field season and span 919.05 m of ice core (depth interval 1281.5–2200.55). Here we exemplify the performance of the system over a section of 16.5m of ice. The age of this section spans
5
≈411 yr with a mean age of 10.9 ka b2k. The reported age is based on a preliminary time scale constructed by stratigraphic transfer of the GICC05 time scale (Rasmussen et al., 2006) from the NGRIP to the NEEM ice core.
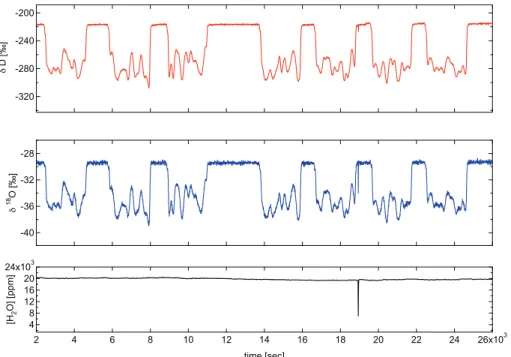
In Fig. 2 we present an example of raw data as acquired by the system. This data set covers 7 CFA runs (7.70 m of ice). A clear baseline of the isotopically heavier mQ water
10
can be seen in between CFA runs. Att=1.9×10⁴s one can observe a sudden drop in the signal of the water concentration due to a scheduled change of the mQ water tank. Adjacent to this, bothδ18O andδD signals present a clear spike, characteristic of the sensitivity of the system to the stability of the sample flow rates.
3.1 VSMOW – water concentration calibrations
15
Before any further processing we correct the acquired data for fluctuations of the water concentration in the optical cavity. To a good approximation the system shows a linear response to differences in water levels around 20 000 ppm (Brand et al., 2009; Gkinis et al., 2010). A correction is performed as:
∆δ=α(R20−1) (1)
20
HereR20= [H2O]
20000,a18=1.94 ‰ andaD=3.77 ‰ as estimated in Gkinis et al. (2010)
Raw data are expressed in per mil values for bothδ18O andδD and ppm for the water vapour concentration. These values are based on the slope and intercept values of the instrument’s stored internal calibration line. Due to apparent instrumental drifts though, the latter are expected to deviate with time. To overcome this problem we perform
25
AMTD
4, 4073–4104, 2011On-line water isotope analysis of ice cores
V. Gkinis et al.
Title Page
Abstract Introduction
Conclusions References
Tables Figures
◭ ◮
◭ ◮
Back Close
Full Screen / Esc
Printer-friendly Version Interactive Discussion
Discussion
P
a
per
|
Dis
cussion
P
a
per
|
Discussion
P
a
per
|
Discussio
n
P
a
per
|
andδD values measured by conventional Isotope Ratio Mass Spectrometry combined with a pyrolysis glassy carbon reactor (Thermo DeltaV – TC/EA).
3.2 The depth scale
The melting process is recorded by an optical encoder connected to the top of the stainless steel weight that lies on top of the ice rod. The data acquired by the optical
5
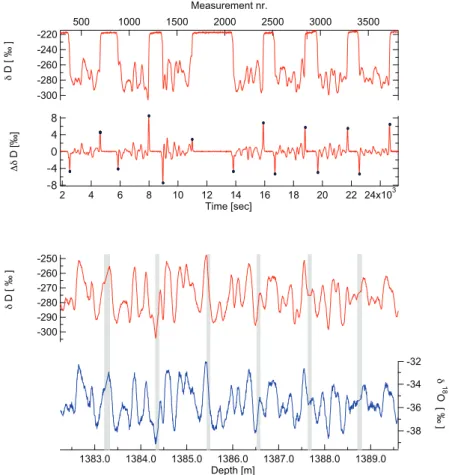
encoder allow for a conversion of the time scale to a depth scale. In order to locate the beginning and end of every run we take advantage of the isotopic step observed during the transition between mQ baseline and sample water. A smoothed version of the discrete derivative of the acquired isotope data for bothδ18O andδD reveals a local minimum (maximum) for the beginning (end) of the measurement (Fig. 3). The logged
10
depth of the top and the bottom of the CFA run is assigned to these points. Data that lie in the transition interval between mQ and sample water are manually removed from the series. Additional breaks within a CFA run that can possibly be created during the drilling or processing phase of the ice core, are taken into account at the last stage of the data analysis. If necessary and depending on their size, the gaps can be filled by
15
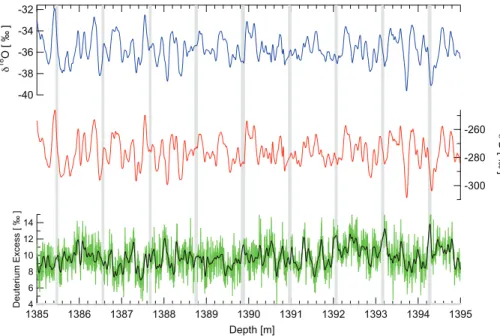
means of some interpolation technique. Here, due to the small size of the gaps we use a linear interpolation sceme. The use of more advanced methods is also possible but is out of the scope of this work. The processed profiles presented in Fig. 3 are reported with a nominal resolution of 5 mm. The interpolated sections are highlighted with gray bars. Their width indicates the length of the gaps.
20
3.3 Noise level – accuracy
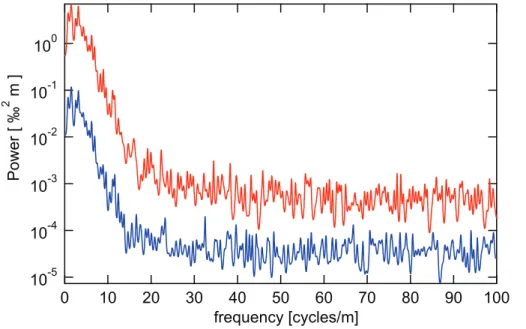
An estimate of the noise level of the measurements, can be obtained from the appro-priately normalized power spectral density of the time series. Here we implement an autoregressive spectral estimation method developed by Burg (1975) by the use of the algorithm introduced by Andersen (1974). The order of the autoregressive model is
25
AMTD
4, 4073–4104, 2011On-line water isotope analysis of ice cores
V. Gkinis et al.
Title Page
Abstract Introduction
Conclusions References
Tables Figures
◭ ◮
◭ ◮
Back Close
Full Screen / Esc
Printer-friendly Version Interactive Discussion
Discussion
P
a
per
|
Dis
cussion
P
a
per
|
Discussion
P
a
per
|
Discussio
n
P
a
per
|
can perform equally well. The standard deviation of the time series will be defined as:
σ2= Zfc
−fc|
ˆ
η(f)|2d f (2)
where the Nyquist frequency isfc=100 cycles m−1and|ηˆ(f)|2can be obtained by a lin-ear fit on the flat high frequency part of the spectrum (Fig. 4). By performing this analysis we obtainσ18=0.055 ‰ andσD=0.21 ‰.
5
In order to validate the quality of the calibrations as well as the estimated depth scale we compare the CFA data with measurements performed in a discrete fashion using the same IR-CRDS spectrometer in combination with a sample preparation evaporator system (Gupta et al., 2009) and an autosampler. The discrete samples are cut in a res-olution of 5 cm. The sample injection sequence takes into account apparent memory
10
effects and results are reported on the VSMOW scale by appropriate calibration us-ing local water standards. The results are illustrated in Fig. 5 forδ18O andδD. The comparison of the data sets demonstrates the accuracy of the CFA-CRDS measure-ment and therefore the validity of the followed calibration procedures. The benefits of the technique in terms of achieved resolution can be seen when one compares the
15
two datasets over isotopic cycles with relatively small amplitude and higher frequency. Such an example can be seen at the depth of 1390.5 m where a sequence of 4 cycles is sampled relatively poorly with the discrete method when compared to the on-line system. This performance can benefit studies that look into the spectral properties of the signals by providing better statistics for the obtained measurements.
20
3.4 Obtained resolution – diffusive sample mixing
One of the advantages of the combined CFA–CRDS technique for water isotopic anal-ysis of ice cores, lies in the potential for higher resolution measurements relative to discrete sampling. However, diffusion effects in both the liquid and the vapor phase, are expected to attenuate the obtained resolution.
AMTD
4, 4073–4104, 2011On-line water isotope analysis of ice cores
V. Gkinis et al.
Title Page
Abstract Introduction
Conclusions References
Tables Figures
◭ ◮
◭ ◮
Back Close
Full Screen / Esc
Printer-friendly Version Interactive Discussion
Discussion
P
a
per
|
Dis
cussion
P
a
per
|
Discussion
P
a
per
|
Discussio
n
P
a
per
|
Attenuation of the initial signal of the precipitation occurs also via a combination of in situ processes that take place after deposition. The porous medium of the firn column allows for an exchange of water molecules in the gas phase along the isotopic gradients of the profile. For the case of polar sites, this process has been studied extensively (Johnsen, 1977; Whillans and Grootes, 1985) and can be well described
5
and quantified provided that a good estimate of the diffusivity coefficient and a strain rate history of the ice core site are available (Johnsen et al., 2000). The process ceases when the porous medium is closed-off and the diffusivity of air reaches zero, at a density of≈804 kg m−3. Deeper in the ice, diffusion within the ice crystals takes place via a process that is considerably slower when compared with the firn diffusion.
10
At a temperature of−30◦C the diffusivity coefficients of these two processes differ by 4 orders of magnitude (Johnsen et al., 2000).
Assuming an isotopic signalδpr for the precipitation, the total effect of the diffusive
processes, in-situ and experimental, can be seen as the convolution of δpr(z) with
a smoothing filterGtot. 15
δm(z)=
Z∞
−∞
δpr(τ)Gtot(z−τ)d τ=[δpr∗Gtot](z) (3)
whereδm(z) is the measured signal and (∗) denotes the convolution operation. Since
instrumental and in-situ firn-ice diffusion are statistically independent, the variance of the total smoothing filter is the sum of the variances of the in-situ and experimental smoothing filters (hereafterGfirn,σfirn,Gcfa,σcfa).
20
σ2
tot=σ
2 firn+σ
2
cfa (4)
It can be seen that any attempt to study firn and ice diffusion by means of ice core data obtained with an on-line method similar to the one we present here, requires a good assesment of the diffusive properties of the experimental system. The latter is possible if one is able to estimate the variance of the smoothing filter Gcfa expressed by the
25
AMTD
4, 4073–4104, 2011On-line water isotope analysis of ice cores
V. Gkinis et al.
Title Page
Abstract Introduction
Conclusions References
Tables Figures
◭ ◮
◭ ◮
Back Close
Full Screen / Esc
Printer-friendly Version Interactive Discussion
Discussion
P
a
per
|
Dis
cussion
P
a
per
|
Discussion
P
a
per
|
Discussio
n
P
a
per
|
One way to approach this problem is to measure the response of the system to a step function. Ideally, in the case of zero diffusion, a switch between two isotopic levels would be described by a scaled and shifted version of the the Heaviside unit step function as:
δH(z)=
C2 z <0
C1H(z)+C2 z≥0
(5)
5
where the isotopic shift takes place atz=0,H(z) is the Heaviside unit step function and C1 andC2 refer to the amplitude and base line level of the isotopic step. Convolution
of the signal of Eq. (5) withGcfaand subsequent calculation of the derivative yields,
d δm
d z = d δH
d z ∗Gcfa=C1 d H
d t ∗Gcfa=C1δDirac∗Gcfa (6)
Thus the derivative of the measured signal, properly normalized, equals the impulse
10
respone of the system. Applying the Fourier transform, denoted by the overhead hat symbol, on Eq. (6), and by using the convolution theorem, we deduce the transfer function ˆGcfaof the system:
d
d δm
d z =C1δˆDirac·Gˆcfa=C1·Gˆcfa (7)
In the case of the system presented here, an isotopic transition can be observed
15
when the main CFA valve (V1 in Fig. 1) switches between mQ water and sample at the beginning and the end of each CFA run as shown in Fig. 3. By using these transitions we are able to construct isotopic steps and estimate the impulse response of the sys-tem. Such an isotopic step is illustrated in Fig. 6. We fit the data of Fig. 6 with a scaled version of the cumulative distribution function of a normal distribution described as
20
δmodel(z)=
C′1 2
"
1+erf z−z0 σstep
√ 2
!#
AMTD
4, 4073–4104, 2011On-line water isotope analysis of ice cores
V. Gkinis et al.
Title Page
Abstract Introduction
Conclusions References
Tables Figures
◭ ◮
◭ ◮
Back Close
Full Screen / Esc
Printer-friendly Version Interactive Discussion
Discussion
P
a
per
|
Dis
cussion
P
a
per
|
Discussion
P
a
per
|
Discussio
n
P
a
per
|
The values ofC′1,C′2,z0andσstepare estimated by means of a least square
optimiza-tion and used accordingly to normalize the length scale and the isotopic values of the step. A nominal melt rate of 3.2 cm min−1 is used for all the calculations presented here. We focus our analysis on theδD signal. The same approach can be followed for δ18O. In Fig. 6 we present the calculated impulse response of the system. The latter
5
can be well approximated by a Gaussian type filter described as:
Gcfa(z)=
1
σcfa
√ 2πe
− z2
2σ2
cfa (9)
The diffusion length term σcfa is equal to 13.4±0.17 mm [1σ] as calculated with the
least squares optimization. The transfer function for this filter will be given by its Fourier transform, which is itself a Gaussian and is equal to (Abramowitz and Stegun, 1964):
10
F[Gcfa(z)]=Gˆcfa=
Z∞
−∞ 1
σcfa
√ 2πe
− z2
2σcfa2
e−2πi f zd z=e
−k2σ2cfa
2 (10)
where k=2πf. Harmonics with an initial amplitude A0 and wavenumber k will be
attenuated to a final amplitude equal to:
A=A0e−
k2σ2cfa
2 (11)
An estimate of the transfer function based on the data and the cumulative distribution
15
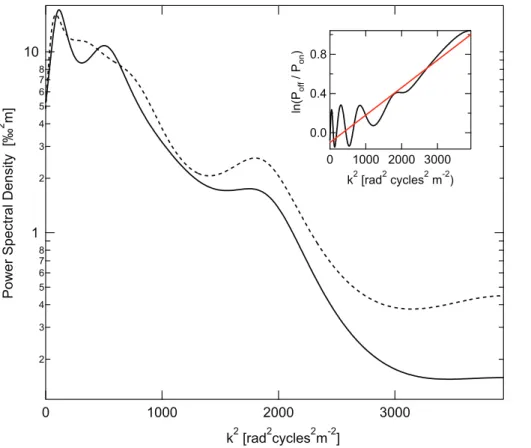
model is presented in Fig. 8 (blue and pink curve, respectively). As seen in this plot, cycles with wavelengths longer than 25 cm experience negligible attenuation, whereas cycles with a wavelength of 7 cm are attenuated by≈50 %.
The step response approach has been followed in the past for on-line chemistry data. In some studies such as Sigg et al. (1994) and Rasmussen et al. (2005), the resolution
20
AMTD
4, 4073–4104, 2011On-line water isotope analysis of ice cores
V. Gkinis et al.
Title Page
Abstract Introduction
Conclusions References
Tables Figures
◭ ◮
◭ ◮
Back Close
Full Screen / Esc
Printer-friendly Version Interactive Discussion
Discussion
P
a
per
|
Dis
cussion
P
a
per
|
Discussion
P
a
per
|
Discussio
n
P
a
per
|
is used as a measure of the obtained resolution of the system. A common weakness of this approach as applied in the current, as well as previous studies, is that it is based on the analysis of a step that is introduced in the analytical system by switching a valve that is typically situated downstream of the melting and the debubbling system. Consequently, the impact of these last two elements on the smoothing of the obtained
5
signals is neglected. In this study, this is the valve V1 in Fig. 1.
To overcome this problem we will present here an alternative way, based on the comparison of the spectral properties of the on-line CFA data and the off-line discrete data in 5 cm sampling resolution, presented in Sect. 3.2. In this approach the diffusion length of the total smothing filter for the off-line discrete analysis will be:
10
σo2ff=σfirn2 +σ5cm2 (12)
where σ5cm2 is the diffusion length of the smoothing imposed by the sample cutting sceme on a 5 cm resolution. If one averages the on-line CFA data on a 5 cm resolution by means of a running mean filter, the diffusion length of the total smoothing filter for the on-line CFA measurements averaged on a 5 cm resolution will be:
15
σon2 =σfirn2 +σ5cm2 +σ 2
cfa (13)
From Eqs. (12) and (13) we get:
σcfa2 =σon2 −σo2ff (14)
As a result, the termσon2 −σ 2
off is directly related to the diffusion length of the
smooth-ing filter of the whole CFA-water isotope system includsmooth-ing the meltsmooth-ing and debubblsmooth-ing
20
sections. Based on Eq. (11), the power spectral density of the signals will be:
P=P0e−k
2
σ2 (15)
whereσ2 refers in this case to σon2 orσ 2
off. Combining the power spectral densities of
the on-line and off-line time series we finally get:
ln
P
off
Pon
=ln
P
0off
P0on
+σcfa2 k2 (16)
AMTD
4, 4073–4104, 2011On-line water isotope analysis of ice cores
V. Gkinis et al.
Title Page
Abstract Introduction
Conclusions References
Tables Figures
◭ ◮
◭ ◮
Back Close
Full Screen / Esc
Printer-friendly Version Interactive Discussion
Discussion
P
a
per
|
Dis
cussion
P
a
per
|
Discussion
P
a
per
|
Discussio
n
P
a
per
|
Hence, the logarithm of the ratioPoff/Pon is linearly related tok 2
with a slope equal to σcfa2 . In Fig. 7 we perform this analysis forδD and by applying a linear fit we calculate theσcfa[D] to be equal to 16.4±2.4 mm. In a similar mannerσcfa[O18] is found to be
equal to 16.8±2.3 mm.
The higher value calculated with the spectral method points to the additional diffusion
5
of the sample at the melter and debubbler system that could not be considered in the analysis based on the step response. The impulse response of the system based on the updated value ofσcfa2 is presented in Fig. 6.
3.5 Optimal filtering
In the ideal case of a noise-free measured signalδm′ (z) and provided that the transfer 10
function ˆGcfais known, one can reconstruct the initial isotopic signalδi(z) from Eq. (3)
as:
δi(z)=
1 2π
Z∞
−∞ ˆ δm′ (ω)
ˆ G(ω) e
−i ωzd ω (17)
where the integral operation denotes the inverse Fourier transform andω=2πλ with λ being the wavelength of the isotopic signals. In the presence of measurement noise
15
η(z), this approach will fail due to excess amplification of the high frequency noise channels in the spectrum of the signal.
Hereby we use the Wiener approach in deconvoluting the acquired isotopic signals for the diffusion that takes place during the measurement. Considering a measured isotopic signal
20
AMTD
4, 4073–4104, 2011On-line water isotope analysis of ice cores
V. Gkinis et al.
Title Page
Abstract Introduction
Conclusions References
Tables Figures
◭ ◮
◭ ◮
Back Close
Full Screen / Esc
Printer-friendly Version Interactive Discussion
Discussion
P
a
per
|
Dis
cussion
P
a
per
|
Discussion
P
a
per
|
Discussio
n
P
a
per
|
an optimal filterϕ(z) can be constructed that when used at the deconvolution step, it results in an estimate of the initial isotopic signal described as:
˜
δi(z)= 1
2π
Z∞
−∞ ˆ δm(ω)
ˆ G(ω)
ˆ
ϕ(ω)e−i ωzd ω (19)
Assuming thatδm′ (z) andη(z) are uncorellated signals, the optimal filter is given by:
ˆ
ϕ(ω)= |δˆ
′
m(ω)| 2
|δˆm′(ω)|2+|ηˆ(ω)|2
(20)
5
(Wiener, 1949); where |δˆm′ (ω)| 2
and |ηˆ(ω)|2 are the power spectral densities of the signalsδm′(ω) andη(ω).
In the same fashion as in the previous section we assume that the spectrum of the noise free measured signal|δˆm′ (ω)|
2
, is described by Eq. (15) whereσ2=σtot2 .
Regard-ing the noise, we assume red noise described by an AR1 process. The spectrum of
10
the noise signal will then be described by (Kay and Marple, 1981):
|ηˆ(ω)|2= σ
2
η∆z
|1+a1exp(−2πi f∆z)|
2 (21)
whereση2is the variance of the noise anda1is the coefficient of the AR1 process. We
vary the parametersσtot2 ,P0,σ 2
η anda1so that the sum|δˆm(ω)| 2
=|δˆm′(ω)| 2
+|ηˆ(ω)|2fits the spectrum of the measured signal. The set of parameters that results in the optimum
15
fit is used to calculate the optimal filter.
The constructed filters together with the transfer functions that were calculated based on the two different techniques outlined in Sect. 3.4 are illustrated in Fig. 8. One can observe how the restoration filters work by amplifying cycles with wavelengths as low as 7 mm. Beyond that point, the shape of the optimal filter attenuates cycles with higher
20
AMTD
4, 4073–4104, 2011On-line water isotope analysis of ice cores
V. Gkinis et al.
Title Page
Abstract Introduction
Conclusions References
Tables Figures
◭ ◮
◭ ◮
Back Close
Full Screen / Esc
Printer-friendly Version Interactive Discussion
Discussion
P
a
per
|
Dis
cussion
P
a
per
|
Discussion
P
a
per
|
Discussio
n
P
a
per
|
amplification of the signals that are damped due to the instrumental diffusion, as well as in the filtering of the measurement noise.
3.6 Information on deuterium excess
Combiningδ18O andδD gives the deuterium excess as Dxs=δD−8δ 18
O (Craig et al., 1963; Mook, 2000). The noise level of the Dxssignal can be calculated by the estimated
5
noise levels ofδ18O andδD as:
σD xs=
q
σ2
D+64·σ
2
18=0.48 (22)
As seen in Fig. 10, the Dxs signal presents a low signal to noise ratio. In this case, the technique of optimal filtering can effectively attenuate unwanted high frequency noise components, thus reveiling a “clean” Dxssignal.
10
The latter offers the possibility for the study of abrubt transitions as they have previ-ously been investigated inδ18O,δD and Dxs time series from discrete high resolution
samples (Steffensen et al., 2008). The on-line fashion in which these measurements are performed has the potential to yield not only higher temporal resolution but also better statistics for those climatic transitions.
15
4 Summary and conclusions
We have succesfully demonstrated the possibility for on-line water isotopic analysis on a continuously melted ice core sample. We used an infra red laser spectrometer in a cavity ring down configuration in combination with a continuous flow melter system. A custom made continuous stream flash evaporator served as the sample preparation
20
unit, interfacing the laser spectrometer to the melter system.
AMTD
4, 4073–4104, 2011On-line water isotope analysis of ice cores
V. Gkinis et al.
Title Page
Abstract Introduction
Conclusions References
Tables Figures
◭ ◮
◭ ◮
Back Close
Full Screen / Esc
Printer-friendly Version Interactive Discussion
Discussion
P
a
per
|
Dis
cussion
P
a
per
|
Discussion
P
a
per
|
Discussio
n
P
a
per
|
cavity have been accounted for. The melting procedure is recorded by an optical en-coder that provides the necessary information for assigning a depth scale to the isotope measurements. We verified the validity of the applied calibrations and the calculated depth scale by comparing the CFA measurements with measurements performed on discrete samples in 5 cm resolution.
5
By means of spectral methods we provide an estimate of the noise level of the mea-surements. The combined uncertainty of the measurement is estimated at≈0.06, 0.2, and 0.5 ‰ for δ18O, δD and Dxs, respectively. This performance is comparable to, or better than the performance typically achieved with conventional IRMS systems in a discrete mode.
10
Based on the isotopic step at the beginning of each CFA run, the impulse response, as well as the transfer function of the system can be estimated. We show how this method does not take into account the whole CFA system, thus underestimating the sample diffusion that takes the place from the melter until the optical cavity of the spectrometer. We proposed a different method that considers the power spectrum of
15
the CFA data in combination with the spectrum of a data set over the same depth interval measured in a discrete off-line fashion. With the use of the optimal filtering deconvolution technique, provides a way to deconvolute the measured isotopic profiles. The combination of infra red spectroscopy on gaseuous samples with continuous flow melter systems provides new possibilities for ice core science. The non
destruc-20
tive, continuous and on-line technique, offers the possibility for analysis of multiple species on the same sample, in high resolution and precision and pottentially per-formed in the field.
Acknowledgements. We would like to thank Dorthe Dahl Jensen for supporting our research.
Numerous drillers, core processors and general field assistants have contributed to the NEEM
25
ice core drilling project with weeks of intensive field work. Withought this collective effort, the measurements we present here would not be possible. Bruce Vaughn and James White have contributed to this project with valuable comments and ideas. This project was partly funded by the Marie Curie Research Training Network for Ice Sheet and Climate Evolution (MRTN-CT-2006-036127).
AMTD
4, 4073–4104, 2011On-line water isotope analysis of ice cores
V. Gkinis et al.
Title Page
Abstract Introduction
Conclusions References
Tables Figures
◭ ◮
◭ ◮
Back Close
Full Screen / Esc
Printer-friendly Version Interactive Discussion
Discussion
P
a
per
|
Dis
cussion
P
a
per
|
Discussion
P
a
per
|
Discussio
n
P
a
per
|
References
Abramowitz, M. and Stegun, I. A.: Handbook of Mathematical Functions with Formulas, Graphs, and Mathematical Tables, Dover, New York, 1964. 4085
Andersen, N.: Calculation of filter coefficients for maximum entropy spectral analysis, Geo-physics, 39, 69–72, 1974. 4081
5
Begley, I. S. and Scrimgeour, C. M.: High-precisionδ2H andδ18O measurement for water and volatile organic compounds by continuous-flow pyrolysis isotope ratio mass spectrometry, Anal. Chem., 69, 1530–1535, 1997. 4076
Bigeleisen, J., Perlman, M. L., and Prosser, H. C.: Conversion of hydrogenic materials to hy-drogen for isotopic analysis, Anal. Chem., 24, 1356–1357, 1952. 4076
10
Brand, W. A., Geilmann, H., Crosson, E. R., and Rella, C. W.: Cavity ring-down spectroscopy versus high-temperature conversion isotope ratio mass spectrometry; a case study onδ2H andδ18O of pure water samples and alcohol/water mixtures, Rapid Commun. Mass Sp., 23, 1879–1884, doi:10.1002/rcm.4083, 2009. 4076, 4080
Burg, J. P.: Maximum Entropy Spectral Analysis, Ph.D. thesis, Stanford University, 1975. 4081
15
Craig, H., Gordon, L. I., and Horibe, Y.: Isotopic exchange effects in evaporation of water low-temperature experimental results, J. Geophys. Res., 68, 5079–5087, 1963. 4089
Crosson, E. R.: A cavity ring-down analyzer for measuring atmospheric levels of methane, carbon dioxide, and water vapor, Appl. Phys. B-Lasers O., 92, 403–408, 2008. 4078
Cuffey, K. M. and Vimeux, F.: Covariation of carbon dioxide and temperature from the Vostok
20
ice core after deuterium-excess correction, Nature, 412, 523–527, 2001. 4075 Dansgaard, W.: Stable isotopes in precipitation, Tellus, 16, 436–468, 1964. 4075
Epstein, S. and Mayeda, T.: Variations of18O content of waters from natural sources, Geochim. Cosmochim. Ac., 4, 213–224, 1953. 4075, 4076
Gkinis, V., Popp, T. J., Johnsen, S. J., and Blunier, T.: A continuous stream flash evaporator
25
for the calibration of an IR cavity ring down spectrometer for isotopic analysis of water, Isot. Environ. Health S., 46, 1–13, 2010. 4078, 4079, 4080
Gupta, P., Noone, D., Galewsky, J., Sweeney, C., and Vaughn, B. H.: Demonstration of high-precision continuous measurements of water vapor isotopologues in laboratory and remote field deployments using wavelength-scanned cavity ring-down spectroscopy (WS-CRDS)
30
technology, Rapid Commun. Mass Sp., 23, 2534–2542, 2009. 4082
AMTD
4, 4073–4104, 2011On-line water isotope analysis of ice cores
V. Gkinis et al.
Title Page
Abstract Introduction
Conclusions References
Tables Figures
◭ ◮
◭ ◮
Back Close
Full Screen / Esc
Printer-friendly Version Interactive Discussion
Discussion
P
a
per
|
Dis
cussion
P
a
per
|
Discussion
P
a
per
|
Discussio
n
P
a
per
|
ratios of water or ice by continuous-flow isotope ratio mass spectrometry, Rapid Commun. Mass Sp., 17, 1319–1325, 2003. 4076
Johnsen, S.: Stable isotope homogenization of polar firn and ice, , Isotopes and Impurities in Snow and Ice, 210–219, 1977. 4083
Johnsen, S. J., Dansgaard, W., and White, J. W. C.: The origin of Arctic precipitation under
5
present and glacial conditions, Tellus, 41B, 452–468, 1989. 4075
Johnsen, S. J., Clausen, H., Dansgaard, W., Fuhrer, K., Gundestrup, N., Hammer, C., Iversen, P., Jouzel, J., Stauffer, B., and Steffensen, J.: Irregular glacial interstadials recorded in a new Greenland ice core, Nature, 359, 311–313, 1992. 4075
Johnsen, S. J., Clausen, H. B., Cuffey, K. M., Hoffmann, G., Schwander, J., and Creyts, T.:
10
Diffusion of stable isotopes in polar firn and ice. The isotope effect in firn diffusion, in: Physics of Ice Core Records, edited by: Hondoh, T., Hokkaido University Press, Sapporo, 121–140, 2000. 4075, 4083
Johnsen, S. J., Dahl Jensen, D., Gundestrup, N., Steffensen, J. P., Clausen, H. B., Miller, H., Masson-Delmotte, V., Sveinbj ¨ornsd ´ottir, A. E., and White, J. W. C.: Oxygen isotope and
15
palaeotemperature records from six Greenland ice-core stations: Camp Century, Dye-3, GRIP, GISP2, Renland and NorthGRIP, J. Quaternary Sci., 16, 299–307, 2001. 4075 Jouzel, J. and Merlivat, L.: Deuterium and oxygen 18 in precipitation: modeling of the isotopic
effects during snow formation, J. Geophys. Res.-Atmos., 89, 11749–11759, 1984. 4075 Jouzel, J., Alley, R. B., Cuffey, K. M., Dansgaard, W., Grootes, P., Hoffmann, G., Johnsen, S. J.,
20
Koster, R. D., Peel, D., Shuman, C. A., Stievenard, M., Stuiver, M., and White, J. W. C.: Validity of the temperature reconstruction from water isotopes in ice cores, J. Geophys. Res.-Oceans, 102, 26471–26487, 1997. 4075
Kaufmann, P. R., Federer, U., Hutterli, M. A., Bigler, M., Sch ¨upbach, S., Ruth, U., Schmitt, J., and Stocker, T. F.: An improved continuous flow analysis system for high-resolution field
25
measurements on ice cores, Environ. Sci. Technol., 42, 8044–8050, 2008. 4077, 4078, 4085
Kavanaugh, J. L. and Cuffey, K. M.: Generalized view of source-region effects on δD and deuterium excess of ice-sheet precipitation, Ann. Glaciol., 35, 111–117, 2002. 4075
Kay, S. M. and Marple, S. L.: Spectrum analysis – a modern perspective, P. IEEE, 69, 1380–
30
1419, 1981. 4088
AMTD
4, 4073–4104, 2011On-line water isotope analysis of ice cores
V. Gkinis et al.
Title Page
Abstract Introduction
Conclusions References
Tables Figures
◭ ◮
◭ ◮
Back Close
Full Screen / Esc
Printer-friendly Version Interactive Discussion
Discussion
P
a
per
|
Dis
cussion
P
a
per
|
Discussion
P
a
per
|
Discussio
n
P
a
per
|
Kerstel, E. R. T., van Trigt, R., Dam, N., Reuss, J., and Meijer, H. A. J.: Simultaneous deter-mination of the2H/1H,17O/16O and18O/16O isotope abundance ratios in water by means of laser spectrometry, Anal. Chem., 71, 5297–5303, 1999. 4076
Lis, G., Wassenaar, L. I., and Hendry, M. J.: High-precision laser spectroscopy D/H and O-18/O-16 measurements of microliter natural water samples, Anal. Chem., 80, 287–293,
5
2008. 4076
Mook, W.: Environmental Isotopes in the Hydrological Cycle: Principles and Applications, Vol. I, International Atomic Energy Agency, 2000. 4075, 4089
NGRIP members: High-resolution record of Northern Hemisphere climate extending into the last interglacial period, Nature, 431, 147–151, 2004. 4075
10
Rasmussen, S. O., Andersen, K. K., Johnsen, S. J., Bigler, M., and McCormack, T.: Deconvolution-based resolution enhancement of chemical ice core records obtained by con-tinuous flow analysis, J. Geophys. Res.-Atmos., 110, doi:10.1029/2004JD005717, 2005. 4085
Rasmussen, S. O., Andersen, K. K., Svensson, A. M., Steffensen, J. P., Vinther, B. M.,
15
Clausen, H. B., Siggaard-Andersen, M. L., Johnsen, S. J., Larsen, L. B., Dahl-Jensen, D., Bigler, M., R ¨othlisberger, R., Fischer, H., Goto-Azuma, K., Hansson, M. E., and Ruth, U.: A new Greenland ice core chronology for the last glacial termination, J. Geophys. Res.-Atmos., 111, doi:10.1029/2005JD006079, 2006. 4080
R ¨othlisberger, R., Bigler, M., Hutterli, M., Sommer, S., Stauffer, B., Junghans, H. G., and
Wa-20
genbach, D.: Technique for continuous high-resolution analysis of trace substances in firn and ice cores, Environ. Sci. Technol., 34, 338–342, 2000. 4077, 4085
Sch ¨upbach, S., Federer, U., Kaufmann, P. R., Hutterli, M. A., Buiron, D., Blunier, T., Fischer, H., and Stocker, T. F.: A new method for high-resolution methane measurements on polar ice cores using continuous flow analysis, Environ. Sci. Technol., 43, 5371–5376, 2009. 4077,
25
4078
Sigg, A., F ¨uhrer, K., Anklin, M., Staffelbach, T., and Zurmuhle, D.: A continuous analysis tech-nique for trace species in ice cores, Environ. Sci. Technol., 28, 204–209, 1994. 4077, 4085 Steffensen, J., Andersen, K., Bigler, M., Clausen, H., Dahl-Jensen, D., Fischer, H.,
Goto-Azuma, K., Hansson, M., Johnsen, S., Jouzel, J., Masson-Delmotte, V., Popp, T. J.,
30
AMTD
4, 4073–4104, 2011On-line water isotope analysis of ice cores
V. Gkinis et al.
Title Page
Abstract Introduction
Conclusions References
Tables Figures
◭ ◮
◭ ◮
Back Close
Full Screen / Esc
Printer-friendly Version Interactive Discussion
Discussion
P
a
per
|
Dis
cussion
P
a
per
|
Discussion
P
a
per
|
Discussio
n
P
a
per
|
Vaughn, B. H., White, J. W. C., Delmotte, M., Trolier, M., Cattani, O., and Stievenard, M.: An automated system for hydrogen isotope analysis of water, Chem. Geol., 152, 309–319, 1998. 4076
Whillans, I. and Grootes, P.: Isotopic diffusion in cold snow and firn, J. Geophys. Res., 90, 3910–3918, 1985. 4083
5
AMTD
4, 4073–4104, 2011On-line water isotope analysis of ice cores
V. Gkinis et al.
Title Page
Abstract Introduction
Conclusions References
Tables Figures
◭ ◮
◭ ◮
Back Close
Full Screen / Esc
Printer-friendly Version Interactive Discussion
Discussion
P
a
per
|
Dis
cussion
P
a
per
|
Discussion
P
a
per
|
Discussio
n
P
a
per
|
W
a
st
e Li
n
e
En
h
a
n
c
in
g
Bac
k
P
ress
u
re
T2 T1
To
W
as
te
Drierite
Std Water 4 Std Water 3
Std Water 2
Std Water 1
Ic
e C
or
e
Sam
pl
e
Melter Oven
mQ water
To
C
h
emistr
y
T3 Dry Air
30 ml/min
0.1 ml/min
0.1 ml/min Cavity
50 mbar 30 ml/min Lab Air
Exhaust
Debu
b
b
ler
To
W
as
te
mQ
To
Ga
s
E
xtr
a
c
tio
n
16 ml/min
AMTD
4, 4073–4104, 2011On-line water isotope analysis of ice cores
V. Gkinis et al.
Title Page
Abstract Introduction
Conclusions References
Tables Figures
◭ ◮
◭ ◮
Back Close
Full Screen / Esc
Printer-friendly Version Interactive Discussion
Discussion
P
a
per
|
Dis
cussion
P
a
per
|
Discussion
P
a
per
|
Discussio
n
P
a
per
|
d
d
AMTD
4, 4073–4104, 2011On-line water isotope analysis of ice cores
V. Gkinis et al.
Title Page
Abstract Introduction
Conclusions References
Tables Figures
◭ ◮
◭ ◮
Back Close
Full Screen / Esc
Printer-friendly Version Interactive Discussion
Discussion
P
a
per
|
Dis
cussion
P
a
per
|
Discussion
P
a
per
|
Discussio
n
P
a
per
|
d
8 4 0 -4 -8
Dd
d
!
d
AMTD
4, 4073–4104, 2011On-line water isotope analysis of ice cores
V. Gkinis et al.
Title Page
Abstract Introduction
Conclusions References
Tables Figures
◭ ◮
◭ ◮
Back Close
Full Screen / Esc
Printer-friendly Version Interactive Discussion
Discussion
P
a
per
|
Dis
cussion
P
a
per
|
Discussion
P
a
per
|
Discussio
n
P
a
per
|
d
d
AMTD
4, 4073–4104, 2011On-line water isotope analysis of ice cores
V. Gkinis et al.
Title Page
Abstract Introduction
Conclusions References
Tables Figures
◭ ◮
◭ ◮
Back Close
Full Screen / Esc
Printer-friendly Version Interactive Discussion
Discussion
P
a
per
|
Dis
cussion
P
a
per
|
Discussion
P
a
per
|
Discussio
n
P
a
per
|
d
!"#$
d
!"#$
(a) %
&"
'
d
!"#$
(b)
AMTD
4, 4073–4104, 2011On-line water isotope analysis of ice cores
V. Gkinis et al.
Title Page
Abstract Introduction
Conclusions References
Tables Figures
◭ ◮
◭ ◮
Back Close
Full Screen / Esc
Printer-friendly Version Interactive Discussion
Discussion
P
a
per
|
Dis
cussion
P
a
per
|
Discussion
P
a
per
|
Discussio
n
P
a
per
|
!
"
"
"
#
$$
%
&
!&
AMTD
4, 4073–4104, 2011On-line water isotope analysis of ice cores
V. Gkinis et al.
Title Page
Abstract Introduction
Conclusions References
Tables Figures
◭ ◮
◭ ◮
Back Close
Full Screen / Esc
Printer-friendly Version Interactive Discussion
Discussion
P
a
per
|
Dis
cussion
P
a
per
|
Discussion
P
a
per
|
Discussio
n
P
a
per
|
!" # Power d(w)
d $(w)
h(w)
d(w)
% %
&'"(
% % %
!" #
(
)* " ( )* " % )* " ( + , % -
. ( + , % . %
(a) (b)
AMTD
4, 4073–4104, 2011On-line water isotope analysis of ice cores
V. Gkinis et al.
Title Page
Abstract Introduction
Conclusions References
Tables Figures
◭ ◮
◭ ◮
Back Close
Full Screen / Esc
Printer-friendly Version Interactive Discussion
Discussion
P
a
per
|
Dis
cussion
P
a
per
|
Discussion
P
a
per
|
Discussio
n
P
a
per
|
d
d