ISSN 1546-9239
© 2007 Science Publications
Corresponding Author: Kamran Hassani, Department of Biomedical Engineering, Amirkabir University of Technology, Tehran, Iran
Simulation of Aorta Artery Aneurysms Using Active Electronic Circuit
1
Kamran Hassani, 2Mahdi Navidbakhsh and 3Mostafa.Rostami
1Department of Biomedical Engineering, Amirkabir University of Technology, Tehran, Iran 2Department of Mechanical Engineering, Iran University of Science and Technology,Tehran, Iran
3Department of Biomedical Engineering, Amirkabir University of Technology, Tehran, Iran
Abstract: The fusiform and saccular aneurysms in different aorta artery sections were studied using
an electronic circuit of cardiovascular system. The geometrical model of each artery section including thoracic and abdominal were generated in accordance with original anatomical data. By increasing the rate of aneurysm in each studied section, the pressure drop were calculated using CFD method, furthermore the compliance variations due to aneurysms were determined by mathematical method. The equivalent electronic circuit was then used to study the effects of the pressure drops and compliance variations on whole cardiovascular system. The results of the simulation exhibited the features of the pathology, including hypertension, the increase of the pulse pressure with the rate of aneurysm and the large magnitude of back flow during systole. Finally, the obtained results were compared with relevant clinical data .We have concluded from the study that aorta aneurysms in both fusiform and saccular, especially at highest diameters, may be the most important determinant of the artery rapture and heart failure.
Keywords: Aneurysm, aorta, electronic circuit, simulation , CFD, cardiovascular system
INTRODUCTION
Aortic aneurysm is a degenerative disease, which is defined as focal or diffuse dilatation of the aorta usually caused by arteriosclerosis. Most of aorta aneurysms are fusiform (concentric radial dilatation) but infrequently may be saccular (concentric radial dilatation). The method of modeling the cardiovascular system has previously been applied to the study of system pathologies by a number of authors[1-5]. These studies can be grouped loosely into two approaches: highly idealized models which are concerned with a simple cardiovascular system and very complex models which have attempted to predict the detailed behavior of cardiovascular system and one special pathology. In the more complex models, it is impossible to combine mechanical and electrical characteristics and different types of disorders can not be studied. In this study, we have taken a slightly different approach to the modeling of cardiovascular disorders and tried to exhibit the effects of aorta aneurysms on the cardiovascular system using combination of haemodynamics and electrical parameters. We have tried to advance existing models by dividing aorta to different sections in order to study the pathology accurately, meanwhile the arterial system
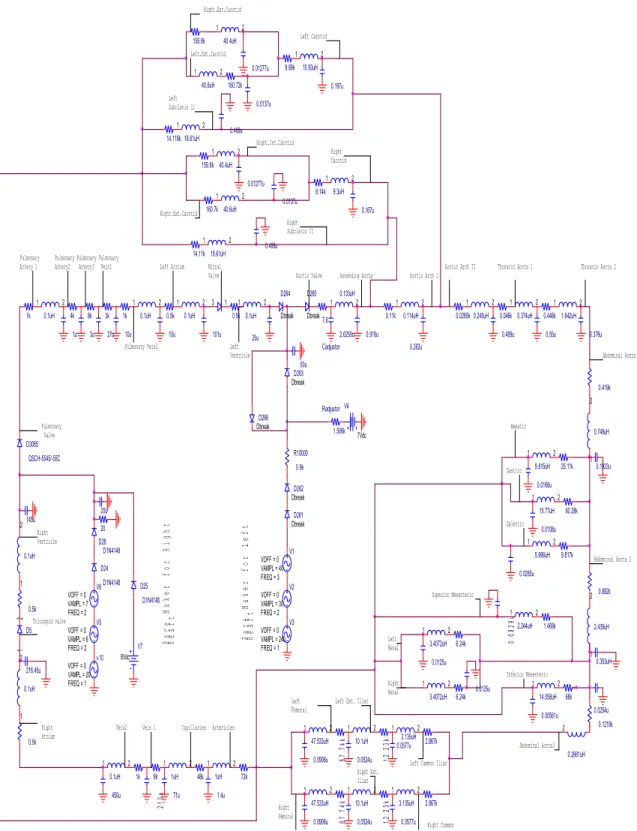
of the model are more detailed. Firstly, We modeled the cardiovascular system with an equivalent circuit and active elements[6] to enable us to show the normal and abnormal operation of the system then, in order to study the influence of aorta aneurysms, the geometry of different section of the artery including abdominal and thoracic were generated. The pressure drops which are caused by aneurysms were determined using CFD method. The compliance variations in the aorta section with aneurysm were also determined by mathematical method. We then alter the haemodynamic parameters including pressure and compliance to their electrical counterparts, voltage and capacity, to explore the effects of the disorder on the presented electronic circuit.
approach, but we do believe that the model can be used in study of many pathologies such as aneurysms or stenosis.
MATERIALS AND METHODS
Model simulation principles: This study has been
conducted in biomedical engineering laboratory of Amirkabir University since 2005.We have used two separate method of simulation. First using CFD method, the pressure drops of each section with respect to different aneurysm sizes are obtained and the compliances are calculated as well. The diameter and length of different aorta sections including abdominal and thoracic have been obtained from the medical texts[12] and[13]. The aneurysm with different sizes have been located in the middle of each section because surgical observations confirm that most fusiform and saccular aneurysms occur in the area which is near to middle of the artery, furthermore saccular aneurysms occur mostly in abdominal section but fusiform aneurysms occur both in abdominal and thoracic sections[14]. The blood flow has been assumed to be laminar, Newtonian, incompressible and pulsatile. Since aorta is a big artery therefore the blood flow is always considered to be incompressible with constant density[1]. The applied pulsatile flow Which has been extracted from experimental data[2] is according to Equation (1):
Q = 1.05+2.407 Sin (6.283t+0.552)+2.324 Sin (12.566t-1.096) -0.921 Sin (18.849t+0.7384)
-0.398Sin(25.132t-0.082) (1) The unit of flow (Q) is ml/s and the degrees are according to radian. Using this equation, one C program file has been written for each section to enable software to apply appropriate unsteady velocity profile to the inlets. By dividing flow to each artery section area, the inlet pulsatile velocity of each section can be calculated. In the next part, the compliance of aorta in both healthy and abnormal conditions is determined. The compliance of a elastic vessel with certain diameter and length is calculated[2] according to Equation (2): C=(3П.r3.Z)/2Eh (2)
In this Equation, (r) is radius of the vessel, (Z) length, (E) elastic module and (h) is the thickness of the vessel. The Compliance of aorta in healthy condition can be calculated by Equation (2). In order to determine the compliance of each aorta section with aneurysm, first the relation of (r) and (Z) shall be determined by Equation (3) for saccular aneurysms and Equation (4) for fusiforms:
r(x)=aSin(Пx) + b (4)
The a, b and c parameters can be determined for each size of aneurysm in different aorta sections. The compliance of the abnormal aorta sections is calculated by integration of Equation (2) with respect to Equation (3) or (4). The limits of the integral are the points in which the aneurysm starts and ends on each studied aorta section . It shall be noted that abdominal aorta has been divided into three sections of I, II and III as well as thoracic aorta which is divided into two sections of I and II. The pressure drops, and compliance values of aorta sections are determined and calculated individually.
System description: Using CFD method, the pressure
20u
V2
FREQ = 2 VAMPL = 30 VOFF = 0
47.533uH 1 2 0.262u 3k 3.4072uH 1 2 Right Ext. Iliac 14.118k Right Common Iliac 159.8k V3
FREQ = 1 VAMPL = 240 VOFF = 0
5.996uH 1 2 Radjustor 1.506k V7 8Vdc 2.439uH 1 2 1uH 1 2 Abdominal Aorta3 0.0168u 1uH 1 2 9.89k 0.0906u Left Femoral 10.1uH 1 2 0.0254u Tricuspid valve 9k 12. 23k 40.6uH 1 2 210u Aortic Valve 0.5k 450u 2.244uH 1 2 Right Ventricle V5
FREQ = 2 VAMPL = 6 VOFF = 0
0.114uH 1 2 68k 0.5k 1k v10
FREQ = 1 VAMPL = 20 VOFF = 0
0.0108u
Abdominal Aorta 2 Ascending Aorta
Pace
Maker for Right
Hear t 10.93uH 1 2 0.5k Right Carotid 0.489u Dbreak D265 0.489u Pulmonary Valve 50u 1k 0.1uH 1 2 0.046k 9.815uH 1 2 101u Left Subclavin II 10u 12 .23 k
Aortic Arch I
0.0285u Mitral Valve Cadjustor 2.6259u Pace Make
r for Left
Heart Left
Renal
V1
FREQ = 3 VAMPL = 40 VOFF = 0
0.1uH 1 2 1.4u 0.1uH 1 2
Aortic Arch II
2.867k 14.11k 1.468k 0.1uH 1 2 Left Ventricle 6.24k 40.6uH 1 2 0.245uH 1 2 0.167u D24 D1N4148 0.01277u 0.353uH 20 0.133uH 1 2 Right.Ext.Carotid
Thoracic Aorta 1
1k Left Atrium Dbreak D266 0.419k 3.4072uH 1 2 72k 10u 40.4uH 1 2 V4 7Vdc 216.45u
Abdominal Aorta 1
Vein2
160.72k
3 1
Thoracic Aorta 2
0.0125u V6
FREQ = 2 VAMPL = 7 VOFF = 0
Pulmonary Vein2 3u 145u 1u 0.374uH 1 2 D25 D1N4148 10.1uH 1 2 Splentic Hepatic Vein 1 0.01277u Right Subclavin II 0.882k 6.24k 1.642uH 1 2 27u Pulmonary Vein1 0.00561u 8k 0.1uH 1 2 Dbreak D264 0. 0 829u Right Renal Left.Ext.Carotid 0.918u Dbreak D263 Right.Ext.Carotid 0.0265k 0.749uH 1 2 4k D3065 QSCH-5545/-55C 0.1933u 160.7k 0.0577u 0.0524u 0.1uH 1 2 Pulmonary Artery3 3.135uH 1 2 0.489u 159.8k 87 .74 k Dbreak D262 Pulmonary Artery2 15.77uH 1 2 87. 74k Capillaries Inferior Mesenteric 0.0524u 0.5k R10000 0.9k Dbreak D261 9.3uH 1 2 18.61uH 1 2 0.11k 0.197u 3.135uH 1 2 0.0137u Gastric 25.11k 18.61uH 1 2 0.0125u 60.28k 0.1uH 1 2 0.0906u 40.4uH 1 2 8.14k 71u D28 D1N4148
Left Ext. Iliac
Superior Mesenteric 0.446k Left Carotid 9.817k Right.Int.Carotid 25u 7.6 Pulmonary Artery 1 D5 1 2 14.058uH 1 2 47.533uH 1 2 0.2661uH 1 2
Left Common Iliac
Arterioles 0.1218k 0.0137u 2.867k 0.376u 48k 0.55u 0.0577u Right Atrium Right Femoral
The frequency is 1 Hz and the correlation between electrical characteristics of the system and their mechanical counterparts are as follow:
1mmHg = 1 volt (pressure~ voltage)
1ml/pa = 1000 µF (compliance~ capacitance) 1 pa.s/ml = 1kΩ (resistance)
1 pa.s2/ml =1 µH (inertia ~ inducer)
Essentially the energy of systolic contraction is modeled by superposition of three voltage suppliers and diodes. These sources are amplifiers and the input of them are connected to the capacitors and resistors simulating aorta and other arteries. Thus during systole the voltage from the adjusting capacitor (C) is amplified and applied to other capacitors of the circuit. The pressure drop and the compliance of each studied section are converted to their electrical counterparts which are resistance and capacitance. The values have been applied to the related part on the electronic circuit for studying the effects. Later, the pressure graphs of each studied section is obtained by running the circuit.
RESULTS
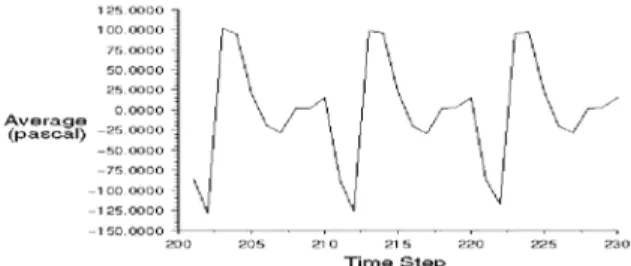
The pressure drops of different aorta sections with aneurysm have been determined and shown in Table 1. As it can been seen, the range of pressure drops that have calculated for each section does not show significant difference among the obtained values. The graph of pressure-time for saccular aneurysm of abdominal III (90%) as well as its pressure contour are shown in Fig. 2 and 3. The pulsatile curve of Fig. 2 has the systolic pressure of 100 pascal which is referred to pressure drops due to Aneurysm of abdominal aorta III in saccular form. The graph mimics the Equation 1 accurately , applied to inlet of the vessel. The pressure distribution of Abdominal III aneurysm with 90 percent diameter can be seen in Fig. 2 where the pressure decreases with distance away from the inlet, the shape of saccular aneurysm can also be observed in the figure. During the simulation, the back flow was seen in the outlet of the vessels due to aneurysm. It shall be noted that CFD method has only used to calculate the pressure drops due to aneurysm and flow analysis has not done in this study. The similar graphs for thoracic I aneurysm in fusiform have been shown in Fig. 4 and Fig. 5.The uniform shape of fusiform aneurysm can be compared with saccular. As it can be understood from the pressure graph of this section , the pressure drop in systolic phase in near to 25 pascal but other results are similar to previous one. The total results regarding pressure drops and compliance variations are listed in
Fig. 2: Pressure graph of abdominal III saccular aorta aneurysm with 90% diameter increase
Fig. 3: Pressure contour of saccular abdominal III aorta aneurysm with 90% diameter increase
Fig. 4: Pressure contour of fusiform thoracic I aorta aneurysm with 50% diameter increase
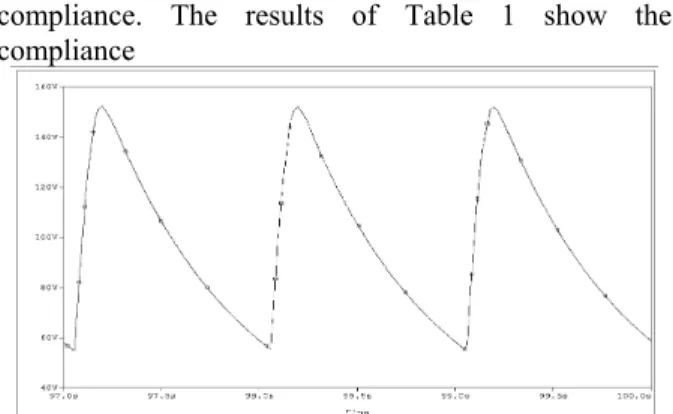
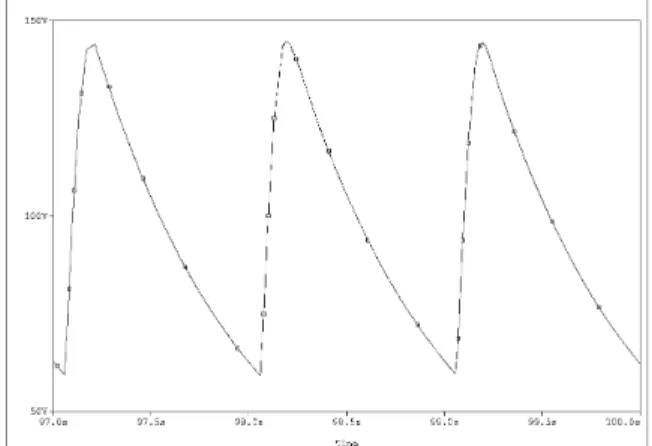
The pressure drops in all section decrease with increase of aneurysm diameter as compliance increases with the rate of aneurysm diameter. The Fig. 6-9 indicate the pressure graphs which have been obtained from the electronic circuit. The relating results have been included in the Table 1 in the Diastol/Systol section ,last two columns. The graphs have been obtained by running the circuit after changing of parameters in the relevant parts of aorta section. Reviewing the Fig. 6-9, We understand the increase of systolic and diastolic pressures with the rate of aneurysm
Table 1: Values of pressure drops, calculated compliances and final Diastolic/Systolic pressures of different sections of Aorta affected by Aneurysm both in fusiform and saccular shapes. Please note that the Diastolic/Systolic pressures are approximate
Abdominal I (Dia=12.2mm, L=63mm)
∆P systole (pa)
(fusiform)
Caneurysm (ml/kpa)
(fusiform)
∆P systole (pa)
(saccular)
Caneurysm (ml/kpa)
(saccular)
Diastol/Systole Pressure(mmHg) (fusiform)
Diastol/Systole Pressure(mmHg) (Saccular)
20% Aneurysm 70.34 0.212 84.3 0.1985 55-150 55-155
40% Aneurysm 69.9 0.302 79 0.2038 55.2-149.7 55.3-154
50% Aneurysm 69 0.36 76.4 0.22836 56-149.2 55.2-153
70% Aneurysm 65 0.504 74.6 0.28677 56.8-148.7 56.1-152.1
90% Aneurysm 59.5 0.692 74.1 0.3587 58-148 56.8-151
Abdominal II (Dia=11.7mm, L=116mm)
∆P systole (pa)
(fusiform)
Caneurysm (ml/kpa)
(fusiform)
∆P systole (pa)
(saccular)
Caneurysm (ml/kpa)
(saccular)
Diastol/Systole Pressure(mmHg) (fusiform)
Diastol/Systole Pressure (Saccular)
20% Aneurysm 83.4 0.4785 87.9 0.4454 58-158 57-156
40% Aneurysm 75.73 0.805 85 0.5678 60-155 59-155
50% Aneurysm 74.8 1.0 84.2 0.6438 62-152 60-154
70% Aneurysm 62.4 1.385 83 0.745 64-148 61.5-152
90% Aneurysm 61.5 2.55 82.1 1.0625 70-147 63-150
Abdominal III (Dia=10.4mm, L=10mm)
∆P systole (pa)
(fusiform)
Caneurysm (ml/kpa)
(fusiform)
∆P systole (pa)
(saccular)
Caneurysm (ml/kpa)
(saccular)
Diastol/Systole Pressure(mmHg) (fusiform)
Diastol/Systole Pressure (Saccular)
20% Aneurysm 70.4 0.225 114 0.03184 55-151 55-163
40% Aneurysm 69.6 0.3099 110 0.0406 54-150 56-161
50% Aneurysm 69.1 0.362 105 0.04603 53.8-149.7 57-160
70% Aneurysm 64 0.489 100.8 0.0592 52-148 59-159.2
90% Aneurysm 58.37 0.65 97.6 0.07605 55-146 60-158.3
Thoracic I (Dia=20mm, L=52mm)
∆P systole (pa)
(fusiform)
Caneurysm (ml/kpa)
(fusiform)
∆P systole (pa)
(saccular)
Caneurysm (ml/kpa)
(saccular)
Diastol/Systole Pressure(mmHg) (fusiform)
Diastol/Systole Pressure (Saccular)
20% Aneurysm 26.2 0.61475 - - 53-135 -
40% Aneurysm 23.4 0.846 - - 54-133 -
50% Aneurysm 21.9 0.9915 - - 56-132.5 -
70% Aneurysm 21.5 1.347 - - 56.5-132 -
90% Aneurysm 20.66 1.7984 - - 59-130 -
Thoracic II (Dia=13.5mm, L=104mm)
∆P systole (pa)
(fusiform)
Caneurysm (ml/kpa)
(fusiform)
∆P systole (pa)
(saccular)
Caneurysm (ml/kpa)
(saccular)
Diastol/Systole Pressure(mmHg) (fusiform)
Diastol/Systole Pressure (Saccular)
20% Aneurysm 63.7 0.505 - - 57-149 -
40% Aneurysm 51.05 0.918 - - 61-147 -
50% Aneurysm 50.75 1.15 - - 61.8-146.5 -
70% Aneurysm 44.05 1.775 - - 66-143.5 -
90% Aneurysm 42.2 2.6259 - - 68-142 -
The pulse pressure, systolic minus diastolic, have been increased respectively. There is not any unstable peak in the graphs and all waves are in the same level. The hypertension phenomena can be resulted from the graphs meaning that the main effect of aorta aneurysm is increase of blood pressure. It shall be noted that Fig. 6 shows the normal operation of aorta which indicates the pressure variation between 80-120 mmHg (volt). The compliances which have been calculated by Equations and listed in Table 1 imply the increase of compliance with the rate of aneurysm and this is because of diameter increasing in the aneurysms .
DISCUSSIONS AND CONCLUSION
Fig. 5: Pressure graph of fusiform thoracic I aorta aneurysm with 50% diameter increase
Fig. 6: Pressure graph of normal aorta varying between 80-120 volt (mmHg)
Fig. 7: Pressure graph of saccular abdominal I aorta aneurysm with 20% diameter increase
Comparing the values of diastolic and systolic pressure of aneurysm aorta which are shown in Table 1 with clinical data confirms the results of simulation. We see hypertension phenomena in all of the studied sections. It is right that aneurysm of aorta causes local pressure drops according to our model or natural condition but the total effects of aorta aneurysm on the cardiovascular is increase of blood pressure due to many other factors such as fibrillin. The most effective factor which
compliance. The results of Table 1 show the compliance
Fig. 8: Pressure graph of saccular abdominal I aorta aneurysm with 70% diameter increase
Fig. 9: Pressure graph of fusiform abdominal II aorta aneurysm with 40% diameter increase.
Fig. 10: Pressure graph of fusiform abdominal II aorta aneurysm with 90% diameter increase
reduced concentration of aortic elastin both have been associated with abdominal aorta aneurysm. Therefore, genetic parameters and their variations could also affect on the elastic properties of the aorta and an important rule of aneurysm growth. It shall be noted that although elasticity module (E) decreased as a result of aneurysm which means that large aneurysms tended to be less compliant but the relationship is weak[7]. The study of 12 patients observed that there was an inverse relationship between maximum diameter of aneurysm, E and stiffness. The abdominal aneurysm aorta expansion was only associated with a significant increase in E and stiffness in non operated aneurysm[7]. However, the criteria for open repair were not clearly defined. The relationship between E, stiffness and abdominal aorta aneurysm size thus seems to remain complex. The differences in reported results could be related to differences in numbers of patients included in studies as well as methods of statistical analysis. Our method has shown that compliance of aneurysm aorta increased with the rate of aneurysm size growth. This is according to experimental observations[7]. Our results show that abdominal I aneurysm of aorta causes the pulse pressure (systole minus diastole) to rise from normal value of 40mmHg (volt) to average of 96 mmHg. These values are calculated for abdominal II equal to 82 mmHg (volt), 96 mmHg (volt) for abdominal I, 77mmHg for thoracic I and 85 mmHg for thoracic II. The physiological observations show the total pulse pressure of 52.5 to 120 mmHg for abdominal aortic aneurysms depending on the size of aneurysm[9] and[10] furthermore, there is not any relationship among the pulse pressure of aorta sections because their lengths and diameters are completely different. All other pressure graphs have been obtained for the sections but are not brought here. We can express that our electronic circuit as well as the calculations of the pressure drops and compliances are in good agreement with physiological data. The other experimental data show the association between some genetic factors like fibrillin-I genotype and blood pressure in patients with abdominal aorta aneurysm. In contrast, in this same group of patients there were no associations between blood pressure and the other genetic factors such as the type III collagen. This factor encodes important structural proteins of aortic matrix which causes decrease of compliance. In conclusion, we suggest first that variations in the genetic factors modulates the elastic properties of the aorta to influence arterial pulse pressure and second that in consequence variation of diameter and E influences the blood pressure which cause hypertension in case of aortic
aneurysm. Before drawing conclusions about our results, we would like to reiterate that the goal of this study was to develop a
Fig. 11: Pressure graph of fusiform thoracic II aorta aneurysm with 50% diameter increase
Fig. 12: Pressure graph of fusiform thoracic II aorta aneurysm with 90% diameter increase
REFERENCES
1. Rideout, V.C., 1991. Mathematical and computer modeling of physiological systems. New York: Prentice Hall.
2. Navidbakhsh, M., 1996. Numerical simulation of blood flow in human artery system. Phd thesis, I.N.P.L Luran Polytechnic, France.
3. Migliaavacca, F. and G.E. Cellier, 2001. Modeling of the Norwood circulation: effects of shunt size, vascular resistance and heart. J. Phisiol. Heart Circ. Phisiol., 280: 457-70.
4. Heldet, T. and E. Shim, 2002. Modeling of cardiovascular response to orthostatic stress. J. Appl. Physiol., 92: 1239-54.
5. Rupnic, M. and F. Runvovc, 2002. Simulation of steady state and transient phenomena by using the equivalent electronic circuit. J. Computer Methods and Programs in Biomedici., 67: 1-12.
6. Hassani, K., M. Navidbakhsh and M. Rostami, 2006. Simulation of cardiovascular system using equivalent electronic circuit. J. Biomedical Papers, 150: 105-112.
7. Long, A, L. Rouet and A. Bissery, 2004. Compliance of abdominal aortic aneurysms; evaluation of tissue Doppler imaging . J. Ultrasound in Medical and Biology, 30: 1099-1108.
8. Morris-Stiff, G., M. Haynes, S. Ogunbiyi, E. Townsend, S. Shetty, R.K. Winter and M.H. Lewis, 2005. Is Assessment of Popliteal Artery Diameter in Patients Undergoing Screening for Abdominal Aortic Aneurysms a Worthwhile Procedure. Eur. J. Vascular and Endovascular Surgery, 30: 71-74.
9. Tilson, M.D. and D.B. Charles, 1996. The abdominal aortic aneurysms. Annals The New York Academy of Science, Vol. 800.
10. Schurink, H., J.M. Baalen and N.J.M. Aars, 2000. Experimental study of the influence of endoleak size on pressure in the aneurysm sac and the consequences. Br. J. Surgery, 80: 71-78.
11. Carmine, M., P. Cappiello, B. Cimmino and M.D. Natale, 2004. New access to facilitate endovascular repair of descending aorta aneurysms. The Annals of Thoracic Surgery, 77: 1445-1447.
12. Guyton, A.C., 1996. Text Book of Physiology. Vol. I. Philadelphia: W.B. Saunders.
13. Wang, J.J. and K.H. Parker, 2004. Wave propagation in a model of the arterial circulation. J. Biomechanics, 37: 457-70.