www.biogeosciences.net/10/1351/2013/ doi:10.5194/bg-10-1351-2013
© Author(s) 2013. CC Attribution 3.0 License.
Biogeosciences
Geoscientiic
Geoscientiic
Geoscientiic
Geoscientiic
Overlooked runaway feedback in the marine nitrogen cycle:
the vicious cycle
A. Landolfi, H. Dietze, W. Koeve, and A. Oschlies
GEOMAR Helmholtz-Zentrum für Ozeanforschung Kiel, Marine Biogeochemical Modelling, Düsternbrooker Weg 20, 24105 Kiel, Germany
Correspondence to:A. Landolfi ([email protected])
Received: 28 June 2012 – Published in Biogeosciences Discuss.: 23 July 2012 Revised: 10 January 2013 – Accepted: 11 January 2013 – Published: 1 March 2013
Abstract.The marine nitrogen (N) inventory is thought to be stabilized by negative feedback mechanisms that reduce N inventory excursions relative to the more slowly overturning phosphorus inventory. Using a global biogeochemical ocean circulation model we show that negative feedbacks stabiliz-ing the N inventory cannot persist if a close spatial associ-ation of N2 fixation and denitrification occurs. In our
ide-alized model experiments, nitrogen deficient waters, gener-ated by denitrification, stimulate local N2 fixation activity.
But, because of stoichiometric constraints, the denitrification of newly fixed nitrogen leads to a net loss of N. This can enhance the N deficit, thereby triggering additional fixation in a vicious cycle, ultimately leading to a runaway N loss. To break this vicious cycle, and allow for stabilizing nega-tive feedbacks to occur, inputs of new N need to be spatially decoupled from denitrification. Our idealized model exper-iments suggest that factors such as iron limitation or dis-solved organic matter cycling can promote such decoupling and allow for negative feedbacks that stabilize the N inven-tory. Conversely, close spatial co-location of N2fixation and
denitrification could lead to net N loss.
1 Introduction
Variations in the oceanic fixed-nitrogen (N) inventory are known to have driven marine productivity changes con-tributing to atmospheric CO2 variations in Earth’s history
(Falkowski, 1997; Altabet et al., 2002). For the last several thousand years, however, the apparent stability of the N in-ventory over several oceanic N residence timescales (Gru-ber, 2004; Altabet, 2007) suggests an approximate balance
of the main N source, the diazotrophic fixation of N2 gas,
and the main N loss process associated with organic matter remineralization under low oxygen concentrations, referred to as denitrification (Devol et al., 2008). The N inventory is thought to be stabilized by feedback mechanisms (Codis-poti, 1989) that limit and reduce the strong excursions of the marine N content with respect to the more slowly overturn-ing P inventory (Delaney, 1998). The current paradigm as-sumes that slowly-growing N2 fixers (Capone et al., 1997)
have a competitive advantage over non-fixing phytoplankton in waters where N is in deficit relative to phosphate (Red-field et al., 1963; Tyrrel, 1999). As a “side effect” of adding N without any equivalent P, diazotrophs tend to reduce their own niche (Fig. 1a) (Tyrrel, 1999). Similarly, denitrifica-tion limits itself by reducing the amount of fixed nitrogen eventually upwelling into the light-lit layer, and thereby re-ducing the growth of “ordinary” phytoplankton, subsequent export of organic matter, oxygen consumption and, even-tually, denitrification at depth (Fig. 1b) (Codispoti, 1989). Individually, both nitrogen fixation and denitrification ini-tiate negative feedbacks that limit N inventory excursions and act as self-limiting processes (Codispoti, 1989; Gruber, 2004) (Fig. 1a, b). Mutual interactions of these antagonis-tic processes further work against the development of sub-stantial N deficits or surpluses relative to P (Codispoti, 1989; Tyrrel, 1999; Gruber, 2004). According to this picture, any N deficit resulting from denitrification also gives rise to an excess of phosphate relative to nitrate which tends to stimu-late the growth of N2fixers (Fig. 1a) (Redfield et al., 1963;
Tyrrel, 1999). N addition via N2fixation enhances the export
1352 A. Landolfi et al.: The vicious N cycle
(Fig. 1b) (Codispoti, 1989). Traditionally, the two processes were considered to be spatially disconnected in the current ocean because of factors such as iron limitation (Moore et al., 2009), possible temperature limits (Breitbarth et al., 2007) and macro-nutrient effects (Mills and Arrigo, 2010) that re-duce the ability of diazotrophs to respond locally to N deficits (Redfield et al., 1963; Codispoti, 1989; Falkowski, 1997; Tyrrel, 1999; Lenton and Watson, 2000; Moore and Doney, 2007; Mills and Arrigo, 2010). The wider the spatial separa-tion, the longer the response time and the larger the potential for changes in the marine N inventory. This view of a re-mote connection between these two counteracting processes has been difficult to reconcile with the apparent stability of the marine N inventory (Gruber, 2004; Altabet, 2007). More recently, contrasting observational inferences of a close spa-tial proximity of N2 fixers and denitrification in the eastern
South Pacific (Deutsch et al., 2007; Fernandez et al., 2011) have been interpreted as a welcome indication (Deutsch et al., 2007; Fernandez et al., 2011; Knapp, 2012) of a fast and stabilizing feedback mechanism promoting a balanced N in-ventory (Gruber, 2004). In spite of the on-going debate on the geographic location and global rates of N2fixation in the
current ocean, the full implications of the recently suggested close spatial association of N2fixation and denitrification on
the marine N inventory have not been assessed.
Here we investigate the implications of spatial coupling of denitrification and N2 fixation in a state-of-the-art coupled
biogeochemical (Schmittner et al., 2008) circulation model (Gnanadesikan et al., 2006). A number of sensitivity experi-ments examine how different parameterizations of the marine N cycle, specifically designed to differ in the mutual interac-tion of nitrogen fixainterac-tion and denitrificainterac-tion, allow the model to maintain the marine N inventory. We assess the implica-tions of our finding on the current understanding of the ma-rine N inventory controls.
2 Methods
The coupled ocean-ice model used here corresponds to the CM2.1 (Gnanadesikan et al., 2006) configuration with a 3◦×
2◦ lateral grid resolution and 28 vertical levels. The model is forced by monthly heat and freshwater fluxes and wind fields taken from the climatological dataset of the Coordi-nated Ocean Reference Experiments (CORE), which is based on the work of Large and Yeager (2004). The circulation model is initialized with annual mean temperature and salin-ity from the World Ocean Atlas 2001 (Conkright et al., 2002). After a 20 yr integration, the circulation model is coupled online to a modified version of the NPZD-type ecosystem model of Schmittner et al. (2008) initialized with observed nutrient and oxygen distributions (Conkright et al., 2002). The ecosystem model has 10 prognostic variables: dissolved oxygen, nitrate, phosphate, (non-nitrogen-fixing) “ordinary” phytoplankton, nitrogen-fixing phytoplankton (diazotrophs),
N2 fixation Ndef advection iron
+
Ndef-The broken vicious cycle
no iron
O
2 Ndef -denitrification denitrification N2 fixation+
Ndef denitrification Euph. N2 fixation+
Ndef DOM denitrification Euph.-The vicious cycle The paradigm N2 fixation Nxs
-a)+
Nxsb) c)
d) e)
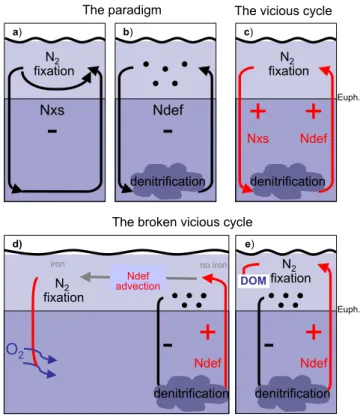
Fig. 1.Feedbacks in the marine nitrogen cycle. Negative feedbacks
(black) reduce the initial perturbation. Positive feedbacks (red) am-plify the initial perturbation. Negative feedbacks ensue when two process occur individually:(a)N2fixation is self-limited via pro-duction of excess nitrogen (Nxs), and(b) denitrification, is self-limited by the generation of nitrogen deficits (Ndef) that reduce non-fixing phytoplankton export production. If denitrification and N2 fixation are spatially coupled, then the stoichiometric
imbal-ance between the amount of NO−3 used up in the denitrification process versus the amount of N gained from the remineralization of N2fixation-derived organic matter results is a net loss of fixed N that further stimulates N2fixation, leading to a vicious cycle
con-sisting of positive feedbacks between the two processes(c). This is because 120 moles of nitrate per mole of phosphorus are used to remineralize Redfield organic matter via denitrification, whereas only 16 moles of nitrogen (per mole phosphorus) are gained dur-ing N2fixation. Thus, denitrification of newly fixed organic matter
naturally leads to more NO−3 loss than N gained for any realistic organic matter stoichiometry (seeRNlossequation in main text). To break the vicious cycle and allow for the self-limiting individual processes of panels(a)and(b)to dominate, a spatial decoupling of areas of N2fixation and denitrification is required. This decoupling
zooplankton and particulate phosphorus and nitrogen detri-tus, and, in sensitivity experiment DOM, semi-labile dis-solved organic phosphorus and nitrogen. Diazotrophs are modelled explicitly. Their growth obeys rules similar to those of non-fixing phytoplankton with a temperature dependence of maximum growth rates and light and nutrient limitations. Specifically, they have a maximum growth rate lower than that of “ordinary” phytoplankton. They can take up nitrate but are only limited by phosphate. Wherever simulated oxy-gen concentrations fall below 5 mmol m−3, nitrate is used as electron acceptor to remineralize organic matter through the process of denitrification (Devol et al., 2008). In this study, sedimentary denitrification is not considered as we do not adequately resolve shelf and coastal seas. A detailed model description is given in the Appendix.
The simulations performed are: (1) BASELINE is our sim-plest model configuration. Non-fixing phytoplankton and di-azotrophs are limited only by light and by macronutrients, as in the original model of Schmitter et al., 2008. (2) NOFIX is identical to the BASELINE simulation except that N2
fixa-tion is switched off. (3) IRON is identical to the BASELINE simulation except that it includes a formulation mimick-ing iron stress on diazotrophs and non-fixmimick-ing phytoplankton. Specifically, phytoplankton and diazotroph growth rates are multiplied by factors of 0.5 and 0.2, respectively, when mod-elled surface PO−43 concentrations are lower than observed monthly-mean PO−43values taken from the World Ocean At-las (WOA) (Conkright et al., 2002) (Fig. A1). Without an ex-plicit representation of iron, this is to dynamically mimic the effects of iron limitation in regions such as the high nutrient low chlorophyll (HNLC) regions, where WOA surface inor-ganic nutrients are not completely drawn down. (4) DOM is a simulation that, in addition to the iron limitation formula-tion, includes DON and DOP compartments and allows dia-zotrophs to use DOP as a P source when phosphate concen-trations are lower than 5 µmol P m−3. To investigate the im-pacts and relative magnitude of feedback processes linking nitrogen fixation and denitrification, which act on timescales much shorter than the several thousand years needed for a global biogeochemistry-circulation model to reach equilib-rium, we start from observed present-state biogeochemical tracer distributions and limit our model integration time to 150 years. As the circulation field and initial conditions are identical in all our simulations, we interpret the relative ferences among model simulations emerging from the dif-ferences in the biogeochemical model formulations. Our ap-proach of considering the first 150 yr of transient solutions started from observed tracer distributions should ensure that locations and intensities of the tentative feedback processes are closely representative to those one would expect to ob-serve in the real ocean if the biogeochemical controls pre-scribed in the respective model configuration were correct. While we cannot rule out that even the most realistic bio-geochemical model will display a long-term drift away from
initial conditions, mainly because of errors in the underly-ing circulation field, all differences between the model sim-ulations investigated here can be attributed entirely to dif-ferences in the biogeochemistry components of the coupled biogeochemical–physical models.
3 Results and discussion
All simulations display high biological production in the up-welling regions of the equatorial Eastern Pacific, the Indian Ocean and the Benguela upwelling system. These regions are associated with high export, subsequent remineralization and oxygen consumption at depth, contributing to maintain the oxygen minimum zones (OMZs) in the Pacific and Indian Ocean.
In our BASELINE model configuration, which does not account for iron limitation, competition with faster grow-ing non-fixgrow-ing phytoplankton make N deficiency the essen-tial control on the growth of diazotrophs. Waters deficient in nitrate relative to Redfield phosphorus equivalents provide an ecological niche for the simulated diazotrophs. Denitri-fication and N2 fixation are free to interact. Thereby,
sim-ulated N2 fixation can quickly respond to the N deficit of
denitrified waters upwelled from low-oxygen regions. Areas of simulated N2fixation are located mainly along the eastern
boundaries of the tropical ocean (Fig. 2a), in close agree-ment with recent inferences based on observed biogeochem-ical tracer distributions (Deutsch et al., 2007). Diazotrophs coexist with non-fixing phytoplankton in the upwelling re-gions even though surface nitrate is not completely drawn down (Fig. 3a), contributing up to 40 % to total carbon assim-ilation (Fig. 3c). In these regions diazotrophs take up nitrate (Fig. 4a) that represents on average 5 % of their N source. Despite the fast response of N2fixation to the N deficit
gen-erated by denitrification, the total N inventory rapidly de-creases in the BASELINE run by about 6.4 % within 150 yr (Fig. 5a). In fact, simulated denitrification rates exceed N2
fixation rates by more than a factor 4 within a few years after having initialized the model with observed tracer distribu-tions (Fig. 5c). A systematic loss of fixed nitrogen has also been found in earlier modeling studies (Moore and Doney, 2007; Schmittner et al., 2008) and will here be explained by a positive and previously overlooked feedback: the extra pro-duction and export of organic matter associated with newly fixed nitrogen enhances denitrification (Fig. 5b) which, in turn, enhances the nitrate deficit and favours further N2
fix-ation above the OMZ (Fig. 1c). Because of the stoichiomet-ric imbalance between the amount of NO−3 used up in the denitrification process versus the amount of N derived from the remineralization of organic matter originated from N2
-fixation, a net N loss occurs whenever newly fixed organic N is denitrified. Subsequent upwelling of the N deficit fur-ther stimulates N2fixation. The persistence of these positive
1354 A. Landolfi et al.: The vicious N cycle
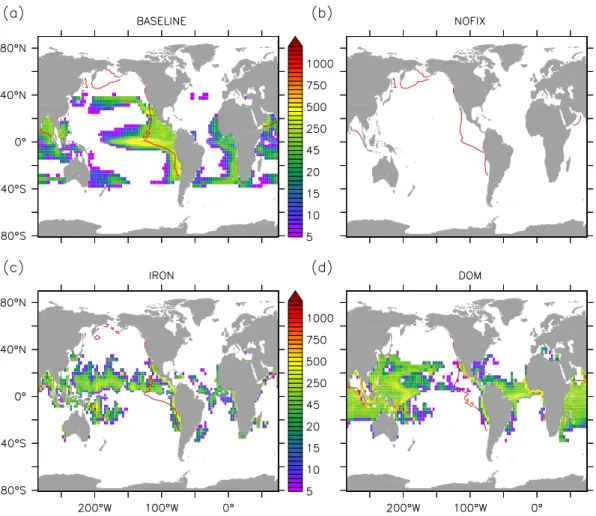
Fig. 2.N2fixation rates (mmol N m−2yr−1) calculated for the(a)BASELINE,(b)NOFIX,(c)IRON and(d)DOM simulation. Red contour
denotes the average position of the 5 mmol m−3O2isoline at the local vertical minimum of dissolved oxygen. Figure shows averages over
150 model years.
nitrogen. At the core of the vicious cycle is the stoichiometric relation of organic matter undergoing complete denitrifica-tion (implicitly including the anammox reacdenitrifica-tion) (Paulmier et al., 2009):
CaHbOcNdP+
1
5(4a+b−2c+5)HNO3→aCO2 (1)
+1
10(4a+b−2c+5d+5)N2+H3PO4
+1
5(2a+3b−1c−5)H2O
,
where a, b, c, d are the assumed stoichiometric ratios of organic matter Ca:Hb:Oc:Nd:P. It follows that for
each mole of organic nitrogen denitrified,RNloss=
1 5d(4a+ b−2c+5d+5) moles of nitrate are lost (Paulmier et al., 2009). For typical organic matter with a stoichiome-try of C106:H175:O42:N16:P (Anderson, 1995) RNloss= 7.5 moles of nitrate are lost for every mole of organic nitro-gen denitrified. This implies that in regions where suboxic remineralization is larger than about 1/7th of the vertically integrated remineralization, any addition of new N at the
sea surface will, upon remineralization of the organic mat-ter, lead to a net loss of fixed N, and a vicious cycle can en-sue. Different stoichiometries of OM falling into the OMZ may modulate the magnitude of the N loss; denitrification of organic matter with elevated carbon content, relative to C106:H175:O42:N16:P, results in increased N losses.
Den-itrification of organic matter with lower C:N, e.g. algal pro-teins (C53:H7:O23:N16) (Laws, 1991), would, on the other
hand reduce theRNlossto values as low as 2.2. Plausible stoi-chiometries of marine organic matter (Laws, 1991), all yield
RNloss>1, and denitrification of organic matter derived from N2-fixation will always lead to a net loss of fixed nitrogen.
This implies that N2fixation cannot compensate for N losses
if the diazotroph-derived organic matter is remineralized via denitrification. Once upwelled to the surface, denitrified wa-ters further stimulate nitrogen fixation closing the vicious cy-cle (Fig. 1c). In our BASELINE run, where on average ap-proximately 60 % of the simulated N2fixation occurs above
N inventory (Fig. 5a). This result is qualitatively consistent with an idealized box model (Canfield, 2006) of a costal up-welling setting where oxygen minimum waters are depleted in nitrate in the presence of overlying N2fixation.
A second simulation NOFIX, which differs from the BASELINE run only in that N2 fixation is turned off,
pro-vides an estimate of the potential strength of the vicious cy-cle. As expected, without nitrogen fixation but with denitrifi-cation turned on, the model cannot maintain its nitrogen in-ventory and loses about 4.6 % of the fixed N within 150 yr (Fig. 5a). This loss is, however, smaller than the net nitrogen loss simulated by the BASELINE experiment (6.4 %, Fig. 5a) where the N2fixation sustains the vicious cycle. After 150 yr,
the total N loss of the BASELINE simulation is about 40 % larger than in experiment NOFIX.
We now test, with additional simulations, how a spatial separation of N2fixation and denitrification affects the
mod-elled N inventory. In experiment IRON, growth rates of both diazotrophs and ordinary phytoplankton are reduced in re-gions where simulated surface PO−43concentrations fall be-low observed monthly mean PO−43 values taken from the World Ocean Atlas (Conkright et al., 2002), mimicking the effect of iron limitation in our model that does not explicitly resolve the micronutrient iron. When simulating iron limita-tion, the upwelled excess phosphate is not immediately avail-able to diazotrophs above the OMZ. The growth of N2fixers
in experiment IRON is thus shifted westwards relative to the BASELINE run, thereby contributing to a spatial separation of N2fixation and denitrification (Fig. 2c). In the 150-yr
av-erage, 35 % of the simulated N2fixation occurs above OMZs
in experiment IRON, as compared to 60 % in the BASELINE run. The reduced export and subsequent remineralization of organic material in the OMZ region leads to a reduction of the modelled oxygen demand and the associated low-oxygen zone (Fig. 6c). The partial shift of areas of N2fixation away
from those of denitrification in experiment IRON reduces the fraction of export production that is remineralized in OMZs relative to the BASELINE simulation (Fig. 7a, b) resulting in a smaller (5 %) decline of the fixed N inventory within 150 yr (Fig. 5a, c, d). We investigated the sensitivity of our results to the prescribed iron limitation. A reduction of the iron constraint of the diazotrophs growth rate from 80 % (as used in the IRON experiment) to 50 % results in a N inven-tory decrease of 6.4 % instead of 5 % over 150 years. Thus, the magnitude of the N loss is sensitive to the degree of de-coupling of N2fixation from denitrification induced by our
simple parameterization of iron limitation.
A model configuration able to maintain the observed ma-rine nitrogen inventory (Fig. 5a, d) is obtained by including, in addition to iron limitation, a dissolved organic nitrogen (DON) and phosphorus (DOP) pool in experiment DOM. In this simulation, a portion of organic matter is channelled into DON and DOP (Fig. 8), which can be advected away from their source regions and thereby allow for a lateral
separa-tion of nutrient fluxes into the surface layer from export of organic matter back into the ocean interior (Fig. 1d). Further in this simulation, DOP is an additional phosphorus source to diazotrophs (Fig. 4d) at very low phosphate concentra-tions. The DOM configuration permits the transport of the upwelled excess phosphorous signal into areas laterally dis-connected from the OMZ allowing for a wider spatial sepa-ration of N2fixation and denitrification (Fig. 2d). During the
150-yr simulation, only 20 % of the simulated N2 fixation
takes place above suboxic waters, as opposed to 35 % and 60 % in the IRON and BASELINE simulations, respectively. This spatial separation of diazotrophic activity from denitrifi-cation combined with the vertical separation of dissolved or-ganic matter aerobic remineralization from the deeper depth horizon of the OMZ leads to a drastic reduction of the region where the vicious cycle takes place (Fig. 7c), which, in turn, decreases denitrification rates relative to those of N2fixation
(Fig. 5c, d). On the 150-yr timescale considered in our sim-ulations, the marine N budget of the DOM model configura-tion is essentially balanced (Fig. 5a).
The stoichiometry of nitrate consumption during denitri-fication of organic matter leads to a net loss of fixed gen whenever remineralization of newly fixed organic nitro-gen occurs via denitrification in suboxic waters. For Redfield stoichiometry, the vicious cycle can start in any water col-umn where more than 1/7th of the newly fixed organic ni-trogen is remineralized via denitrification. According to the oxygen distribution from the World Ocean Atlas (Bianchi et al., 2012), applying the Martin particle flux curve (Martin et al., 1987) and assuming that organic matter is in Redfield proportion, this may occur in restricted regions of the oceans (Fig. 7d). As the complete loss of inorganic nitrogen is rarely observed in the open ocean (Fig. 7d), the vicious cycle must be efficiently suppressed in reality. Our model analysis sug-gests that there are factors, such as the combination of iron limitation and DOM dynamics, which contribute to a spa-tial decoupling of N sources and sinks that can prevent the vicious cycle from operating on large scales. Additional fac-tors, not fully captured by our model, can further contribute to the spatial separation of N sources and sinks and can lead to oxic remineralization of newly fixed organic N. This may further reduce the potential for the occurrence of a vicious cycle. For example, more realistic simulated oxygen fields, resulting from the ongoing efforts to improve oceanic cir-culation in state-of-the-art ocean circir-culation models (Dietze and Löptien, 2012), are expected to reduce the expansion of OMZ relative to observations (Fig. 6a). Reduction of mod-elled OMZ would favour oxic remineralization relative to denitrification resulting in a more realistic, reduced potential for the vicious cycle. Nevertheless, with the elevated sensi-tivity of OMZ variability to small changes in oceanic O2
1356 A. Landolfi et al.: The vicious N cycle
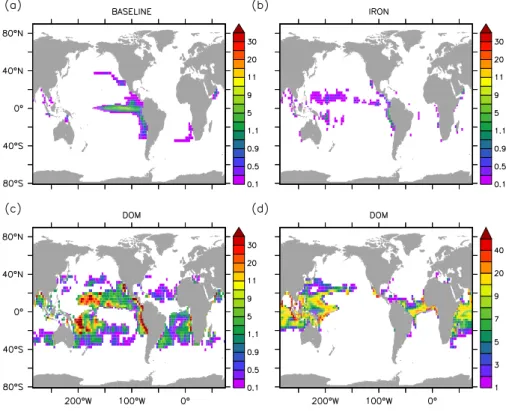
Fig. 3.Average NO−3 concentrations (mmol m−3) in the upper 50 m for (a)BASELINE and(b)IRON simulations. Contribution of
di-azotrophs to total autotrophic production (%) in(c) BASELINE and (d) IRON simulations. Black contour represents the sea-surface 0.02 mmol NO−3m−3isoline. Figure shows averages over 150 model years.
Fig. 4. NO−3 uptake of diazotrophs (mmol N m−2yr−1) in the (a) BASELINE (b) IRON and (c) DOM simulations. DOP uptake
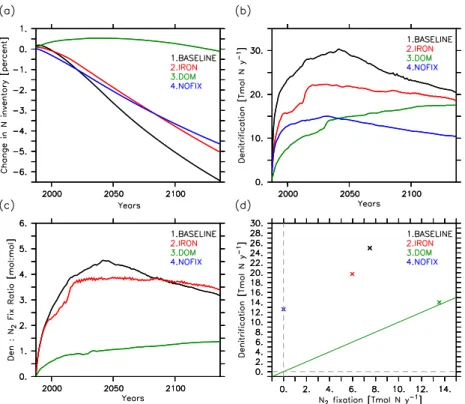
Fig. 5.Temporal evolution of(a)simulated oceanic N inventory (changes in %),(b)global denitrification rates (Tmol N yr−1),(c)ratio of global denitrification to global N2fixation (mol : mol). Panel(d)shows scatter plots of the 150-yr mean global denitrification versus 150-yr
mean global N2fixation for the BASELINE, NOFIX, IRON and DOM simulations. The green line has slope 1 and indicates a balanced
oceanic nitrogen inventory.
Fig. 6.Average thickness (m) of the low-O2water layer ([O2] <5 mmol m−3) computed from the corrected WOA annual means, Bianchi
1358 A. Landolfi et al.: The vicious N cycle
Fig. 7.Percentage of organic matter export remineralized in low oxygen waters ([O2] <5 mmol m−3) for the(a)BASELINE,(b)IRON and
(c)DOM simulations. Panels(a), (b)and(c)show averages over 150 model years. Panel(d)shows an estimate of this fraction derived for the real ocean combining the observed oxygen distribution (corrected WOA annual means, (Bianchi et al., 2012)) and a vertical profile of oxygen utilization based on the Martin curve (Martin et al., 1987) of particle flux attenuation. The onset of a vicious cycle can occur in regions where>15 % of the export is remineralized in suboxic waters (corresponding to coloured regions). Regions where less than 15 % of the export is remineralized in OMZ correspond to the hatched grey areas
.
Fig. 8.Average upper ocean (0–100 m) concentrations of(a)DON and(b)DOP in the DOM simulation. Figure shows averages over 150
model years.
4 Conclusions
The tight interaction between denitrification and N2fixation
emerging from the spatial proximity of denitrification and N2fixation sites gives rise to a vicious cycle where positive
feedbacks persist; decreased N availability occurs proximate to denitrifying areas where excess phosphate stimulates N2
fixation activity (positive feedback). This in turn enhances
organic matter export and oxygen consumption at depth, fu-elling denitrification further (positive feedback). Because of stoichiometric constraints, any enhancement of N2 fixation
results in a net loss of marine nitrogen if a substantial por-tion of the N2 fixation-derived organic N is remineralized
as DOM dynamics and oxygen distributions and transport, allow the disconnection of the flux of N2 fixation-derived
organic nitrogen into the low-oxygen areas of denitrifica-tion. Accounting for these controls is critical for breaking the vicious cycle that otherwise can be found to lead to a complete regional loss of fixed nitrogen in biogeochemical ocean models (Moore and Doney, 2007; Schmittner et al., 2008). Challenging the common understanding on the sta-bilizing feedbacks of the marine N cycle (Codispoti, 1989; Falkowski, 1997; Gruber, 2004; Deutsch et al., 2007; Knapp, 2012), we demonstrate that spatial distance rather than spa-tial proximity promotes negative feedbacks that stabilize the marine nitrogen inventory. If the vicious cycle is taken into account, the two apparently opposite views of balance of the modern N inventory (Codispoti et al., 2001; Deutsch et al., 2007) converge. Our results have important implications for understanding the controls on the marine global N in-ventory and predicting its response to climate change. We suggest that large changes in the marine N inventory can be triggered by changes in the spatial arrangement of N2
fixation and N loss regions and do not need to be initiated by a change in rates of either process. Sources of new ni-trogen, via N2 fixation (Deutsch et al., 2007; Fernandez et
al., 2011) and atmospheric deposition (Duce et al., 2008), can lead to a net N loss (Codispoti et al., 2001) rather than a net gain once located within or above oxygen minimum zones. The likely future expansion of ocean areas with sur-face temperature ranges suitable for N2fixation (Breitbarth et
al., 2007; Moisander et al., 2008), the ongoing expansion of OMZs (Stramma et al., 2008) and the climate-driven changes in dust deposition patterns (Mahowald et al., 2006), all sug-gest a more intimate spatial coupling of N2fixation activity
to denitrification over the next decades, which may lead to a net loss of marine nitrogen (Codispoti et al., 2001) with consequent impacts on ocean productivity and marine CO2
uptake (Falkowski, 1997). We suggest that any quantitative assessment of past and expected future changes in the ma-rine N inventory (Codispoti et al., 2001) cannot rely solely on individual estimates of N loss and N gain processes, but has to account for their spatial relationship.
Appendix A
A1 Ecosystem model equations
Each prognostic variableCis determined following:
∂C
∂t =T+sms, (A1)
where T represents all diffusive and advective transport terms, sms denotes the source minus sink terms, which de-scribe the biogeochemical interactions as follows:
Fig. A1.Diagnosed iron mask (averaged over 150 model years).
Shading denotes areas where phytoplankton growth rates in the IRON and DOM simulations are reduced locally such that, simu-lated surface PO−43concentrations do not exceed observed PO−43 monthly mean concentrations from the World Ocean Atlas (WOA) (Conkright et al., 2002).
Nitrate (NO−3) equation:
sms(NO−3)=−JP−uNJDiaPDia (A2)
+(µDN(1−σDN)DN+γ2(1−σZe)Z+µDONDON)
(1−0.8ROR−1rsoxNO3);
Phosphate (PO−43) equation:
sms(PO−43)=(+γ2(1−σZe)Z−JP)R
−1
(A3)
−JDiaPDiaRDia−1
+µDP(1−σDP)DP+µDOPDOP; Phytoplankton (P) equation:
sms(P)=JP−G(P)Z−µPP; (A4)
Diazotroph (PDia) equation:
sms(PDia)=JDiaPDia+JDiaDOPPDia−G(PDia)Z (A5)
−µPDiaPDia;
Zooplankton (Z) equation:
sms(Z)=γ1Z(G(P)+G(PDia))−γ2Z−µZZ2; (A6)
Nitrogen detritus (DN) equation:
sms(DN)=(1−γ1)(1−σZs)(G(P)+G(PDia)) (A7) Z+µP(1−σPm)P+µPDia(1−σDiam)PDia
+µZ(1−σZm)Z
2−µ
DNDN−ws
∂DN
1360 A. Landolfi et al.: The vicious N cycle
Phosphorus detritus (DP) equation:
sms(DP)=(1−γ1)(1−σZs)(G(P)+G(PDia))Z (A8)
+µP(1−σPm)P
+µZ(1−σZm)Z
2+µ
PDia(1−σDiam)PDiaRDia
−1
−µDPDP−ws
∂DP
∂z ;
Oxygen (O2) equation:
sms(O2)=Fsfc(JP+JDiaPDia(µDN(1−σDN)DN (A9)
+µDONDON+γ2(1−σZe)Z)rsox
O2)R−1R
O;
Dissolved organic nitrogen equation (DON):
sms(DON)=σZs(1−γ1)(G(P)+G(PDia))Z (A10)
+σPmµPP+σZmµZZ
2
+σZeγ2Z
+σDiamµPDiaPDia+σDNµDNDN−µDONDON; Dissolved organic phosphorus equation (DOP):
sms(DOP)=(σZs(1−γ1)(G(P)+G(PDia))Z (A11)
+σPmµPP+σZmµZZ
2+σ
Zeγ2Z)R
−1
+σDiamµPDiaPDiaRDia
−1+σ
DPµDPDP−µDOPDOP
−JDiaDOPPDiaRDia
−1.
Sources of dissolved organic nitrogen and phosphorus are (1) fraction of zooplankton sloppy-feeding, (2) fraction of zoo-plankton excretion, (3) fraction of detritus dissolution, and (4) fraction of phytoplankton, diazotrophos and zooplankton mortality. The latter term mimics the mortality by viral in-fection and phytoplankton cell leakage, but it is not meant to represent phytoplankton passive exudation which is expected to be dominated by carbohydrates. In the present configura-tion the fracconfigura-tion of phytoplankton and diazotroph mortality to the DOM compartment is the same. Sinks of DON and DOP are through remineralization, which can be different from one another. Uptake of DOP by diazotrophs can occur when phosphate is lower than 0.005 mmol m−3.
A2 Phytoplankton and diazotroph growth
The functionJ=J (I,NO−3,PO−43)provides the growth rate of non-diazotrophic phytoplankton determined from irradi-ance(I ),NO−3,PO−43,
J (I,NO−3,PO−43)=min(JI, JmaxuNO−3, JmaxuPO−3 4
). (A12) The maximum growth rateJmaxis a function of temperature
(T ):
Jmax(T )=ai·a·exp
T
Tb
(A13)
such that growth rates increase by a factor of ten over the temperature range of−2 to 34◦C. We use a=0.6 d−1 for
the maximum growth rate at 0◦C. The maximum growth
rate may be reduced by aai factor when iron limiting
con-ditions apply. Under nutrient-replete concon-ditions, the light-limited growth rateJIis calculated according to
JI=
JmaxαI
J2
max+(αI )2
1/2, (A14)
where α is the initial slope of the photosynthesis vs. ir-radiance (P–I) curve. The calculation of the photosyn-thetically active shortwave radiation I and the method of averaging the light-limited growth over one day is de-scribed in Schmittner et al. (2008). Nutrient limitation is represented by the product of Jmax and the nutrient
up-take rates uNO−
3 =
NO−3
/(kNO−
3 +
NO−3
) and uPO−3 4
=
h
PO−43i/(kPO−3 4
+hPO−43i), withkPO−3 4
=RPO−3 4 :NO
−
3
×kNO−
3 providing the respective nutrient uptake rates. Diazotrophs grow according to the same principles as the other phyto-plankton, i.e. their light-limited growth rateJIDiafollows
JIDia=
Jmax DiaαI
Jmax Dia2 +(αI )21/2, (A15)
but are disadvantaged by a lower maximum growth rate,
Jmax Dia, which is zero below 15◦C :
Jmax Dia=aiDia·cDiamax
0, a
exp T Tb
−2.61
. (A16)
The coefficientcDiahandicaps diazotrophs by dampening the
increase of their maximal growth rate vs. that of other phyto-plankton with rising temperature. The maximum growth rate may be reduced by aaiDia factor when iron limiting
condi-tions apply. Diazotrophs can take up nitrate; however, their growth rate is not limited by NO−3 concentrations:
JDia(I,PO−43)=min(JIDia, Jmax DiauPO−3 4
). (A17)
In addition to phosphate, diazotrophs can take up DOP as a P source when PO−43 concentrations are lower than 0.005 mmol P m−3:
JDia(I,DOP)=min(JIDia, Jmax DiauDOP), (A18)
whereuDOP=[DOP]/(kDOP+[DOP])represents the DOP
uptake rate. The low maximum growth rate relative to other phytoplankton, which mimics the high energy demand for fixing N2, makes diazotrophs competitive in P replete
re-gions.
A3 Remineralization and denitrification
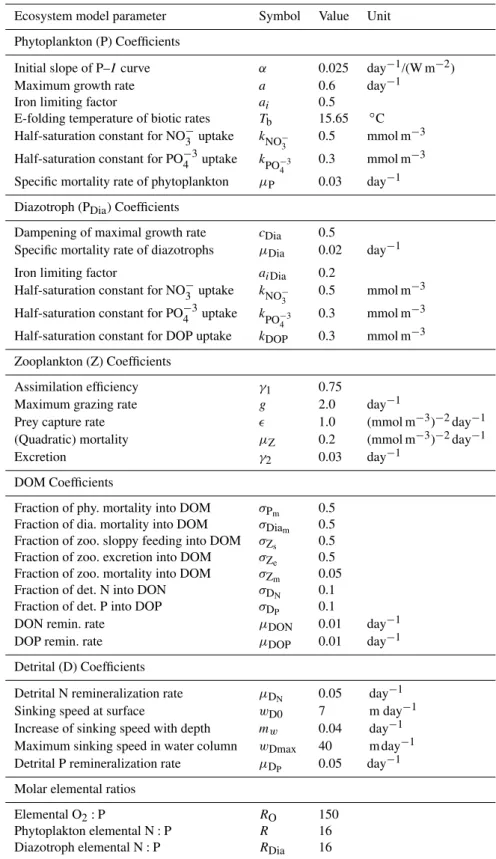
Table A1.Ocean ecosystem model parameters.
Ecosystem model parameter Symbol Value Unit
Phytoplankton (P) Coefficients
Initial slope of P–Icurve α 0.025 day−1/(W m−2) Maximum growth rate a 0.6 day−1
Iron limiting factor ai 0.5
E-folding temperature of biotic rates Tb 15.65 ◦C
Half-saturation constant for NO−3 uptake kNO−
3 0.5 mmol m
−3
Half-saturation constant for PO−43uptake k
PO−43 0.3 mmol m
−3
Specific mortality rate of phytoplankton µP 0.03 day−1
Diazotroph (PDia) Coefficients
Dampening of maximal growth rate cDia 0.5
Specific mortality rate of diazotrophs µDia 0.02 day−1
Iron limiting factor aiDia 0.2
Half-saturation constant for NO−3 uptake kNO−
3 0.5 mmol m
−3
Half-saturation constant for PO−43uptake kPO−3 4
0.3 mmol m−3
Half-saturation constant for DOP uptake kDOP 0.3 mmol m−3
Zooplankton (Z) Coefficients
Assimilation efficiency γ1 0.75
Maximum grazing rate g 2.0 day−1
Prey capture rate ǫ 1.0 (mmol m−3)−2day−1 (Quadratic) mortality µZ 0.2 (mmol m−3)−2day−1
Excretion γ2 0.03 day−1
DOM Coefficients
Fraction of phy. mortality into DOM σPm 0.5 Fraction of dia. mortality into DOM σDiam 0.5 Fraction of zoo. sloppy feeding into DOM σZs 0.5 Fraction of zoo. excretion into DOM σZe 0.5 Fraction of zoo. mortality into DOM σZm 0.05 Fraction of det. N into DON σDN 0.1 Fraction of det. P into DOP σDP 0.1
DON remin. rate µDON 0.01 day−1
DOP remin. rate µDOP 0.01 day−1
Detrital (D) Coefficients
Detrital N remineralization rate µDN 0.05 day
−1
Sinking speed at surface wD0 7 m day−1
Increase of sinking speed with depth mw 0.04 day−1
Maximum sinking speed in water column wDmax 40 m day−1
Detrital P remineralization rate µDP 0.05 day
−1
Molar elemental ratios
Elemental O2:P RO 150
1362 A. Landolfi et al.: The vicious N cycle
remineralization rate µDN. In oxic conditions the reminer-alization of particulate organic matter consumes oxygen as-suming fixed elemental ratios O2:N, N:P and O2:P
fol-lowing Anderson (1995) (Table A1), implicitly assuming in-stantaneous nitrification of NH+4 from organic matter rem-ineralization. Oxygen consumption in suboxic waters (<
5 µM)is inhibited, according to
rsoxO2 =0.5(tanh([O2] −5)+1), (A19)
and is replaced by the oxygen-equivalent oxidation of nitrate,
rsoxNO3 =0.5(1−tanh([O2] −5)). (A20)
The onset of canonical denitrification starts at<5 mmol m−3
O2levels and proceeds until NO−3 is zero. There is no
artifi-cial NO−3 threshold as applied elsewhere (Moore and Doney, 2007). As we have fixed stoichiometries (Anderson, 1995), we implicitly assume complete denitrification (implicitly in-cluding the anammox reaction). Denitrification consumes ni-trate at a rate of 80 % of the molar oxygen equivalent rate, as NO−3 is a more efficient oxidant on a mole per mole ba-sis. Oxic and anoxic remineralization stop when both O2
and NO−3 become zero. The model does not include sedi-mentary denitrification. Sinking detritus which accumulates at the ocean floor is remineralized following the same rules which hold everywhere else in the water column.
A4 Grazing
Zooplankton grazing of Diazotrophs, G(PDia), and
(non-nitrogen-fixing) phytoplanktonG(P)is parameterized using a sigmoidal function that allows for multi-species coexis-tence (Prowe et al. , 2012):
G(PDia)=
gǫP2Dia
g+ǫP2+ǫP2 Dia
(A21)
G (P)= gǫP
2
g+ǫP2Dia+ǫP2. (A22)
A5 Sinking of Detritus
The rate of sinking of Detrituswsis a linear function of depth
zbut cannot exceed a maximum value ofwDmax:
ws=ws(z)=min(wD0+mwz, wDmax). (A23)
Acknowledgements. We are greatful to Iris Kriest and GEOMAR’s Biogeochemical Modelling group for fruitful discussions. This work is a contribution of the DFG-supported project SFB754 (www.sfb754.de). Additional support is acknowledged to A. L. from the the Deutsche Forschungsgemeinschaft (LA2919/1-1) and to W. K. from the German Federal Ministry of Education and Research (FKZ 03FO608A, BIOACID).
Edited by: K. Fennel
References
Altabet, M. A.: Constraints on oceanic N balance/imbalance from sedimentary 15N records, Biogeosciences, 4, 75–86, doi:10.5194/bg-4-75-2007, 2007.
Altabet, M. A., Higginson, M. J., and Murray, D. W.: The effect of millennial-scale changes in Arabian Sea denitrification on atmo-spheric CO2, Nature, 415, 159–162, 2002.
Anderson, L.: On the hydrogen and oxygen content of marine phy-toplankton, Deep-Sea Res. Pt. I, 42, 1675–1680, 1995.
Bianchi, D., Dunne, J. P., Sarmiento, J. L. and Galbraith, E. D.: Data-based estimates of suboxia, denitrification, and N2O production in the ocean and their sensitivities to
dissolved O2, Global Biogeochem. Cy., 26, GB2009,
doi:10.1029/2011GB004209, 2012.
Breitbarth, E., Oschlies, A., and LaRoche, J.: Physiological con-straints on the global distribution of Trichodesmium –effect of temperature on diazotrophy, Biogeosciences, 4, 53–61, doi:10.5194/bg-4-53-2007, 2007.
Canfield, D. E.: Models of oxic respiration, denitrification and sul-fate reduction in zones of coastal upwelling, Geochim. Cos-mochim. Ac., 70, 5753–5765, 2006.
Capone, D. G., Zehr, J. P., Paerl, H. W., Bergman, B., and Car-penter, E. J.: Trichodesmium, a globally significant marine cyanobacterium, Science, 276, 1221–1229, 1997.
Codispoti, L. A.: Phosphorus vs. nitrogen limitation of new and ex-port production, in: Productivity of the Ocean: Present and Past, edited by: Berger, W. H., Smetacek, V. S. and Wefer, G., Wiley, New York, 377–394, 1989.
Codispoti, L. A., Brandes, J. A., Christensen, J. P., Devol, A. H., Naqvi, S. W. A., Paerl, H. W., and Yoshinari, T.: The oceanic fixed nitrogen and nitrous oxide budgets: Moving targets as we enter the Anthropocene?, Sci. Mar., 65, 85–105, 2001.
Conkright, M. E., Locarnini, R. A., Garcia, H. E., O’Brien, T. D., Boyer, T. P., Stephens C., and Antonov J. I.: World Ocean Atlas 2001: Objective Analyses, Data Statistics, and Figures, (CD-ROM Documentation), National Oceanographic Data Cen-tre, Silver Spring, 1–17, 2002.
Delaney, M. L.: Phosphorus accumulation in marine sediments and the oceanic phosphorus cycle, Global Biogeochem. Cy., 12, 563– 572, 1998.
Deutsch, C., Brix, H., Ito., T., Frenzel, H., and Thompson, L.: Climate-forced variability of ocean hypoxia, Science, 333, 336, doi:10.1126/science.1202422, 2011.
Deutsch, C., Sarmiento, J. L., Sigman, D. M., Gruber, N., and Dunne, J. P.: Spatial coupling of nitrogen inputs and losses in the ocean, Nature, 445, 163–167, 2007.
Devol, A. H.: Denitrification including anammox, in: Nitrogen in the Marine Environment 2 Edn, edited by: Capone, D., Bronk, D., Mulholland, M., and Carpenter, E., Elsevier, Ams-terdam, 263–301, 2008.
Dietze H. and Löptien U.: Revisiting “Nutrient Trapping” in global coupled biogeochemical Ocean Circulation Models, Global Bio-geochem. Cy., accepted, 2013.
Ul-loa, O., Voss, M., Ward, B., and Zamora, L.: Impacts of atmo-spheric anthropogenic nitrogen on the open ocean, Science, 320, 893–897, 2008.
Falkowski, P. G.: Evolution of the nitrogen cycle and its influence on the biological sequestration of CO2in the ocean, Nature, 387,
272–275, 1997.
Fernandez, C., Farías, L., and Ulloa, O.: Nitrogen fixation in deni-trified marine waters, PLoS One, 6, 20539, 2011.
Gnanadesikan, A., Dixon, K. W., Griffies, S. M., Balaji, V., Beesley, J. A., Cooke, W. F., Delworth, T. L., Gerdes, R., Harrison, M. J., Held, I. M., Hurlin, W. J., Lee, H.-C., Liang, Z., Nong, G., Pacanowski, R. C., Rosati, A., Russell, J., Samuels, B. L., Song, S. M., Spelman, M. J., Stouðer, R. J., Sweeney, C. O., Vecchi, G., Winton, M., Wittenberg, A. T., Zeng, F., and Zhang, R.: GFDL’s CM2 Global Coupled Climate Models, Part II: The Baseline Ocean Simulation, J. Climate, 19, 675–697, 2006.
Gruber, N.: The dynamics of the marine nitrogen cycle and its in-fluence on atmospheric CO2, in: Carbon Climate Interactions,
edited by: Oguz, T. and Follows, M., Kluwer, Dordrecht, 97–148, 2004.
Knapp, A. N.: The sensitivity of marine N2 fixation to
dis-solved inorganic nitrogen, Frontiers in Microbiology, 3, 1–14, doi:10.3389/fmicb.2012.00374, 2012.
Large, W. and Yeager, S.: Diurnal to decadal global forcing for ocean and sea-ice models: the data sets and flux climatologies, CGD Division of the National Center for Atmospheric Research, 105 pp., 2004.
Laws E. A.: Photosynthetic quotients, new production and net com-munity production in the open ocean, Deep-Sea Res. Pt. I, 38, 143–167, 1991.
Lenton, T. M. and Watson, A. J.: Redfield revisited 1, Regulation of nitrate, phosphate, and oxygen in the ocean, Global Biogeochem. Cy., 14, 225–248, 2000.
Mahowald, N. M., Muhs, D. R., Levis, S., Rasch, P. J, Yosh-ioka, Zender, C. S., and Luo C.: Change in atmospheric mineral aerosols in response to climate: Last glacial period, preindustrial, modern, and doubled carbon dioxide climates, J. Geophys. Res., 111, D10202, doi:10.1029/2005JD006653, 2006.
Martin, J. H., Knauer, G. A., Karl, D. M., and Broenkow, W. W.: VERTEX: carbon cycling in the Northeast Pacific, Deep-Sea Res., 34, 267–285, 1987.
Mills, M. M. and Arrigo, K.: Magnitude of oceanic nitrogen fixation influenced by the nutrient uptake ratio of phytoplankton, Nature, 3, 412–416, 2010.
Moisander, P. H., Beinart, R. A., Hewson, I., White, A. E., Johnson, K. S., Carlson, C. A., Montoya, J. P., and Zehr, J. P.: Unicellu-lar cyanobacterial distributions broaden the oceanic N2fixation
domain, Science, 327, 1512–1514, 2008.
Moore, J. K. and Doney, S. C.: Iron availability limits the ocean nitrogen inventory stabilizing feedbacks between marine deni-trification and nitrogen fixation, Global Biogeochem. Cy., 21, GB2011, doi:10.1029/2006GB002762, 2007.
Moore, C. M., Mills, M. M., Achterberg, E. P., Geider, R. J., LaRoche, J., Lucas, M. I., McDonagh, E. L., Pan, X., Poul-ton, M., Rijkenberg, J. A., Suggett, D. J., Ussher S. J., and Woodward, E. M. S.: Large-scale distribution of Atlantic nitro-gen fixation controlled by iron availability, Nature, 2, 867–871, doi:doi:10.1038/ngeo667, 2009.
Prowe, A. E. F., Pahlow, M., Oschlies, A.: Controls on the diversity-productivity relationship in a marine ecosystem model, Ecological Modelling, 225, 167–176, doi:10.1016/j.ecolmodel.2011.11.018, 2012.
Paulmier, A., Kriest, I., and Oschlies, A.: Stoichiometries of remineralisation and denitrification in global biogeochemical ocean models, Biogeosciences, 6, 923–935, doi:10.5194/bg-6-923-2009, 2009.
Redfield, A. C., Ketchum, B. .H., and Richards F. A.: The influ-ence of organisms on the composition of sea water, in: The Sea Vol. 2, edited by: Hill, M. N., Wiley-Interscience, New York, 26– 77, 1963.
Schmittner, A., Oschlies A., Matthews H. D., and Galbraith E. D.: Future changes in climate, ocean circulation, ecosystems and biogeochemical cycling simulated for a business-as-usual CO2
emission scenario until 4000 AD, Global Biogeochem. Cy., 22, GB1013, doi:10.1029/2007GB002953, 2008.
Stramma, L., Johnson, G. C., Sprintall, J., and Mohrholz, V.: Ex-panding oxygen-minimum zones in the tropical oceans, Science, 320, 655–658, 2008.