Human retinal circuitry and physiology
Christina Joselevitch
Yale University, United States
Abstract
Every second, in an average daytime light environment, hundreds of millions of photons enter the human eye and arrive at the photoreceptor layer of the retina. All our information about the visible world is contained in this rain of photons. The retina is a complex tissue, literally an extension of the brain, which transforms the rain of photons into bioelectric signals containing all the information available to the brain to interpret and respond to the external visual world. A considerable amount of processing takes place within the retinal tissue itself. Understanding what kind of processing takes place at each retinal stage is crucial for understanding normal vision, vision in the presence of diseases affecting the retina, and, ultimately, for the development of therapies to treat such diseases. This manuscript reviews the relation between structure and function of the different retinal pathways and addresses their possible roles for visual perception. Keywords: retina, physiology, parallel pathways, vision, perception.
Received 29 November 2008; received in revised form 19 December 2008; accepted 22 December 2008; Available online 27 January 2009.
Christina Joselevitch - Department of Cellular and Molecular Physiology - Yale University School of Medicine - 333 Cedar Street SHM B-103 - New Haven, CT 06520, USA . Correspondence concerning this article should be addressed to Christina Joselevitch, Department of Cellular and Molecular Physiology - Yale University School of Medicine - 333 Cedar Street SHM B-103 - New Haven, CT 06520, USA . Phone: (+1 203) 785-3344 - Fax: (+1 203) 785-4951 - E-mail: [email protected]
Introduction: Basic Anatomy
Neural, Glial and Epithelial Structures
The retina is responsible for sensing environmental light and transforming it into electrical impulses that can be read and further processed centrally. It is, in fact, an extension of the central nervous system, but with the advantage of being better understood than other central areas. The retinal tissue contains both neuronal and non-neuronal elements, which work together to enable vision and to maintain retinal homeostasis.
The retinal structure is highly conserved among vertebrate species. The human retina, as any other vertebrate retina, is neatly organized in layers (Figure 1), with nuclear strata that contain the neuronal cell bodies and interplexiform strata or neuropil, where the processes of these cells make contacts. As shown in Figure 1a, there are three nuclear layers (the outer nuclear layer or ONL, inner nuclear layer or INL, and ganglion cell layer or GCL) and two plexiform laminas (outer plexiform layer or OPL and inner plexiform layer or IPL).
The ONL contains the cell bodies of the light sensitive cells, or photoreceptors, whose outer segments
(the photosensitive portions of the cells) are wrapped in a protective layer of pigmented epithelial cells (“p” in Figure 1b). Although the retinal pigment epithelium (RPE) is technically speaking not a part of the neural retina, it is fundamental for proper retinal function. Among other things, the RPE is involved in retinal homeostasis, being responsible for photoreceptor renewal, for the breakdown of toxic by-production of photoreceptor activity and for photopigment regeneration (Lamb & Pugh Jr., 2004), as well as in protecting the retina from light damage by the absorption of excessive photons (Tsacopoulos, Poitry-Yamate, MacLeish, & Poitry, 1998).
The somas of three main classes of retinal second-order neurons are localized in the INL: horizontal cells (HCs), bipolar cells (BCs), and amacrine cells (ACs). HCs and BCs contact the photoreceptors in arrangements called triads in the OPL (Sjostrand, 1958); ACs, BCs and ganglion cells (GCs) make contacts called dyads at different levels (also called sublaminas) of the IPL (Figure 1b and Figure 2). There are different subtypes of HCs, BCs, ACs and GCs, which form retinal subsystems, or processing channels, that are more or less specialized for particular tasks. The basic layout of these processing channels will be addressed in the section “Parallel Vertical Pathways”.
from the extracellular space. Müller cells then transform glucose into lactose, and GABA and glutamate into glutamine, which are then returned to the extracellular space and reutilized by neurons. Moreover, these glial cells buffer extracellular K+ ions in order to guarantee the correct ionic gradients across cellular membranes (Newman & Reichenbach, 1996).
Müller cells further provide support for the neuronal structures and, most surprisingly, may act as living optical ibers within the eye: they can guide photons reaching the retinal surface to the photoreceptor outer segments in the outer retina (Franze et al., 2007). This way, image degradation by the inhomogeneous optical properties of the retinal neuronal elements, which scatter light as it travels from the inner to the outer retina (Hammer, Roggan, Schweitzer, & Muller, 1995), is reduced.
Two other types of glial elements, astrocytes and microglia, are present in vascularized retinas such as ours (Figure 4). These two cell types differ in origin, location and function. Astrocytes are of ectodermal origin, like Müller cells, and localize primarily in the so-called retinal iber layer, which contains mostly GC axons. They wrap around these processes and the axon bundles that ultimately form the optic nerve. Astrocytes vary in morphology, depending on their precise retinal location and relation to blood vessels and neuronal processes (Trivino, Ramirez, Ramirez, Salazar, & Garcia-Sanchez, 1992).
Microglial cells, on the other hand, originate from the mesoderm and can be found in every layer of the retina. While astrocytes are probably responsible for synaptogenesis, nutrition, ionic homeostasis and the modulation of GC activity (Newman, 2003), the retinal microglia are involved in both the immune response against invading agents and the phagocytosis of endogenous debris (Langmann, 2007; Schuetz & Thanos, 2004).
Design Constraints and Cell Distribution
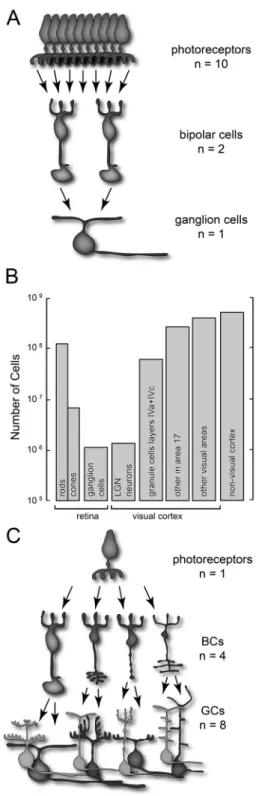
The visual system most likely evolved so as to code visual information optimally within the constraints imposed by biological tissue (such as noise in information transmission, energy/metabolic requirements, limitations in response speed of neurons, etc.). This means transmitting a maximum amount of information using a minimum amount of energy. As an example, the high metabolic cost of keeping a large number of optic nerve ibers (Laughlin, 2001; Lennie, 2003), combined with the mechanical constraints imposed by the need for rapid, relatively large eye movements (Barlow, 1952; Martinez-Conde, Macknik, & Hubel, 2004), led to the evolution of a thin optic nerve. To accommodate the need to both conserve energy and to keep the optic nerve thin, one of the solutions that evolved is a strong convergence of many photoreceptors onto second-order neurons (Figure 5a-b). A beneicial effect of this strategy might be improved sensitivity, because convergence increases the probability of a photon activating a GC. On the other hand, convergence can diminish spatial resolution (e.g. visual acuity), since high spatial resolution requires a large number of nerve ibers with small, non-overlapping receptive ields. This kind of trade-off between speciicity and sensitivity is present in many different aspects of perception, such as brightness and color, movement and form. In order to accommodate the conlicting needs of these different perceptual demands, the visual system developed a second strategy: divergence (Figure 5c).
many different neuronal types are needed. This is true for all retinal neurons, including the photoreceptors, which, as we shall see later, can also be divided into different subtypes.
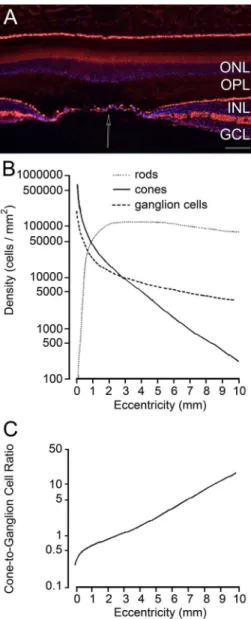
A third strategy that ensures effective transmission of information to the brain is regionalization. In most animals, retinal neurons are not homogeneously distributed. Rather, the retina is roughly divided into central and peripheral areas, in which different neuronal types concentrate. The retinal periphery, for instance, is richer in rods and rod-driven neurons than the central retina (Figure 6b). This implies that visual sensitivity and motion perception are best in the peripheral visual ield(Barlow & Mollon, 1982; Carrasco, McElree, Denisova, & Giordano, 2003), whereas color vision and visual acuity are best in the central visual ield (De Valois & Abramov, 1966; Merigan & Katz, 1990). This is especially true in foveate species such as the human. The fovea is a retinal specialization dedicated to high spatial resolution (Figure 6a). There, photoreceptors connect to second-order neurons on a one-to-one basis, in order to preserve the spatial detail of the information sent to the brain (Kolb, 1970). In the fovea and in its surrounding region, the so-called parafovea, convergence is the smallest and divergence is the largest. As we move from the fovea to the retinal periphery, the amount of convergence changes (Figure 6c). For instance, in the marmoset retina the foveal cone : BC ratio is around 0.1 and the BC : GC ratio is 0.3, but in the midperiphery these ratios change to 0.5 and 6.4, respectively. In the retinal periphery, these numbers raise to 4.6 for the cone : BC ratio and 13.6 for the BC : GC ratio (Chan, Martin, Clunas, & Grunert, 2001).
Another example of regionalization can be found in the very anatomy of retinal cells. Since convergence increases with eccentricity, so do the
dendritic ields of BCs and GCs (Wässle & Boycott, 1991). Photoreceptors also change shape: since the general photoreceptor density decreases towards the periphery, their cross-sectional areas increase (Packer, Hendrickson, & Curcio, 1989). This actually increases the photon-collecting eficiency of peripheral rods and cones, which could compensate for a decreased light gathering eficiency of the eye towards the retinal periphery (Sterling & Demb, 2004).
Information Flow: Vertical and Lateral Pathways
Visual information is not simply conveyed from the retina to the brain. In order to make optimal use of its neuronal elements and transmission capacity, the retina transforms photoreceptor signals at each and every synapse. Therefore, many calculations take place in both plexiform layers before this information leaves the eye.
The laminated organization of the retina generates two streams of visual information (Figure 7): a main or vertical pathway, from the photoreceptors to BCs and from BCs to GCs, and a secondary lateral pathway, comprising local feedback circuits from HCs back to photoreceptors (Byzov, Golubtzov, & Trifonov, 1977; Kamermans et al., 2001; Stell, Lightfoot, Wheeler, & Leeper, 1975), and from ACs back to BCs (Kaneko & Tachibana, 1987; Tachibana & Kaneko, 1987; Yazulla, Studholme, & Wu, 1987). While the vertical low is directly involved in sending signals to the brain, the lateral circuits adjust the gain of the pre-synaptic and post-synaptic cells (also deined as the post-synaptic voltage change resulting from a given pre-synaptic voltage change) at each stage, thereby optimizing signal transmission within the vertical pathway.
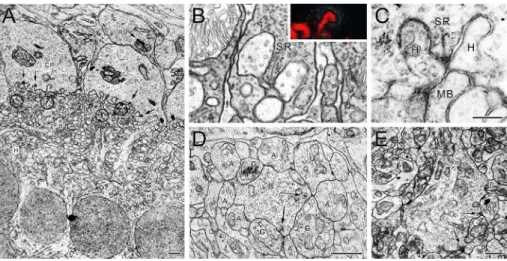
Figure 2. Synaptic organization of the plexiform layers. (A) Low-power electron micrograph of the human outer plexiform layer. Arrows indicate synaptic ribbons. Thick arrows indicate interreceptoral gap junctions. Circles indicate desmossomal junctions between adjacent horizontal cell dendrites. CP = cone pedicles; RS = rod spherules; B = bipolar cell; H = horizontal cell. Scale bar, 1µm. Reproduced with permission from Dowling and Boycott (1966). (B) Rod triad. Inset shows a confocal picture of
a synaptic ribbon labeled with a luorescent marker. SR = synaptic ribbon. From tom Dieck and Brandstätter (2006), with
Photoreceptors, HCs and BCs respond to light with sustained, graded membrane potential changes. This may be so because these neurons have short processes and do not need to transmit information over long distances: passive spread of potential along the cell membrane is enough for information to be transmitted from one end of the cell to the other. A second possible reason could be that such graded potentials are capable of discriminating a wider range of signals than all-or-none action potentials (Barlow, 1981). The irst action potentials observed in the retina are those generated by ACs followed by GCs (Figure 7).
Vertical Transmission
Vertical transmission of visual information lows transversally across the retinal layers to the brain through three main cell types: photoreceptors, BCs and GCs. In the next paragraphs we will examine the main characteristics of these cell types and their respective roles in information coding.
Rods and cones
There are two main types of photosensitive transducers in the retina, rods and cones. They are named on morphological grounds: their outer segments differ in shape
and in the way photosensitive pigments are packed within these segments (Figure 8a). The kinds of photopigments, as well as the regulation of a number of intracellular reactions, are also distinct in rods and cones. Altogether, these differences have a number of consequences for visual function, the most important being sensitivity and the range over which they are able to adjust sensitivity to ambient light levels. Rods are more sensitive to light than cones and enable us to see at dim light levels, even down to single-photon levels, whereas cones are most active when single-photons are plenty (for reviews, see Ebrey & Koutalos, 2001; and Pugh Jr. & Lamb, 2000). Rods have a limited ability to adapt to ambient light levels (Malchow & Yazulla, 1986, 1988; Pugh Jr. & Lamb, 2000), while cones can shift their operating range endlessly to avoid saturation (Burkhardt, 1994; Kox & Solessio, 2006; Pugh Jr. & Lamb, 2000).
In addition to light sensitivity, rods and cones also differ in their sensitivity to lights of distinct wavelengths (Figure 8d). Human rods have their maximal sensitivity around 495 nm (Dartnall, Bowmaker, & Mollon, 1983; Wald & Brown, 1958), whereas cones are divided into three distinct types according to the wavelength of peak absorption or λmax: short wavelength-sensitive cones (S-cones, λmax ≈ 420 nm), middle wavelength-sensitive Figure 3. Müller cells. (A) Drawing of a rabbit Müller cell stained by the method of Golgi. Reprinted from Bringmann, Pannicke, Grosche, Francke, Wiedemann, Skatchkov, Osborne and Reichenbach (2006), copyright 2006, with permission from Elsevier. (B)
Immunostaining of the rabbit retina for vimentin, a ilament protein abundant in Müller cells. These glial elements are evenly spaced
throughout the tissue and span the whole retinal thickness. Thin processes extend from the stout soma at both the OPL and IPL. Scale bar, 20 µm. From Robinson and Dreher (1990), copyright 1990 John Wiley & Sons, Inc. Reprinted with permission of John Wiley & Sons, Inc. (C) Schematic drawing of Müller cells and their relation to other neuronal and non-neuronal structures. Photoreceptors, BCs and GCs are shown in green, blood vessels in red. Reprinted from Bringmann et al. (2006), copyright 2006, with permission
from Elsevier. (D) Light guidance properties. Left: a Müller cell is aligned with two optic ibers by counter-propagating infra-red beams. The left iber emits visible light at 514 nm (“green”), whereas the right iber collects the light transmitted through the
Müller cell and guides it into a power meter. Right: power meter reading during the experiment. When the cell is removed from the
optical path, the amount of light that reaches the power meter decreases, indicating that Müller cells behave much like optical ibers
cones (M-cones, λmax ≈ 530 nm), and long wavelength-sensitive cones (L-cones, λmax ≈ 560 nm) (Dartnall et al., 1983). The existence of photoreceptors with different peak absorptions is the irst step in our ability to see colors. The next step lies in post-receptoral processing by second- and third-order neurons. Table 1 summarizes the main differences between rods and cones.
The dynamic range of a photoreceptor can be determined by measuring its light responses as a function of photon capture rates (for continuous illumination) or lash intensities. Whatever the measurement applied, although there is a big difference in the absolute threshold of the different kinds of photoreceptors, the dynamic ranges of both rods and cones are about 2 log units when no adaptive processes are taken into account (Baylor & Fuortes, 1970; Grabowski, Pinto, & Pak,
Figure 4. Other glial elements of the retina. (A) Three-dimensional drawing of rabbit perivascular astrocytes. Astrocyte morphology varies with retinal location and with the type of structure (axons or vessels) with which they relate. Reprinted from Trivino, Ramirez, Ramirez, Salazar and Garcia-Sanchez (1992), copyright 1992, with permission from Elsevier. (B) Vertical section through the human retina showing the localization of GFAP-positive astrocytes in the
iber layer. Some astrocytic processes advance into the IPL
(arrow) and INL. Reprinted from Ramirez, Trivino, Ramirez, Salazar and Garcia-Sanchez (1994), copyright 1994, with permission from Elsevier. (C) Relationship between astrocytes, GC axon bundles and retinal blood vessels. Reprinted from Trivino, Ramirez, Salazar, Ramirez, Garcia-Sanchez (1996), copyright 1996, with permission from Elsevier. (D) Microglia from the rabbit retina, vertical section. An NDP-ase positive microglial cell located at the IPL extends a process through the INL (arrow) to the OPL (large arrow). Scale bar, 20 µm. From Schnitzer (1989), copyright 1989 John Wiley & Sons, Inc. Reprinted with permission of John Wiley & Sons, Inc. (E) Microglia of the rabbit retina, whole mount with focus plane at the IPL. Scale bar, 50 µm. From Schnitzer (1989), copyright 1989 John Wiley & Sons, Inc. Reprinted with permission of John Wiley & Sons, Inc.
1972; Schneeweis & Schnapf, 1995). Furthermore, their spectral sensitivity overlap in great part (Figure 8d).
A photoreceptor light response is basically a change in membrane potential (Figure 8b). In the dark, photoreceptors are relatively depolarized in relation to other CNS neurons (around -45 mV), because cGMP-gated cation channels in their outer segments are held open in the absence of a stimulus (Baylor, 1987). Since these channels are non-speciic (i.e. their reversal potential is around 0 mV), there is a standing
inward current lowing, which keeps the photoreceptors at a relatively depolarized state. Light stimulation leads to the closure of these cation channels, decreasing this dark current and hyperpolarizing the cells (Figure 9).
But how does exactly a photoreceptor “see the light”? This is achieved by a process called phototransduction, which is comprised of a cascade of intracellular biochemical reactions triggered by light (Figure 9). These reactions, in turn, lead ultimately to the closure of the cGMP-gated channels in the outer segments and consequently to a voltage-dependent modulation (Schmitz & Witkovsky, 1997) of neurotransmitter (glutamate) release rate at the synaptic terminal of the photoreceptors. It is this modulation of glutamate concentration in the OPL that is sensed by glutamate receptors on BC and HC dendrites (Cervetto & MacNichol, 1972; Kaneko & Shimazaki, 1976; Murakami, Ohtsu, & Ohtsuka, 1972).
The phototransduction cascade is roughly similar in rods and cones. It starts with a G-protein-coupled receptor called rhodopsin in rods and cone opsin in cones. This protein is inserted into membranous disks in the outer segment of the photoreceptors and contains a light sensitive chromophore called 11-cis-retinal. In the dark, this photoactive molecule is inactive, and so is its downstream cascade. Guanylate cyclase continuously produces cGMP from GTP, and phosphodiesterase continuously breaks some of this cGMP down. Together, the basal activity of these two enzymes keeps the concentration of cGMP in darkness high. Two to three cGMP molecules open an ionic channel in the outer segment membrane, the cGMP-gated cation channel, allowing Na+ and Ca2+ ions to low across the membrane and depolarize the cell. Na+, Ca2+ and K+ concentrations are restored by the activity of a 4Na+-Ca2+/K+ exchanger in the outer segment membrane, and by a 2K+-3Na+ pump in the inner segment.
Upon absorption of a photon, the photopigment changes conformation, which “activates” the opsin, converting it into an extremely active enzyme that activates many molecules of transducin (Leskov et al., 2000), the G-protein coupled to this receptor. This is, thus, a stage of ampliication. Each activated transducin activates one subunit of phosphodiesterase, enhancing its hydrolyzing activity and leading to a decrease in cGMP concentration. This is another ampliication stage of phototransduction. The resulting fall in cGMP levels is the step directly leading to the closure of cGMP-gated channels and membrane hyperpolarization. When the light stimulus returns to baseline levels (or darkness), cGMP concentrations also return to basal levels, the cGMP-gated cation channels reopen, and the photoreceptor depolarizes back to its resting membrane potential (Baylor, 1987; Burns & Lamb, 2003; Luo, Xue, & Yau, 2008; Pugh Jr. & Lamb, 2000).
In order for photoreceptors to be able to respond in a timely fashion to changes in light stimuli, all the molecules activated in the G-protein cascade (rhodopsin, transducin, phosphodiesterase) need to inactivate. Figure 6. Regional distribution of neurons in the retina. (A)
Vertical section through the human fovea. Picture courtesy of Dr. Jan Klooster, The Netherlands Institute for Neuroscience. (B) Density of rods, cones and GCs throughout the primate retina. Densities in the rhesus monkey retina were measured along the temporal horizontal meridian; zero eccentricity represents the fovea. Reproduced with permission from
Boycott and Wässle (1991). (C) Cone-to-GC ratio throughout
the monkey retina. Divergence is maximal in the fovea, where there are almost 3 GCs per cone. As eccentricity increases, divergence decreases and convergence increases. At the retinal periphery, there are more than 10 cones per GC. Reproduced
Photoreceptors have evolved specialized proteins that participate in a series of inactivation steps and powerful negative feedback reactions that are often modulated by Ca2+. Together, these processes also allow photoreceptors to light-adapt, that is, to shift their operating range according to the main light levels.
These reactions, described briely below, were reviewed in great detail elsewhere (Burns & Lamb, 2003; Luo et al., 2008; Pugh Jr. & Lamb, 2000). Briely, rhodopsin is irst phosphorylated by an enzyme called rhodopsin kinase; the phosphorylated rhodopsin then tightly binds to a protein called arrestin. This decreases the catalytic activity of the molecule, stopping the activation of transducin molecules and phosphodiesterase. Eventually, the all-trans chromophore is separated from the opsin and replaced by a new pigment molecule in the 11-cis coniguration. Previously activated transducin molecules also inactivate, due to the intrinsic ATPase activity of the alpha subunit.
This process is, however, quite slow, but is considerably sped up by the activity of the so-called regulators of G-protein signaling (or RGS) proteins. Because RGS proteins can only speed up the inactivation of transducin when it is bound to phosphodiesterase, their activity also decreases the rate of cGMP hydrolysis by this enzyme and leads to a fast shut down of the light response.
induced decrease in Ca2+ speeds up rhodopsin inactivation, because rhodopsin kinase is normally inhibited by another Ca2+-binding protein called recoverin. Finally, Ca2+ also changes the sensitivity of the membrane cation channels to cGMP, which is normally regulated via another Ca2+ -binding protein called calmodulin. Because all of these Ca2+-mediated processes can actually lead to the reopening of the cGMP-gated channels during prolonged stimulation, they not only speed up recovery from brief light stimuli, but also underlie the ability of photoreceptors to light adapt to prolonged stimulation, shifting their operating range according to the mean ambient light levels.
The light-induced hyperpolarization of the photoreceptor modulates voltage-gated Ca2+ channels at the synaptic terminal, reducing the rate of exocytosis of synaptic vesicles loaded with glutamate (Choi et al., 2005; Heidelberger, Thoreson, & Witkovsky, 2005). Photoreceptors are quite unique neurons, because they continuously release glutamate at rest, whereas most CNS neurons are silent at rest and release bursts of neurotransmitter only when stimulated.
In order to cope with the high release rates of photoreceptors, organelles called synaptic ribbons are anchored in the synaptic terminals close to release sites (Figure 2). Ribbon zones dock 5-10 times more vesicles than conventional synapses, suggesting that synaptic ribbons facilitate release (Prescott & Zenisek, 2005; Rao-Mirotznik, Harkins, Buchsbaum, & Sterling, 1995; Sterling & Matthews, 2005). The precise mechanism through which synaptic ribbons may inluence neurotransmitter release is, however, still a mystery.
Bipolar cells
Although photoreceptors only hyperpolarize to light stimulation, at the BC level this signal is split into two main streams of information: one BC type
hyperpolarizes when a light stimulus falls within the center of its receptive ield and another one depolarizes under the same stimulus conditions (Figures 7 and 10). The former are called hyperpolarizing or OFF BCs, and the latter are called depolarizing or ON BCs (Joselevitch & Kamermans, 2007; Kaneko & Hashimoto, 1969; Werblin & Dowling, 1969).
There seems to be some correlation between the polarity of the BC light responses to white light and the position of its dendrites in the triads (Figure 2a), as well as the stratiication level of its axon terminal at the IPL (Figure 10). The axons of OFF BCs terminate in the most distal stratum or sublamina a, whereas those of ON BCs terminate more proximally, in sublamina b (Famiglietti, Kaneko, & Tachibana, 1977; Famiglietti & Kolb, 1976; Nelson & Kolb, 2003).
In the human retina, at least 11 different types of morphologically distinct BCs have been described (Boycott & Wässle, 1991; Kolb, Linberg, & Fisher, 1992; Mariani, 1983, 1984). These morphological types are arranged in two major classes: an ON BC connected exclusively to rods, and ON and OFF BCs that receive inputs exclusively from cones. Cone-driven BC axon terminals stratify roughly at one of the two main sublaminas, whereas some present, in addition, characteristic patterns of multilaminar spread of terminals in the IPL (Mariani, 1983). BCs with terminations in both sublaminas of the IPL were also identified in a number of other species (Connaughton & Nelson, 2000; Scholes, 1975; Scholes & Morris, 1973; Wu, Gao, & Maple, 2000), but their response properties have not been thoroughly investigated.
Patterns of convergence and divergence to and from BCs vary according to BC type and according to retinal Table 1. Main differences between rods and cones. Modiied from Ebrey & Koutalos (2001); (1):
Migdale et al. (2003); (2): Chun, Grunert, Martin and Wässle (1996); (3): Burns and Lamb (2003) and
Pugh Jr. and Lamb (2000); (4): Dartnall, Bowmaker and Mollon (1983).
Rods Cones
General morphology cylindrical outer segments conical outer segments
Photopigment rhodopsin cone opsin
Number of ribbons 1-2(1) 20-40(2)
Light level scotopic photopic
Absolute sensitivity high low
Saturation yes no
Response speed slow fast
Ability to light adapt limited(3) large(3)
Rate of dark adaptation slow fast
eccentricity. Even though the connectivity of many primate BCs is still being determined (see, for example, Telkes, Lee, Jusuf, & Grunert, 2008), at least for some cells there are numbers available. Flat midget BCs (labeled “FMB” in Figure 10a), for instance, are OFF-type neurons that contact only one cone and only one ganglion cell each in the fovea (Kolb, 1970). The same is true for their ON counterpart, the invaginating midget BCs (labeled “IMB” in Figure 10a). In the periphery, around three cones converge onto one FMB and one IMB, and between 8 and 13 FMBs converge onto one midget ganglion cell (Chan et al., 2001; Jusuf, Martin, & Grunert, 2006).
Since ON and OFF BCs are activated by the same glutamate release in the OPL, one might wonder how they can respond to light differently. This is achieved by expressing distinct sorts of glutamate receptors at the tips of their dendrites (Figure 11). OFF BCs use ionotropic (iGluRs) receptors (both AMPA and kainate,
DeVries & Schwartz, 1999; DeVries, 2000), whereas ON BCs express metabotropic receptors (mGluR6) at their synaptic contacts with photoreceptors (Nakajima et al., 1993; Vardi, Duvoisin, Wu, & Sterling, 2000; Vardi & Morigiwa, 1997).
Ionotropic receptors, or iGluRs, are at the same time glutamate-binding proteins and non-speciic cation channels (Eccles & McGeer, 1979). In the dark, when the agonist is present and activates these receptors, the membrane pores are kept open and an inward current lows through the OFF BC membrane, keeping OFF BCs depolarized (Kaneko & Saito, 1983; Saito & Kaneko, 1983). When photoreceptors are stimulated by light and decrease their neurotransmitter release, glutamate unbinds from the BC receptors, causing a conformational change in the cation channels, closing them. The consequent cessation of ionic low through the cell membrane hyperpolarizes OFF BCs with a
Figure 8. Photoreceptors. (A) Morphology of rods and cones from the monkey (Macaca fascicularis)retina. Redrawn from Marc (1999), copyright 1999, with permission from Elsevier. One of the most obvious differences between rods and cones lies in the morphology of their outer segments, enlarged to the side of each drawing. Rods have rod-like outer segments, while the shape of the cone outer segment tends to be conical. Furthermore, the membranous disks containing the visual pigment are stacked within the rod outer segment, while in cones these disks are contiguous to the outer segment membrane. (B) Photovoltage. Light responses of a rod (top) and of an L-cone (bottom) of the macaque monkey retina to 500 nm stimulation at increasing intensities, measured with the perforated patch technique. Rod responses are much slower
than cone responses: not only do they start later in relation to stimulus onset, but they also last longer. Timing of the light lash is indicated by
the vertical grey bar. Adapted from Schneeweis and Schnapf (1995). Reprinted with permission from AAAS. (C) Photoreceptor dynamic range. Normalized response amplitudes of 5 macaque rods to light stimuli of increasing intensity. The intensity-response relation of a photoreceptor
can be itted with a sigmoidal curve (solid line) that spans around 2 log units before reaching saturation if one does not take light adaptation into
account. Adapted from Schneeweis and Schnapf (1995). Reprinted with permission from AAAS. (D) The mean absorbance spectra of the four
time course that closely follows the voltage changes experienced by the photoreceptors.
Metabotropic receptors or mGluRs, on the other hand, do not form pores in the ON BC membrane. They are, instead, G-protein-coupled receptors that work
similarly to other G-protein receptors in the body, such as rhodopsin (Eccles & McGeer, 1979). In the dark, they activate a G-protein (Goα in this case)that starts a cascade of events leading ultimately to the closure of a non-speciic cation channel somewhere else in the cell (Euler & Masland, 2000; Nawy & Copenhagen, 1987; Saito, Kondo, & Toyoda, 1979). The localization of this cation channel, as well as the speciic cascade leading to its modulation, are to date unknown. Nonetheless, the closure of these mGluR-driven channels in darkness keeps ON BCs hyperpolarized at rest. When glutamate levels in the synaptic cleft decrease with light, the synaptic activation decreases and cation channels open, allowing ions to low into the cell and depolarizing the ON BC.
Ganglion cells
Consistent with the divergence of photoreceptor signals into parallel streams of information transmission at the BC level, GCs also come in many lavors. If there are four types of photoreceptors and 11 different types of BCs in the human retina, at least 17 types of GCs were described in primates (Dacey, 2004; Dacey & Packer, 2003; Field & Chichilnisky, 2007), indicating that photoreceptor signals diverge further at the IPL. Even though GCs express only ionotropic receptors, these neurons also follow the ON/OFF dichotomy initiated at the OPL, by contacting preferentially ON or OFF BCs in distinct IPL strata (Figure 12a).
Similar to what happens with BCs, some GCs also have multilaminar contact patterns in the IPL (Figure 12a). This means that, in addition to ON and OFF GCs, there are also cells that ire at both light onset and offset (ON/OFF GCs), as well as neurons that selectively ire ON or OFF-type responses, depending on the wavelength of the stimulus. Such GCs are common both to cold-blooded vertebrates such as ish (Daw, 1967, 1968) and turtle (Rocha, Saito, Silveira, de Souza, & Ventura, 2008), and to warm-blooded vertebrates, such as the cat (Daw, 1972; Ringo & Wolbarsht, 1986) and monkey (Dacey, 1999; Gouras & Zrenner, 1981). Examples can be found in Figure 18b and c.
Two main types of primate GCs were most extensively studied physiologically: parasol and midget GCs (Figure 12a, left), which come in both ON and OFF varieties (for reviews, see Dacey, 2000, 2004; Kaplan, Lee, & Shapley, 1990; Shapley & Perry, 1986). They comprise together more than half of the total GC population and project to the magnocellular and parvocellular layers of the LGN, respectively, being therefore also called M- and P-cells (Dacey, 2004). Because M-cells are broadband, they were assumed to underlie the perception of brightness. P-cells, on the other hand, due to their spectrally opponent responses, were long thought to be the neuronal substrate for color vision (Lennie, Pokorny, & Smith, 1993).
The function of parasol and midget GCs, however, is still unclear. There are many mismatches between some perceptual phenomena attributed to either cell type and Figure 9. Phototransduction in rods. (A) The dark current.
the physiology of their two “neuronal correlates”. For instance: many percepts, such as acuity as determined by some methods, have a “magnocellular-like” spectral sensitivity but are not consistent with parasol ganglion cell distribution and physiology at all. Color vision, which supposedly is mediated by the parvocellular system, has poor spatial resolution; yet midget cells have smaller dendritic ields and contact less cones than parasol ganglion cells (Lennie et al., 1993).
Finally, the magno/parvocellular “dichotomy” was shown to be at least a “trichotomy” about a decade ago, with the characterization of the koniocellular pathway (for a review, see Hendry & Reid, 2000) and with recordings of retinal cells with neither parvo- nor magnocellular physiology (Calkins, Tsukamoto, & Sterling, 1998; Dacey & Lee, 1994). In cats, the division of ganglion cells into more than three physiological types has a history of at least three decades (reviewed in Shapley & Perry, 1986). Given the fact that there are 17 morphological types of GCs, it seems reasonable to assume that the magno/parvocellular division is only part of a much more complex story.
GCs are the irst retinal neurons in the vertical pathway to respond to light with all-or-none action potentials
Figure 10. Bipolar cells. (A) Types of primate BCs and their stratiication pattern in the OPL. Redrawn from Mariani (1989) and
Boycott and Wässle (1999). Copyright 1989, with permission from Elsevier. Copyright 1999 by Investigative Ophthalmology
& Visual Science. Reproduced with permission of Investigative Ophthalmology & Visual Science in the format Journal
via Copyright Clearance Center. DB = diffuse bipolar; FMB = lat midget bipolar; GB = giant bistratiied bipolar; IMB =
invaginating midget bipolar; BB = blue bipolar; RB = rod bipolar. (B) ON BC properties. Left: Fluorescence micrograph of
a recorded ON BC of the goldish illed with Lucifer Yellow and still attached to the recording electrode. The axon terminal stratiies at the innermost part of the IPL. Right: Light responses of the same cell to a 250 μm slit and to a broad ield at 550
nm and similar intensities (-0.44 and -0.68 log, respectively). Horizontal bars indicate stimulus timing (500 ms), vertical bar =
2 mV. From Joselevitch (2005). (C) OFF BC properties. Left: Fluorescence micrograph of a recorded OFF BC of the goldish illed with Lucifer Yellow and still attached to the recording electrode. The axon terminal stratiies at the outermost part of the IPL. Right: Light responses of the same cell to a 250 μm slit and to a broad ield at 550 nm and similar intensities (-0.11 log and
-0.01 log, respectively). Horizontal bars indicate stimulus timing (500 ms), vertical bar = 4 mV. From Joselevitch (2005).
(Figure 7c and 12b). This kind of signaling is needed because their axons extend for long distances along the optic nerve before reaching their targets in the brain. While action potentials permit long-distance transmission along such processes, they also limit considerably the amount of information that can be transmitted in a given amount of time, due to the number of spikes that a cell can produce per unit time (Barlow, 1981; Koch et al., 2004).
The limited bandwidth of GCs might be one of the reasons – if not the main reason – for the existence of parallel vertical pathways from the retina to the brain. Because one single GC type cannot encode optimally all aspects of a visual scene, different GC types “specialize” in certain tasks. For instance, high visual acuity needs GCs with small dendritic ields that collect from only a few photoreceptors or even a single photoreceptor in the fovea (Kolb, 1970; Wässle & Boycott, 1991). The signal-to-noise ratio of these GCs, however, is poorer than that of a neuron that responds to light in a sustained manner (Dhingra & Smith, 2004).
noise (Sterling, 2003). The beneits of multiple sampling and dendritic ield overlap for contrast perception and visual acuity are discussed in detail in Borghuis, Ratliff, Smith, Sterling and Balasubramanian (2008), Eurich and Schwegler (1997), Hughes (1981) and Joselevitch and Kamermans (2008).
Energy consumption is also an important matter when it comes to retinal design and GC response properties. Even though photoreceptors are the most metabolically active cells in the body, generating spikes is also costly (Laughlin, 2001; Lennie, 2003). For certain types of information that do not need quick transmission (i.e. local edge detection), cells that do not ire at high rates are a more cost-eficient solution (Ames & Li, 1992; Koch et al., 2004). Together, these reasons justify the plethora of GC types found in the retina.
Lateral Interactions
Lateral interactions happen at both synaptic layers of the retina. HCs in the outer retina and ACs in the inner retina average the input they receive from photoreceptors and BCs, respectively, and send feedback signals, based on this average, to the photoreceptors and BCs that adjust their
Figure 11. Glutamate receptors of bipolar cells. (A) Ionotropic receptors. Left: iGluRs are an assembly of multiple subunits (purple) that form a membrane pore in the BC dendrite
(grey). This pore allows ions to low to the interior of the cell
in darkness, when glutamate (green) is bound. Right: In the light, the fall in glutamate concentration leads to the closure of these channels, hyperpolarizing the cells. (B) Metabotropic receptors. Left: mGluRs are composed by a single subunit with a glutamate-binding domain (pink). In darkness, glutamate (green) activates these receptors which, in turn, activate many G-protein molecules. The alpha subunit decouples from the beta-gamma complex and, by a mechanism still unknown, keeps an ionic channel (blue) somewhere else in the cell closed. Right: in the light, the absence of glutamate terminates G-protein activity, leading to channel opening.
Figure 12. Ganglion cells. (A) Morphological types of primate GCs. Top: schematic drawing of the 17 different types of primate
GCs described so far and their characteristic stratiication pattern in the IPL. Reproduced from Figure 20.4.a, page 291 of Dacey
(2004), copyright 2004, Massachusetts Institute of Technology, by permission of The MIT Press. (B) Response patterns recorded
from cat GCs to light stimuli of increasing intensity. There are multiple classiications for GC responses (i.e. X/Y/W in the
cat, brisk sustained/brisk transient/sluggish in the guinea pig, etc.), depending on response properties and the species studied.
Overall, GC responses can be ON, OFF, or ON/OFF. The irst type spikes at the onset of the light stimulus, the second spikes at
the termination of a light stimulus, and the third spikes at both light on- and offset. There is some correlation between the type of
response (ON, OFF or ON/OFF) and the stratiication pattern of GC dendrites in the IPL. Stimulus intensity depicted to the left
output. This adjustment is advantageous for many reasons. In general, feedback circuits improve the reliability and stability of the neuronal output (Wu, 1992). They remove part of the noise from this signal by integrating over large areas and at the same time shift the dynamic ranges of both pre- and post-synaptic neurons such that the gain (or input-output relationship) of these synapses remains relatively high at different ambient light levels. This gain correction removes redundancy from the cone output and, in turn, assures adequate contrast sensitivity of the visual signal.
Contrast sensitivity is further improved by an important consequence of the lateral interactions via retinal feedback circuits, namely the classic center-surround organization characteristic of BCs and GCs (Kaneko, 1973; Kufler, 1953; Werblin & Dowling, 1969), shown in Figures 7c and 13. This concentric center-surround organization inely tunes the output of
ganglion cells, improving their spatial resolution. Because HCs and ACs integrate over such large areas, the receptive ield of the feedback signals is broader than that of the forward signal. As a result, the receptive ields of BCs and GCs are concentrically arranged into antagonistic zones: illumination of the surround decreases or fully antagonizes the response to illumination at the center of the receptive ield (Kaneko, 1973; Kufler, 1953; Werblin & Dowling, 1969).While the center is a result of direct photoreceptor input, the surround is partly generated by the feedback interactions between HCs and photoreceptors in the outer retina (Fuortes & Simon, 1974), and between ACs and BCs in the inner retina (Miller, 1979).
The main beneit of center-surround interactions in the retina might be the removal of redundant information, so that retinal neurons can make optimal use of their transmission capacity (Sterling & Demb, 2004). Redundancy can be, for Figure 13. Center-surround organization. (A) Receptive ield structure of outer retinal neurons. Upward delection means depolarization,
downward delection means hyperpolarization. Cones only hyperpolarize to light falling onto their “receptive ield”, which is the retinal area where a stimulus can potentially activate them. The receptive ield of individual cones has a Gaussian shape and is not extensive (black line), because cones are not strongly coupled. The receptive ield of HCs also has a Gaussian shape, but is much broader as a
consequence of the strong electrical coupling between these cells (grey). The combination of these two Gaussians at the BC level results in the so-called center-surround organization of BCs, which has roughly the shape of the subtraction between two Gaussians (colored lines): the photoreceptor feedforward input (black Gaussian) minus the HC feedback input (grey Gaussian). (B) BC response properties change with stimulus size. Responses of an ON (blue traces) and OFF BC (pink traces) of the primate retina to light stimulation with a spot comprising only 1 degree of visual angle (upper row) and 5 degrees of visual angle (bottom row). Response polarity reverses when both center and surround are activated. Square pulses depict stimulus timing. Scale bar = 2 mV. Reprinted from Dacey, Packer, Diller, Brainard, Peterson and Lee (2000), copyright 2000, with permission from Elsevier. (C) Model for the generation of the receptive
ield structure of inner retinal neurons. Top: receptive ield structure of ON and OFF BCs. Upward delection means depolarization, downward delection means hyperpolarization. Middle: rectiication occurs at the BC-GC synapse, that is, only BC depolarization
elicits synaptic transmission. ON GCs surrounds and OFF GCs centers are then formed by active AC inhibition at the IPL. Adapted
with permission from Roska et al. (2006). (D) GC response properties change with position. Left: receptive ield organization of a cat
ON GC. When stimulated with a small spot of light at different positions in relation to the recording electrode, GC responses vary from excitatory or ON (crosses, innermost area) to inhibitory or OFF (circles, outermost area), with an intermediate area in which cells respond to light with both ON and OFF discharges (circles with crosses, intermediate area). Scale bar = 1 mm. Right: Response
instance, correlations between photoreceptor signals when responding to the same mean intensity of a scene. This kind of correction is termed predictive coding (Srinivasan, Laughlin, & Dubs, 1982), because laterally integrating neurons average this mean intensity level, or redundant information, over a certain area and make a “prediction” for the intensity of the center, which is subsequently subtracted from the main signal via feedback. This way, only the relevant information (i.e. the changes around this mean) is passed on to the subsequent neural stages, reducing the need for generation of expensive (and redundant) spikes.
The visual system proits from feedback signals also in the temporal domain. Feedback modulates the duration of the neuronal output, thereby speeding up signal transmission along the vertical pathway. Since every chemical synapse is coupled to a delay, signal transmission from the outer retina to the brain would be considerably slowed down if such compensatory mechanisms did not exist.
But how do these lateral pathways actually work? While the vertical pathway relies on glutamate as its major neurotransmitter, HCs and ACs signal in alternative ways. The mechanism of outer retinal feedback is still under debate. Although HCs produce
and release GABA in the outer retina (Marc, Stell, Bok, & Lam, 1978; Wu, 1992; Yazulla, 1986), the time constant of the GABAergic effect is not consistent with the quick feedback effects, but rather with some modulatory role in the feedback pathway (Fahrenfort, Sjoerdsma, & Kamermans, 2003). Accordingly, pH in the synaptic cleft also seems to modulate the strength of HC feedback to photoreceptors (Hirasawa & Kaneko, 2003; Vessey et al., 2005).
It was recently suggested that HCs control the photoreceptor output by an electrical or ephaptical feedback mechanism (Kamermans et al., 2001). Semi-gap junctional channels are expressed at the tips of the dendrites of these cells, and during a light response, they allow current to low into HCs, changing thereby the local voltage of the extrasynaptic space. Because photoreceptor glutamate release is voltage-dependent (Schmitz & Witkovsky, 1997), this voltage change eficiently modulates the photoreceptor output and the gain of the photoreceptor-BC synapse.
In the inner retina, lateral integration relies mostly on conventional (chemical) synapses. Many neurotransmitters are involved in AC signaling. The two
Figure 14. The role of horizontal cells in color constancy. (A) Demonstration of color constancy. Left: Under natural light, the red pepper and the tomatoes in the scene look red. Middle: The sensation of redness disappears when one applies a blue/
green ilter selectively on top of the pepper and tomatoes. Right: The sensation of redness reappears when the whole scene
is displayed under blue/green light. Reprinted with permission from VanLeeuwen et al. (2007). (B) HC activity induce color constancy. Top: Modeled behavior of primate cones to the presentation of a white spot on a grey background when the illumination changes from reddish (left) to greenish (right). The color triangles represent the ratios of cone activity in the color space (left) and the cone outputs as measured by the HC-induced shift in cone Ca2+ current (right). The ratios of cone activity change as the illumination does (arrow). The cone output, however, remains constant as illumination changes,
indicating that HC feedback eficiently corrects for the spectral composition of the illuminant. Bottom: Similar results for
major substances released by ACs in the IPL, however, seem to be GABA and glycine (Eggers & Lukasiewicz, 2006; Wässle & Boycott, 1991). In the next two sections, we will see how feedback from HCs and ACs can, in addition to correcting the photoreceptor and BC outputs, subserve perceptual phenomena such as color constancy and motion detection.
Horizontal cells
There are at least three types of HCs in the human retina, called HI, HII and HIII (Ahnelt & Kolb, 1994a; Kolb, 1970; Kolb et al., 1994). They differ slightly in morphology and in their photoreceptor contacts: HI contacts both rods and cones, whereas HII contacts exclusively cones. HIII has so far been shown to contact exclusively M- and L-cones (Ahnelt & Kolb, 1994a).
A very interesting role for HCs in the visual system has emerged from experiments in the ish retina (Kamermans, Kraaij, & Spekreijse, 1998; Kraaij, Kamermans, & Spekreijse, 1998). HCs contact all different spectral types of cones with more or less selectivity in different species (Ahnelt & Kolb, 1994a, 1994b; Dacey, Lee, Stafford, Pokorny, & Smith, 1996; Stell et al., 1975), and are electrically coupled (Dowling & Ripps, 1971; Marchiafava & Pasino, 1973; Naka, 1972). By sampling and sharing the responses of a large population of cones, they “get a feeling” about the spectral composition of the ambient illumination, and feed this information back into the photoreceptors.
Even though the HC-cone feedback pathway is called “negative”, it can actually increase the gain (here deined as the modulation of cone glutamate release yielded by a certain cone voltage change) of the photoreceptor synapse, depending on the relative polarization of the different types of photoreceptors (Kamermans, Van Leeuwen, Numan, Sjoerdsma, & Fahrenfort, 2006; Kraaij, Spekreijse, & Kamermans, 2000; Skrzypek & Werblin, 1983). This is because the strength of the feedback signal varies with the amount of light falling onto individual photoreceptors. Unstimulated or weakly stimulated cones receive a stronger feedback signal than cones directly stimulated by light (Kraaij et al., 2000; Skrzypek & Werblin, 1983).
The consequence of this arrangement is that, if the environmental light is reddish (as during sunrise or sunset), the cones least sensitive to red light (S- and M- cones), and thereby least stimulated directly, will receive the strongest feedback. Their output will have higher gain than that of L-cones, and the output of the photoreceptor layer as a whole will be more blue-green (Kamermans et al., 1998; Kraaij et al., 1998). This effectively counterbalances the redness in the environment, just like the white balance system of a camera compensates for color casts in a scene (Kraaij et al., 1998; VanLeeuwen, Joselevitch, Fahrenfort, & Kamermans, 2007; Wu, 1992).
Such a “white balance” dynamically tunes the spectral sensitivity of the photoreceptors to the characteristics of the illuminant (Kamermans et al., 1998; VanLeeuwen et
al., 2007). This basically represents the neuronal substrate for color constancy (Figure 14), which is the ability of the visual system to perceive colors in a somewhat constant manner, independently of the spectral composition of the environmental light (Jameson & Hurvich, 1989). Even though there are species-speciic differences as regards retinal wiring and HC receptive ield sizes, the
Figure 15. Some AC circuits. (A) AII ACs and the transmission of rod-driven signals. After a light stimulus (yellow) activates
rods, rod signals low to rod BCs and, from these, to AII ACs
via conventional excitatory (glutamatergic) synapses (green arrows). AII ACs pass the signal further to ON cone BCs via electrical synapses (orange resistor and orange arrow) and to OFF cone BCs via inhibitory (glycinergic) synapses (red arrows). Finally, cone BCs transmit rod-driven signals to GCs via excitatory (glutamatergic) synapses (green arrows). (B) Starburst ACs and direction selectivity. Starburst ACs are intrinsically sensitive to the direction of motion due to
the organization of their receptive ields. Their surrounds are
generated by inhibition by neighboring ACs of the same type, such that there is an offset between excitatory and inhibitory inputs to these cells according to the direction of motion. Let us examine what happens with the AC in the center of the
igure during two types of motion. Stimuli moving from the periphery towards the center of the receptive ield (yellow bar) will irst activate inhibition via other starburst amacrine cells
(left red trace and arrows). Conversely, stimuli moving from
the center to the periphery (blue bar) will irst activate direct
potential to induce color constancy is a general property of the system, whether in ish or mammalian species (VanLeeuwen et al., 2007).
Amacrine cells
ACs comprise the most diverse neuronal type in the retina. To date, more than 24 types have been described in man (Kolb et al., 1992). These cells are involved in multiple subcircuits in the inner retina, some of which include intricate loops of AC-AC connections (Marc & Liu, 2000; Roska, Nemeth, & Werblin, 1998). Much about these subcircuits and their function is still
unknown. In this section, we will concentrate on some AC circuits whose functions are better understood.
Perhaps the best characterized AC circuit is the one involving AII ACs and rod-driven signals (Bloomield & Dacheux, 2001). Technically speaking, this is not a feedback system. AII ACs are the most abundant AC cell type in the retina and serve as interneurons in the rod pathway (Figure 15a). They pool from around 25 rod-driven BCs via sign-conserving synapses and convey the rod-driven signal to the inner retina through gap junctions with cone-driven ON BCs (Mills, O´Brien, Li, O´Brien, & Massey, 2001) and through sign-inverting (glycinergic) synapses onto cone-driven OFF BCs (Bloomield & Dacheux, 2001; McGuire, Stevens, & Sterling, 1984).
Starburst ACs are the second most abundant type of AC in the retina(Masland, 2005). They have been shown to play key roles in both developing and adult retinas. In the irst case, starburst ACs communicate with each other through both cholinergic and GABAergic synapses (O’Malley, Sandell, & Masland, 1992), which in early post-natal days are excitatory, guaranteeing the generation and propagation of retinal activity waves (Zheng, Lee, & Zhou, 2004). These waves, in turn, are fundamental for the formation and stabilization of retinal synapses at the GC level and beyond (Katz & Shatz, 1996; Sernagor, Eglen, & Wong, 2001).
In the adult retina, starburst ACs seem to mediate direction selectivity. Some GCs respond strongly to stimuli moving in a preferred direction (i.e. left to right), but are completely silent when the very same stimulus is presented moving in the opposite direction (Barlow, Hille, & Levick, 1964; Barlow & Levick, 1965). Starburst ACs were shown to mediate this phenomenon by inhibiting GCs in a highly ordered manner (Fried, Munch, & Werblin, 2002). The processes of these cells are connected asymmetrically with direction-selective GCs, delivering strong inhibition only in the null direction (Figure 15b).
Other ACs have been suggested to participate in related phenomena such as the perception of object motion as opposed to background motion (Baccus, Olveczky, Manu, & Meister, 2008; Olveczky, Baccus, & Meister, 2003) and response suppression to quick eye movements (Roska & Werblin, 2003). Finally, one important aspect of most AC circuits is that they can speed up the visual signal as it travels from BCs to GCs (Bieda & Copenhagen, 2000; Nelson, 1982). This step is very important in the transformation of the sluggish, sustained potential changes found in the outer retina into the crisp spiking behavior of GCs, in addition to compensating for the synaptic delays mentioned earlier.
Information Processing: Parallel Vertical Pathways
As discussed previously, the divergence of photoreceptor signals onto different types of second-order neurons is needed in second-order to transmit information Figure 16. Temporal iltering at the cone-BC synapse. (A) Receptor
makeup inluence BC response dynamics. In this experiment, a
eficiently to higher visual areas. This divergence generates a series of parallel vertical streams of information low in the retina, each more or less specialized in transmitting certain aspects of the visual world to the brain.
Rod and Cone Pathways
Rod signals low to the inner retina through three main pathways that differ in sensitivity (one of which is shown in Figure 15a). Each of these pathways selectively ampliies part of the dynamic range of the rods, allowing rod-mediated signals to be effectively transmitted throughout the span of rod sensitivity (Bloomield & Dacheux, 2001; Volgyi, Deans, Paul, & Bloomield, 2004).
At very low scotopic levels, photons are few and rod light responses are very small (Baylor, Lamb, & Yau, 1979). Under these circumstances, high ampliication of rod responses is needed. The main route through which rod signals low from the outer to the inner retina at starlight is through rod BCs, AII ACs and cone-driven ON and OFF BCs, as explained in the previous section (Bloomield & Dacheux, 2001; Sharpe & Stockman, 2000; Taylor & Smith, 2004).
This pathway allows high sensitivity because all rod BCs use an mGluR to communicate with photoreceptors (Nakajima et al., 1993; Shiells, Falk, & Naghshineh, 1981; Slaughter & Miller, 1981). Since one single mGluR can activate multiple G protein molecules, this pathway ampliies the small rod responses to single-photon events (Falk, 1988; Shiells, 1994).
When light levels start to increase, so do rod light responses. Since rods and cones are electrically coupled (thick arrows in Figure 2a), when changes in the rod membrane potential are sizeable, part of this voltage will escape through the rod-cone gap junctions and modulate the cone glutamate release (DeVries & Baylor, 1995; Hornstein, Verweij, Li, & Schnapf, 2005; Schneeweis & Schnapf, 1995). Furthermore, rods also contact OFF “cone” BCs directly (Hack, Peichl, & Brandstatter, 1999; Tsukamoto, Morigiwa, Ueda, & Sterling, 2001; West, 1978). This way, even though the rod-rod BC synapse saturates at mesopic levels (Dacheux & Raviola, 1986), rod signals still can make it to the inner retina.
Cone signals, on the other hand, diverge to approximately 10 different BC types (Sterling, 2003; Wässle, 2004), whose functions and connectivity are not completely understood yet (Figure 10). This division of labor is necessary because in daylight the visual system is bombarded with a very large number of photons per unit area and time. Under these circumstances, the information contained in the cone responses exceeds the coding capacity of second-order neurons (Sterling, 2003). Each of these cone-driven information-processing channels carries presumably different parts of the message conveyed by the photoreceptors, in an attempt to optimally use the dynamic range and bandwidth of BCs, ACs and GCs.
In this manner, transmission channels with different
spatial iltering properties come to exist at the BC level: midget BCs pool from few cones, diffuse BCs pool from
many. Spectral iltering for color vision also starts at the cone-BC synapse: while the primate retina possesses only three types of cones with highly overlapping spectral sensitivities (Figure 8d), the decorrelation of photoreceptor signals starts by comparing signals from BCs that pool from all spectral types of cones, such as diffuse BCs, and by BCs that selectively contact only one cone type, like the mammalian blue cone BC (Mariani, 1984) and the foveal midget BCs (Kolb, 1970, 2003; Wässle, 2004; Wässle & Boycott, 1991).
Finally, multiple cone-driven transmission channels enable the temporal iltering of visual information, that is, the selective transmission of fast components of the visual stimulus through neurons that respond transiently and the slow luctuations through cells that respond in a more sustained manner to light. This is accomplished by a number of different strategies. One of them is to have different glutamate receptor conigurations at the Figure 17. Some possible modes of cross-talk between ON (grey) and OFF (white) channels in the IPL. Excitatory synapses are symbolized by the green arrows, inhibitory synapses by the red arrows. (A) Indirect convergence via ACs (I). Circuits involved in the generation of center responses of an ON GC. This neuron receives direct excitatory input from an ON BC and inhibitory input from an AC which, in turn, is driven by OFF BCs. (B) Indirect convergence via ACs (II). Circuits involved in the generation of center responses of an OFF GC. This neuron receives direct excitatory input from an OFF BC and inhibitory input from an AC which, in turn, is driven by ON BCs. (C) Direct convergence onto a GC. Circuits involved in the generation of center responses from
an ON-OFF GC. This neuron stratiies in both sublamina of
the IPL, where it receives direct excitatory inputs from ON and OFF BCs. (D) Direct convergence onto an ON-OFF AC.
This neuron stratiies in both sublamina of the IPL, where it
BC dendrites (Figure 16a). An iGluR, for example, is formed by the co-assembly of different subunits that confer distinct characteristics to the cation pore, such as ionic permeability and desensitization dynamics (DeVries, 2000; DeVries & Schwartz, 1999). The mGluR of ON BCs may also differ in its desensitization dynamics, although little is known about its intracellular cascade (Snellman, Kaur, Shen, & Nawy, 2008).
Another strategy that allows for temporal iltering is the position of the BC dendrites in the cone synaptic complex (Figure 16b). Cells whose dendrites extend deeper into the synaptic terminal tend to be more transient than those whose dendrites end farther from the synaptic release sites (DeVries, Li, & Saszik,
2006), because the glutamate concentration and its modulation at these two different sites vary. Together, these cone-driven processing channels “chop” the visual image into bits that can be eficiently transmitted along the optic nerve.
ON and OFF Channels
One may ask at this point: why are there ON and OFF cells in the irst place? A number of theories have been proposed. A possible reason is related to the discussion in the previous sections about the limited bandwidth of BCs and GCs. Since the HC-feedback system effectively subtracts background levels from the photoreceptor signal, this signal varies around a mean of Figure 18. Broadband and opponent coding. (A) Spectrally opponent mixed-input BCs of the carp retina. Spectral curves of 6 types of opponent BCs to stimulation with a small spot (dark symbols) or with an annulus (open symbols) of different wavelengths under diffuse background illumination. In these cells, center and surround responses do not have the same spectral sensitivity, and in some cases the surround is also spectrally opponent. Upper row: cells with hyperpolarizing (OFF) center responses to long wavelength stimuli. Bottom row: cells with depolarizing (ON) center responses to long wavelength stimulation. OFF-DO: double-opponent (OFF type); R-G+: hyperpolarizing to red light, depolarizing to green light; R-G+B-: hyperpolarizing to red and blue lights, depolarizing to green light; ON-DO: double-opponent (ON type); R+G-: depolarizing to red light, hyperpolarizing to green light; R+G-B+: depolarizing to red and blue lights, hyperpolarizing to green light. Reproduced with permission from Shimbo, Toyoda, Kondo and Kujiraoka (2000). (B) Light
responses of spectrally opponent primate GCs. Responses of a tonic GC of the rhesus monkey to stimulation with a 20 ield covering both the receptive ield center and surround. This neuron gives “ON” responses to long wavelength stimulation and “OFF” responses
to wavelengths shorter than 666 nm. From Gouras and Zrenner (1981), copyright 1981, with permission from Elsevier. (C) Response thresholds of two GCs of the rhesus monkey (black and white symbols) to stimulation with a 0.2o spot covering mostly the receptive
ield center and a small part of the surround (a) and to stimulation with an annulus of 0.5 i.d and 1 o.d. covering mostly the receptive ield surround and small part of the center (b). Circles and triangles represent responses of opposite polarity in the same cell. Adapted