Article
J. Braz. Chem. Soc., Vol. 22, No. 3, 489-500, 2011. Printed in Brazil - ©2011 Sociedade Brasileira de Química
0103 - 5053 $6.00+0.00
A
#Present address: CERMAV-CNRS, BP 53, 38041 Grenoble Cedex 9, France
*e-mail: [email protected]
Solution Properties of a Hydrophobically Associating Polyacrylamide and its
Polyelectrolyte Derivatives Determined by Light Scattering, Small Angle X-ray
Scattering and Viscometry
Ana M. S. Maia,a Marcos A. Villetti,b Rosangela R. L. Vidal,a Redouane Borsali#,c and
Rosangela C. Balaban*,a
aLAPET-Departamento de Química, Universidade Federal do Rio Grande do Norte, CP 1662, 59078-970 Natal-RN, Brazil
bLEPOL-Departamento de Fisica, Universidade Federal de Santa Maria, 97105-900 Santa Maria-RS, Brazil
cLCPO (UMR5629) ENSCPB – Université Bordeaux 1, 16 Avenue Pey Berland, 33607 Pessac Cedex, France
Uma poliacrilamida hidrofobicamente modiicada e dois dos seus derivados parcialmente hidrolisados, contendo grupos hidrofóbicos e carboxila, foram preparados por polimerização micelar e pós-hidrólise. A massa molar, o segundo coeiciente do virial e o raio de giração foram determinados por espalhamento de luz estático (SLS). O espalhamento de luz dinâmico (DLS) e o espalhamento de raios-X a baixos ângulos (SAXS) foram utilizados respectivamente para determinar a formação de agregados e o tipo de empacotamento das cadeias em regime semi-diluído. O comportamento das soluções, em regime diluído e semi-diluído foi estudado por viscosimetria e reologia. A poliacrilamida modiicada hidrofobicamente apresentou tendência à formação de agregados devido aos grupos hidrofóbicos, mas essa agregação não foi suiciente para aumentar a viscosidade aparente. Embora os derivados parcialmente hidrolisados não apresentassem a mesma tendência para agregação, eles apresentaram um comportamento anisotrópico devido à introdução de densidade de carga sobre a cadeia polimérica, a qual levou a uma conformação mais alongada da macromolécula e maior viscosidade.
A hydrophobically-modified polyacrylamide and two partially hydrolyzed derivatives containing hydrophobic and carboxylic groups were prepared by micellar polymerization and post-hydrolysis. The molecular weight, second virial coeficient and radius of gyration were determined by static light scattering (SLS). Dynamic light scattering (DLS) and small-angle X-ray scattering (SAXS) were employed to determine the aggregate formation and type of chain packing in the semidilute regime, respectively. The behavior of solutions in dilute and semidilute regimes was also studied by viscometry and rheology. The hydrophobically-modiied polyacrylamide showed a tendency to form aggregates due to the hydrophobic groups, but not enough to increase apparent viscosity. The partially hydrolyzed derivatives did not show the same aggregate-forming tendency. Rather, they exhibited anisotropic behavior, due to the charge density introduced into the polymer chain, which led to a more elongated macromolecular conformation and higher viscosity.
Keywords: hydrophobically-modiied polyacrylamide, partially hydrolyzed polyacrylamide,
DLS, SLS, SAXS, rheology
Introduction
Polyacrylamide polymers are widely used in oil and gas exploitation activities1 and most
acrylamide-based polymers used in these activities are partially hydrolyzed, resulting in the presence of carboxylic groups in the chain.2 These charged unit improves water
(HAPAM) and their partially hydrolyzed analogues are prospective candidates as thickeners or rheology modiiers for use in drilling luid formulations,3 reservoir
stimulation4 and tertiary oil recovery.5 Due to the
association of hydrophobe moieties in nanodomains, their aqueous solutions exhibit remarkable rheological properties and better stability with respect to salts than the unmodiied precursor, polyacrylamide (PAM)
and partially hydrolyzed polyacrylamide (HPAM).6
Nevertheless, the effect of charged groups introduced into the polyacrylamide backbone of HAPAM remains a matter of debate in the literature. To the best of our knowledge, few studies to date have investigated HAPAMs containing both hydrophobic units and sodium acrylate units.7-9
Thus, the technical relevance of hydrophobically-associating polyacrylamides created an early need for information on their solution behavior, including the dependence of radii of gyration Rg, hydrodynamic radii Rh and intrinsic viscosity on hydrolysis degree, salt and solvent quality. Since the charges of polyacrylamides applied in enhanced oil recovery (EOR) operations cannot all be screened to avoid loss of viscosity, they should be studied using solvents with low salt concentration. The aim of the present study was to characterize HAPAM containing both hydrophobic alkyl chains (C12) and carboxylic groups from the hydrolysis process. The samples were carefully characterized by several techniques, including 1H and 13C NMR spectroscopy, static and dynamic light scattering,
small-angle X-ray scattering, viscometry and rheometry.
Experimental
Materials
All solvents and reagents of the best grade available were used without additional puriication. Dihexylamine, acriloyl chloride and THF were obtained from Merck and acrylamide from Osvaldo Cruz Chemistry, Brazil. The synthesis and puriication methods used with hydrophobe
monomer N,N-dihexylacrylamide have been previously
reported.10
Polymerization procedure
The hydrophobically-modiied polyacrylamides were prepared by micellar copolymerization with sodium dodecyl sulfate (SDS), according to the literature.11,12 The
monomer concentration in the feed was kept at 3 wt.%, and the concentration of the initiator potassium persulfate (K2S2O8) was set to 0.9 wt.% with respect to the monomer feed. The reaction was carried out for 7 h. The polymers
were precipitated and dissolved repeatedly to remove the surfactant, residual initiator and monomers. They were then freeze-dried and stored in a dissecator.
Hydrolysis procedure
The polymers were hydrolyzed by NaOH in 0.1 mol L−1
NaCl aqueous solution (polymer and NaOH concentrations of 0.71% and 0.25 mol L−1, respectively) in a well-stirred
vessel and the temperature was controlled at 50 °C, for 10 and 30 min. The polymer code (PAHM-0, PAHM-21 or PAHM-25) refers to the degree of hydrolysis (0, 21 or 25%, respectively).
Experimental NMR determination
Hydrophobe incorporation and hydrolysis degree
were determined in 10% D2O/NaCl using 1H and
13C NMR spectroscopy.13,14 All spectra were recorded
on a Brucker 400 MHz spectrometer at 22 °C. 1H NMR
spectra were obtained at 400 MHz, while 13C NMR at
100 MHz. Experimental parameters included a minimum of 40,000 scans. Nuclear Overhauser enhancement (nOe) was suppressed by using inverse-gated decoupling. Longitudinal relaxation times were measured using the inversion recovery pulse sequence.
Refractive index increment (dn/dc)
The refractive indices of solvents (0.1 and 1.0 mol L−1 NaCl) and polymer solutions with concentrations
up to 5 mg mL−1 were measured using a laboratory-made
temperature-controlled refractometer at 632.8 nm and 25 °C. The refractive index increment (dn/dc) of each sample was obtained from the slope of a graph of the sample differential refractive index (∆n) vs. the sample
concentration. The ∆n value considered was the difference between the refractive index of the reference sample (toluene), n, and the refractive index of the polymer, no.
Static (SLS) and dynamic light scattering (DLS)
Milli-Q water was used for solvent preparation. All solvents were iltered through 0.1 µm cellulose acetate Millipore ilters. The polymer solutions were prepared by dissolution of a known amount of polymer in the appropriate solvent. After 96 h of stirring, the solutions were iltered through a 0.45 µm membrane. The concentration range of the polymer solutions was 0.2-2.0 g L−1. DLS and SLS
tau correlator and an He-Ne laser source operating at
λ = 632.8 nm (22 mW power).
For the DLS, the homodyne intensity correlation function G(2)(t) was measured within the range of
delay times from 10−4 to 105 ms. The normalized
homodyne intensity correlation function g(2)(t) is related
to the normalized electric ield time correlation function g(1)(t) by the Siegert relation15 g(2)(t) = 1+b|g(1)(t)|2where
g(2)(t) = G(2)(t)/G(2)(∞), G(2)(∞) is an experimentally
determined baseline, β is the optical coherence factor. In dilute solutions of monodisperse particles, electric ield correlation function is connected with translation diffusion D, as follows: g(1)(t) = exp(−t/τ) = exp(−Γt)
= exp(−Dq2t), the correlation functions were analyzed
through inverse Laplace transformation using the constrained regularization (CONTIN) method developed by Provencher,16 which gives the distribution function
of relaxation rates, Γ(=1/τ), and their corresponding amplitude for each polymer solution. The apparent translational diffusion coeficient (Dapp) of the single polymer chain was determined using the relation Dapp = Γ/q2. Extrapolation to q→0 and C→0 gives the
real diffusion coeficient (D). Within the dilute regime, D varies linearly with concentration in the relation D = D0(1 + kD.C +…) where D0 is the diffusion coeficient at ininite dilution and kD is the hydrodynamic virial coeficient. D0 is related to the hydrodynamic radius (Rh) in the Stokes-Eintein relation,17 D
0 = kb.T/6πηRh, where
kB is Boltzmann’s constant, T is absolute temperature and η is the solvent viscosity. The scattering angle θ was varied between 30 and 150°. Data points for static light scattering were taken at angles between 40 and 130°
at 25 °C. Zimm plots were constructed using software
provided by the manufacturers.
Small-angle X-ray scattering (SAXS)
Small-angle x-ray scattering was performed in D11A-SAXS2 at the Laboratório Nacional de Luz Síncrotron (LNLS, Campinas, São Paulo State, Brazil). A two-dimensional position-sensitive detector was used for the experiments, with a sample-detector distance of 1413.9 mm and monochromatic beam wavelength of 1.488 Å. Exposure time for each measurement was 600 s and scattering vector range was 0.009 < q(Å-1) < 0.23. A mica sample holder was
used for all samples and the sample cell was introduced into a vacuum chamber to decrease parasitic scattering. A thermal bath was used to maintain the temperature at 25 °C. Solvent scattering was subtracted from total intensity and the scattering proiles were corrected for sample absorption and detector response.
Viscometric measurements of dilute solutions
Viscometric properties of dilute polymer solutions were measured by an automatic Ubbelodhe capillary viscometer (diameter capillary 0.46 mm, Schott-Gerate), with automatic dilution (Tritonic T110), immersed in a water bath maintained at 25.0 ± 0.1 °C. Each concentration was measured ive times. All solutions were prepared according to the procedure described for light scattering experiments and iltered through 0.45 mm Millipore ilters.
Rheological measurements of semidilute polymer solutions
The steady shear rheological properties of polymer semidilute solutions were measured using an AR2000 rheometer from TA Instruments, equipped with a concentric cylinder system. The temperature was controlled with a Minichiller thermostatic bath from Huber and the
measurements were performed at 25, 35, 45 and 55 °C.
The curves were recorded in the controlled-stress mode.
Results and Discussion
NMR spectra
The 1H NMR and 13C NMR spectra were used to
determine hydrophobic content and hydrolysis degree of the polymers, respectively. Hydrophobic content was calculated from equation 1, considering the terminal methyl group peak area of the hydrophobe groups (d = 0.8-0.9 ppm) and the proton peak area of the CH group (d = 2.0-2.4 ppm) in the polymer backbone.
(1)
In equation 1, ICH3 is the integrating area of the protons in CH3 groups and ICH is the integrating area of the protons from CH groups in the polymer backbone.
According to Taylor and Nasr-El-Din,14 13C NMR
spectroscopy is the preferred method for accurately determining the degree of hydrolysis of polyacrylamide-based polymers. Hydrolysis degree was determined by equation 2, using the ratio between the integrated peak areas in the 44-46 and 41-44 ppm range, which corresponds to the carbons in the methylene acrylate groups (ICHCOO−) and acrylamide (ICHCONH2) units, respectively. All the results are listed in Table 1.
SLS and DLS analysis
Refractive index increments (dn/dc values) were obtained in 0.1 and 1.0 mol L−1 NaCl at 25 °C. Values for
dn/dc were very similar for the three polymers, as can be seen in Figure 1 and Table 2.
Static and dynamic light scattering results were obtained in 0.1 and 1.0 mol L−1 NaCl as solvents for the
copolymers in the dilute regime. Table 2 shows static and dynamic light scattering results for copolymers in 0.1 and 1.0 mol L−1 NaCl aqueous solutions. SLS with the standard
Zimm analysis was used to determine the weight-average molecular weights (Mw), the second virial coeficients (A2)
and radii of gyration (Rg).
The extrapolation of Kc/∆Rθ to q = 0 (equation 3) provides variations of the Mw, app parameter, the so-called apparent weight-average molecular weight against concentration:19
(Kc/∆Rθ)q = 0 = (Mw, app)−1 (3)
Figure 2 shows the evolution of Mw, app with polymer concentration in 0.1 mol L−1 NaCl for PAHM-0 and in 0.1
and 1.0 mol L−1 NaCl for both PAHM-21 and PAHM-25.
In 0.1 mol L−1 NaCl, Mw, app of hydrolyzed polymers
increased very sharply with dilution of the polymer solution, resulting in a positive second virial coeficient (Table 2), while Mw, app of PAHM-0 decreased slightly under identical experimental conditions, corresponding to a negative second virial coeficient (Table 2). Given that Mw, app values of hydrolyzed polymers decreased with the dilution when measured in 1.0 mol L−1 NaCl,
results obtained in 0.1 mol L−1 clearly indicate that charge
screening is not complete at this salt concentration. The
Mw and Rg for PAHM-21 and PAHM-25 in 0.1 mol L−1
NaCl was found by taking into account the experimental points in the lower range of the scattering angle because the Kc/∆Rθ curves for different concentration exhibited some curvature in the high angle range, indicating the existence of aggregation in the solution. The results are shown in Table 2 for comparison purposes.
Dynamic light scattering allowed the determination of diffusion coeficients (D0) (Figure 3), and the hydrodynamic radius of the polymer coil was determined from D0 using the Stokes-Einstein equation.20 Diffusion coeficients (D
0) Table 1. Hydrophobic content and hydrolysis degree of PAHM-0, PAHM-21
and PAHM-25 determined by 1H NMR and 13C NMR, respectively
Polymer Hydrophobic
content (mol %)
Hydrolysis degree (%)
PAHM-0 0.20
-PAHM-21 0.26 21
PAHM-25 0.25 25
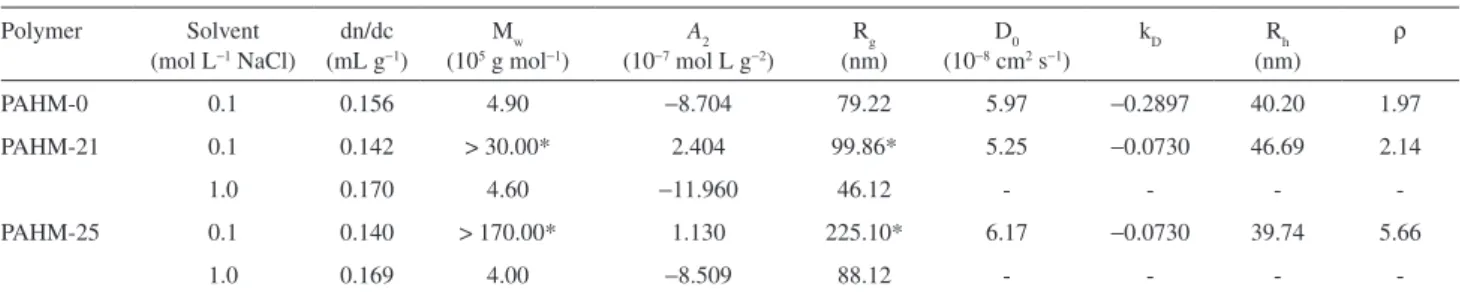
Table 2. Refractive index increment, molecular weight, second virial coeficient, radius of gyration, diffusion coeficient, hydrodynamic virial coeficient, hydrodynamic radius and shape sensitive ratio of PAHM-0, PAHM-21 and PAHM-25, as a function of salt concentration
Polymer Solvent
(mol L−1 NaCl)
dn/dc (mL g−1)
Mw (105 g mol−1)
A2 (10−7 mol L g−2)
Rg (nm)
D0 (10−8 cm2 s−1)
kD Rh
(nm)
ρ
PAHM-0 0.1 0.156 4.90 −8.704 79.22 5.97 −0.2897 40.20 1.97
PAHM-21 0.1 0.142 > 30.00* 2.404 99.86* 5.25 −0.0730 46.69 2.14
1.0 0.170 4.60 −11.960 46.12 - - -
-PAHM-25 0.1 0.140 > 170.00* 1.130 225.10* 6.17 −0.0730 39.74 5.66
1.0 0.169 4.00 −8.509 88.12 - - -
-*By taking into account the experimental points in the lower range of the scattering angle.
Figure 1. Dependence of PAHM-0, PAHM-21 and PAHM-25 solution refractive indices on polymer concentration; T = 25 °C, λ = 632.8 nm.
and hydrodynamic radii are shown in Table 2. PAHM-21 and PAHM-25 showed two relaxation modes, but only the data related to the fast mode are presented in this paper. The fast mode can be attributed to the free polymer chain and the slow mode to aggregates in solution. Values of D0 [(5.25−6.17) × 10−8 cm2 s−1] and R
h ((39.74-46.69) nm)
are very similar for all polymers. The relaxation time distributions for PAHM-0 are narrow, unimodal and approximately symmetrical, but broaden for PAHM-21 with the increase in polymer concentration. A slow mode was observed for both PAHM-21 and PAHM-25 at a decay time exceeding 10 ms. Relaxation time distributions of the polymers at 90° and four concentrations are shown in Figure 4.
The temperature effect on relaxation mode for PAHM-0,
PAHM-21 and PAHM-25 was studied at 2.0 g L−1 polymer
concentration in 0.1 mol L−1 NaCl. All the polymers studied
showed two relaxation modes between 25 and 55 °C (Figures 5 and 6). The fast mode is related to the free chains and the slow mode to the aggregates. Figure 5 shows that the hydrodynamic radii of the free chains (Rh1) of PAHM-0 in Milli-Q water remain practically invariable with temperature,
exhibiting values near 20 nm. However, the number of free chains of PAHM-0 in Milli-Q water decreases with heating, as shown by relatively intensity. The hydrodynamic radius of aggregates (Rh2) initially increases from 170 to 230 nm. In a second step, Rh2 decreases and the number of aggregates increase. With continuous heating, the number and size of aggregates decrease. When the solvent changed to 0.1 mol L−1 NaCl, a hydrophobic effect was observed and
at temperatures of 25, 35 and 55 °C, Rh1 no longer represents the free chains, but small aggregates. Another observation
Figure 4. Relaxation time distributions of PAHM-0, PAHM-21 and PAHM-25 in 0.1 mol L−1 NaCl.
Figure 3. Effective diffusion coeficient of PAHM-0, PAHM-21 and
PAHM-25 in 0.1 mol L−1 NaCl.
Figure 5. Normalized intensities and hydrodynamic radii as a function
is that Rh2 (larger aggregates) values increase continuously with heating while the number of large aggregates decreases and the number of small aggregates (Rh1) increases.
PAHM-21 and PAHM-25 behave completely differently. For PAHM-21, the size of Rh1 (free chains) does not change, but the number of free chains increases with temperature, while the number and the size of aggregates decrease. For PAHM-25, comparable behavior would be expected, because of the similar degree of hydrolysis for the two polymers. Nevertheless, the results depicted in Figure 5 show that the number and size of species (free chains and aggregates) in solution for PAHM-25 do not change signiicantly with temperature.
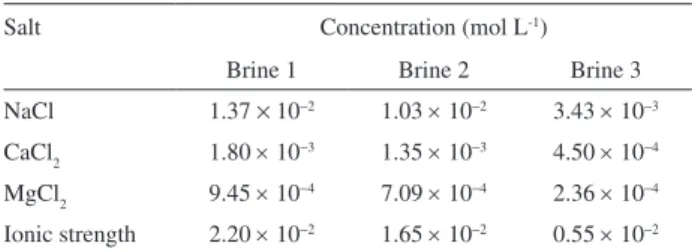
The hydrodynamic properties of all polymers were also characterized in different brines (Table 3) by light scattering and viscometry measurements. Brines 2 and 3 correspond to aqueous solutions containing 75 and 25% of the salts from brine 1, respectively. DLS results for polymers in brine 1 are shown in Figure 6. It can be observed that PAHM-0 exists only in the aggregate form. The smaller aggregates have a hydrodynamic radius of 50 nm, while the radius of the larger ones measures 300 nm. These results are similar to those of PAHM-0 in 0.1 mol L−1 NaCl. However,
the sizes are larger than those measured for PAHM-0 in water at 25 °C. In this case, the hydrodynamic radii (Rh1) indicate small aggregates, whereas Rh2 is related to larger ones. For the partially hydrolyzed polymers, there were no signiicant differences between the results obtained in 0.1 mol L−1 NaCl (ionic strength = 1 × 10⁻¹) and brine 1
(ionic strength = 2.2 × 10⁻²).
SAXS analysis
The polyelectrolyte character of PAHM-21 and PAHM-25 was investigated in a semidilute regime using small-angle x-ray scattering (SAXS) techniques. The presence of charges along polyelectrolyte chains signiicantly modiied their properties with respect to neutral
polymers (PAHM-0). For all salt free analysis of PAHM-21 and PAHM-25, solutions of polymer concentrations in the 5.0 to 20.0 g L−1 range showed scattering peaks whose
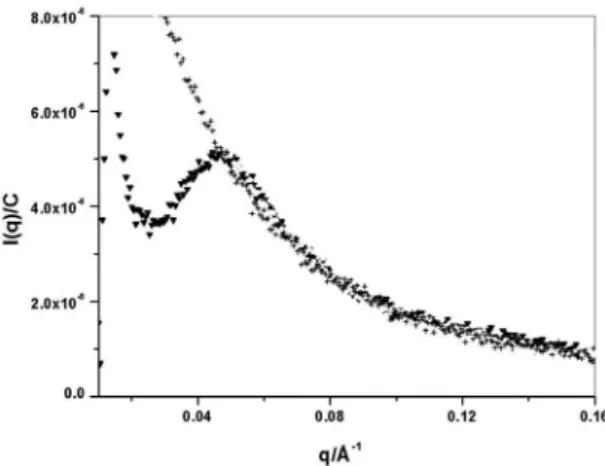
position depended directly on polymer concentration. Figure 7 illustrates this behavior, where I(q)/C is plotted
as a function of qfor hydrolyzed polymer PAHM-25. The
results show that the position of the scattering peak was displaced to high q values. According to Bragg’s equation, d = (2π/qmax); this means that the interparticle distance decreased with an increase in polymer concentration. These scattering peaks may be attributed to intermolecular ordering promoted by electrostatic repulsions between acrylate groups on the partially hydrolyzed polyacrylamide chains. For polyelectrolytes, these electrostatic interactions lead to pseudo-organized structures in dilute and semidilute regime with cubic (qmax ca. C1/3), cylindrical or hexagonal
packing (qmax ca. C1/2). Figure 8 shows the experimental
results of qmaxversus C and the theoretical prediction for
cubic packing of the PAHM-25 polymer calculated using equation 4, where NA is Avogadro’s number and Mw is the weight-average molecular weight. The maximum peak position (qmax), scales as C0.4.
(4)
Figure 7 also shows the behavior of the hydrophobically-modified polyacrylamide PAHM-0 at 20.0 g L−1. As
expected, no scattering peak was observed because this polymer is not charged (zero hydrolysis) in the chain. The I(q)/C ratio decreased with the increase in q value. This behavior is typical of neutral polymers in the q-SAXS range. These results clearly show a change in polymer conformation when it is hydrolyzed. PAHM-0 has an isotropic phase behavior because it has a coil conformation, while PAHM-25 and PAHM-21 show anisotropic behavior due to the more elongated conformation related to the charge density introduced into the polymer chain.
When salt is added to the PAHM-25 solution, the polyelectrolyte peak is screened (Figure 9). In the Odijk wormlike chain model, the polyelectrolyte behaves like
Figure 6. Normalized intensities and hydrodynamic radii for the fast and
slow modes for PAHM-0, PAHM-21 and PAHM-25 in brine1. Polymer concentration: 2.0 g L-1, T = 25 °C.
Table 3. Composition and ionic strength of the brines
Salt Concentration (mol L-1)
Brine 1 Brine 2 Brine 3
NaCl 1.37 × 10⁻² 1.03 × 10⁻² 3.43 × 10⁻³
CaCl2 1.80 × 10⁻³ 1.35 × 10⁻³ 4.50 × 10⁻⁴
MgCl2 9.45 × 10⁻⁴ 7.09 × 10⁻⁴ 2.36 × 10⁻⁴
an impenetrable sphere with radius of 2k−1 surrounding
the polyion, and Debye length of k−1.21 The addition
of an electrolyte, such as NaCl, changes k−1 due to the
effect of electrical double layer compression, thereby eliminating electrostatic interactions. Above a given ionic strength, electrostatic potential is not effective in inducing electrostatic repulsions between the chains at a given distance d. The ordered structure is substituted by a disordered coil-like chain, causing the system to behave like a neutral polymer.
Viscometry
Viscosity results in the dilute domain were obtained in brines containing different concentrations of NaCl, CaCl2 and MgCl2(Table 4). From the viscosity data in the linear regime, the linear regression correlation coeficient (CLR), intrinsic viscosity ([η]), coil overlap concentration (C*), the Huggins (kH), Kraemer (kK) and Martin (kM) coeficients as well as the concentration parameter (Cm)22,23 of the different
polymers, were calculated and reported in Tables 4 and 5.
The linear regression correlation coeficients (CLR) of different equations were used to evaluate the degree of linear itting. Table 4 gives the linear regression correlation coeficients of different equations. It can be observed that the Fedors equation resulted in the best linear itting, a inding also obtained by a number of authors.24
For PAHM-0, the [η] calculated using different equations did not change significantly with salt concentration. However, for the partially hydrolyzed polymers, the [η] decreased when salt concentration was increased, due to the existence of ionic groups, which, led to polymer chain contraction after screening.
Although the [η] of PAHM-0 did not change with salt concentration, kH was very sensitive to solvent quality (Table 5) altering from 0.3570 to 0.5784 and −0.1459 with an increase in salt concentration. This indicates that when salt concentration increases, the number of water molecules that solvate the polymer chains decreases. In accordance with the literature, the kM values were lower than those of kH .22
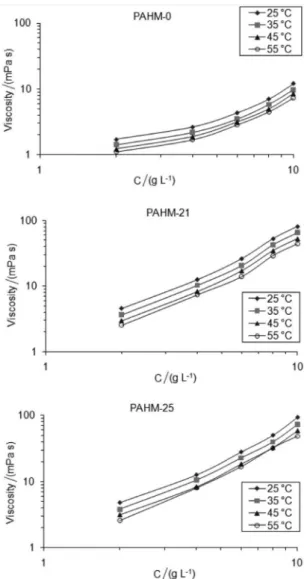
The dependence of apparent viscosity on polymer concentration in a semidilute regime, for PAHM in brine 1, is presented in Figures 10 and 11. Solution viscosity studies of copolymers as a function of polymer concentration in brine 1 indicate normal polyelectrolyte behavior, attributed to the partial reduction in electrostatic repulsions between carboxylate groups. Moreover, the increase in temperature leads to a decrease in viscosity, due to the Brownian motion increase, as shown in Figure 11.
Previous studies have conirmed the possibility of detecting the content of non-chromophore hydrophobic moieties as low as 0.9 mol % in hydrophobically-modiied water soluble polymers (HMWSPs), with careful
1H NMR characterization.12,25 Polymer compositions were
determined by 1H and 13C NMR, as previously discussed
under the conditions outlined in the experimental section.
Figure 8. qmax vs. Polymer concentration for PAHM-25: experimental results (•) and theoretical cubic model of packing (straight line). The dotted line is only a visual guide.
Figure 7. I(q)/C vs. q for PAHM-0 and PAHM-25 at different polymer concentration at T = 25 °C.
Figure 9. I(q)/C vs. q for PAHM-25 at 10.0 g L−1: salt free () and NaCl
Hydrophobic content in each polymer is consistent with feed composition (Table 1), and the post-hydrolysis process seems to be a more effective means of controlling the degree of hydrolysis.26
Static light scattering (SLS) measurements using standard Zimm analysis can provide information about properties such as molecular weight (Mw), radius of gyration (Rg) and second virial coeficient (A2) for polymers
in the dilute regime. The basic relation for static light scattering is
(5)
where is an optical contrast factor
and q is the magnitude of the scattering vector |q| = (4πn0/λ0)sin(θ/2), with NA, n0 and λ0 representing Avogadro’s number, the solvent refractive index, and the wavelength of the light in a vacuum, respectively; c is the polymer concentration, and ∆Rθ is the excess
absolute time-averaged light scattering intensity (excess Rayleigh ratio). In order to obtain ∆Rθ, the solvent scattered intensity is subtracted from the polymer solution intensity. A2 refers to the second virial coeficient. Light
scattering characterization of high molecular weight PAM in water is considered dificult, due to its tendency to form aggregates.19 Molecular weight determination requires
inding a solvent in which the copolymer is molecularly dispersed, i.e., where supramolecular aggregates are absent.
Due to the high polarity of the amide groups, few solvents are known to contain polyacrylamide; among these are water, formamide, ethylene glycol and morpholine.27
Even in these solvents, hydrophobic groups in HMPAM solutions could induce aggregation, which would lead to inaccurate molecular weight measurements. Additionally, the conformation of a single hydrophobically-modiied coil in the dilute regime is more compact than the unmodiied water soluble coil, due to intramolecular hydrophobic interactions. Thus, the viscosity-average molecular weight values could be underestimated.28 Characterization of
hydrophobic polyacrylamide (HMPAM) by static light scattering has been performed by a number of authors using different solvents or solvent mixtures, depending on hydrophobic comonomer and composition. Solvents
Table 4. Intrinsic viscosity and overlap concentration results of PAHM-0, PAHM-21 and PAHM-25 in aqueous salt solutions, at T = 25 °C
Polymer Solvent CLR [η] (dL g−1) C* (g dL−1)
Huggins Kraemer Martin Fedors Huggins Kraemer Martin Fedors Huggins Kraemer Martin Fedors
PAHM-0 Brine 1 0.1719 0.6647 0.1764 0.9987 3.3970 3.3646 3.3970 3.2414 0.2943 0.2972 0.2943 0.3085
Brine 2 0.9240 0.0114 0.9128 0.9999 3.0962 3.1070 3.1009 3.0441 0.3229 0.3218 0.3224 0.3285
Brine 3 0.7160 0.4552 0.7170 0.9996 2.9028 2.9165 2.9060 2.9308 0.3444 0.3428 0.3441 0.3412
PAHM-21 Brine 1 0.9752 0.9156 0.9759 0.9998 11.4900 11.5020 11.5340 11.5606 0.0870 0.0869 0.0867 0.0865
Brine 2 0.9939 0.9144 0.9908 0.9993 11.0740 11.3830 11.4741 11.4942 0.0903 0.0878 0.0871 0.0870
Brine 3 0.9545 0.2164 0.9485 0.9998 16.6360 17.1210 17.1517 16.7504 0.0601 0.0584 0.0583 0.0597
PAHM-25 Brine 1 0.9721 0.4620 0.9633 0.9999 8.3658 8.4512 8.4283 8.3125 0.1195 0.1183 0.1186 0.1203
Brine 2 0.5584 0.0555 0.5614 0.9955 11.5460 12.4505 12.1885 13.3868 0.0861 0.0803 0.0820 0.0747
Brine 3 0.9554 0.7874 0.9886 0.9999 13.0420 14.5609 14.2349 14.6627 0.0766 0.0686 0.0702 0.0682
Table 5. Viscometric constants calculated for copolymers in aqueous salt solutions, at T = 25 °C
Polymer Solvent kH kK kM Cm
PAHM-0 Brine 1 −0.1459 0.5100 −0.1512 16.49
Brine 2 0.5784 −0.0167 0.5369 0.62
Brine 3 0.3534 0.1714 0.3331 12.21
PAHM-21 Brine 1 0.3570 0.1492 0.3200 1.36
Brine 2 0.5579 0.0817 0.3877 0.63
Brine 3 0.6557 0.0408 0.4672 0.25
PAHM-25 Brine 1 0.7666 −0.1183 0.6567 0.27
Brine 2 0.7712 0.0705 0.4675 −4.08
Brine 3 1.2637 −0.0734 0.6895 0.23
employed in the past include: formamide,29 NaCl/water30
and NaNO3/water/acetononitrile mixtures.9
No signiicant differences were observed between the Mw determined for PAHM-0 in 0.1 mol L−1 NaCl and
PAHM-21 and PAHM-25 in 1.0 mol L−1 NaCl (see Table 2).
Therefore, a meaningful comparison of their rheological behaviors can be made. The slight decrease in molecular weight may be related to the conversion of a portion of amide groups to carboxylate groups by hydrolysis, as well as to the small number of hydrophobic groups and, consequently, their synthesis conditions. The A2 negative
value of copolymer PAHM-0 (−8.704 × 10⁻⁷ mol L g−2)
indicates that the polymer is not well solvated, even in 0.1 mol L−1 NaCl, due to the presence of hydrophobic
groups along the polymer chains. The A2 positive values
for polymers PAHM-21 and PAHM-25 in 0.1 mol L−1 NaCl
(2.404 × 10⁻⁷ and 1.130 × 10⁻⁷ mol L g−2, respectively)
were obtained only for comparison purposes. The results
indicate that the introduction of charged groups increases interaction with the polar solvent, reducing intramolecular hydrophobic associations. In 0.1 mol L−1 NaCl, the charges
on hydrolyzed samples are not completely screened and the expanded coil results in overestimated molecular weights (> 3 × 10⁶ g mol−1). When NaCl concentration is increased
to 1.0 mol L−1, carboxylate group charges are screened,
allowing the formation of intramolecular hydrophobic associations, which are inferred from negative A2 values.
For PHAM-21 and PHAM-25, the Rg values are consistent
with A2 data. Increasing salt concentration decreases
polymer size, indicating that negative charges present in partially hydrolyzed polymers were completely screened in 1.0 mol L−1 NaCl. This effect favored an increase in
interactions among hydrophobic groups owing to reduced solvent quality. The more collapsed state observed for PAHM-21 in 1.0 mol L−1 NaCl corresponded to the lowest
values of A2 and Rg, but not to the lowest Mw, because this
polymer shows larger Mw than PAHM-25. It is important
to point out that since these polymers were obtained by separate synthesis reactions, there is no direct relation among Mw values.
The magnitude of the diffusion coefficients and hydrodynamic radius corroborated the SLS data, indicating that in 0.1 mol L−1 NaCl, PAHM-0 is a random
coil and PAHM-21 and PAHM-25 are in an extended conformation, as can be inferred from shape factor values of 1.97, 2.14 and 5.66, respectively (Table 2). The hydrodynamic virial coefficient values and the curves in Figure 3 indicate intramolecular hydrophobic aggregation/bad polymer solvent interaction for PAHM-0 in 0.1 mol L−1 NaCl, while the samples of PAHM-21 and
PAHM-25 are less sensitive to this salt concentration. This behavior shows that low salt concentration is not suficient to promote aggregate formation in the partially hydrolyzed polymers. This occurred because the charges in the hydrolyzed samples were not completely screened and, in fact, the presence of the negative groups hindered interactions among the hydrophobic groups. In this case, the effect of electrostatic repulsions prevails over that of hydrophobic interactions. This result is in agreement with positive A2 values obtained by SLS for the partially
hydrolyzed polymers.
When the polymers are analyzed by DLS at a higher concentration than C*, two relaxation modes are observed (Figures 5 and 6). A comparison of the results for PAHM-0 in Milli-Q water and 0.1 mol L−1 NaCl reinforces SLS data
in the dilute regime (Table 2), indicating that 0.1 mol L−1
NaCl is not a good solvent for this polymer, since it induces hydrophobic aggregation and accounts for the increase in Rh1 and Rh2.
The results in Figure 5 also show that a rise in temperature increases Rh2 values, probably because hydrophobic aggregation is an endothermic process, while hydration of the hydrophobic groups is an exothermic process.14,31 Therefore, interactions between the polymer
chains are favored with a temperature increase, up to a certain limit.
It is well documented that polyelectrolyte solutions show a peak in light, small-angle X-ray or neutron scattering experiments.32 The SAXS results showed that the
higher hydrodynamic volume of PAHM-21 and PAHM-25, compared to PAHM-0, may be related to higher viscosity in the partially hydrolyzed polyacrylamide. The existence of an upturn in scattered intensity over a small q range (see Figure 7) has been attributed to the slow relaxation mode observed in polyelectrolyte solutions by dynamic light scattering.33 Interestingly, no peak was observed in
SAXS at a salt concentration of 5.0 × 10⁻² mol L−1 NaCl
(Figure 9), indicating that the chains do not exhibit more organized packing. The SLS and DLS suggested the presence of unscreened sites, which would be responsible for the highest PAHM-25 hydrodynamic volume in 0.1 mol L−1 NaCl.
After measuring relative viscosity (ηr), the viscometric data of polymer solutions in different brines were linearized by different equations. The linear regression correlation coeficients (CLR) of different equations were used to evaluate the degree of linear itting. Table 4 shows the linear regression correlation coeficients of different equations for PAHM-0, PAHM-21 and PAHM-25 reduced (Huggins), inherent (Kraemer), speciic (Martin) and relative (Fedors) viscosities as a function of polymer concentration in different brines. As can be seen in Table 4, the Fedors equation resulted in the best degree of linear itting. The intrinsic viscosities calculated by different equations are also listed in Table 4. The results showed that although the CLR of different equations were different, the intrinsic viscosity values calculated from different equations were similar. Considering that the best fitting results were observed with the Fedors equation, the [η]Fedors should be used to describe the behavior of macromolecular chains. Furthermore, there is no signiicant difference in [η]Fedors values for PAHM-0 in brines of different ionic strength, due to the absence of charged groups in the backbone. However, for the partially hydrolyzed polymers, [η]Fedors values increased with decreasing ionic strength, the effect being more pronounced for the polymer with the highest degree of hydrolysis (PAHM-25). This result shows that at low ionic strength polymers PAMH-21 and PAMH-25 has a more elongated coniguration.
The presence of charged units in hydrolyzed polymers
improves water solubility and increases hydrodynamic volume of the chains due to mutual repulsion of the negative charges. Viscometric properties of polymer solutions in the semi-diluted regime have been extensively used to gain insight into the structure and conformation of polymers in solution. The curves in Figure 10 exhibit the following distinctive features in brine 1 (larger ionic strength (2.20 × 10⁻²)): (i) viscosity increased
with increasing polymer concentration for all polymers; (ii) the concentration range in which the partially
hydrolyzed polymer viscosity sharply increases shifts towards smaller concentrations than with PAHM-0. To compare the behavior of such samples, the molar fraction of hydrophobic moieties and the degree of hydrolysis must be considered. PAMH-21 and PAMH-25 have similar viscosimetric behavior in brine 1 (low ionic strength) because they have similar hydrophobic content but higher thickening capacity than PAHM-0, due to the carboxylic groups in hydrolyzed polymers. Considering that the samples obtained in this study have a random distribution of hydrophobe units owing to the hydrophobe-to-surfactant ratio in the feed,28 it was shown that the
enhancement in viscosity was different from that shown by Zhu et al.34 This occurred because, even though the
hydrolysis degree of the samples in both studies is very similar, the hydrophobic content is different. The strong increase in the viscosity of HAPAM aqueous solutions above a given concentration threshold is exploited in a variety of practical applications and is of great interest in enhanced oil recovery.
Physicochemical parameters in dilute solutions showed that the samples studied in this study exert two opposite effects simultaneously: hydrophobic aggregation and Coulombic repulsion. In the dilute regime, the former leads to intramolecular association, which decrease the hydrodynamic volume of the polymer, while the latter expands polymer coils and in turn hydrodynamic volume. The addition of salt can screen out the polyelectrolyte effect, thereby enhancing the intramolecular hydrophobic association. Moreover, both the intramolecular and intermolecular association occur in a semi-dilute regime.
Temperature effects on the rheology of the copolymers solutions were investigated by measuring apparent viscosity as a function of polymer concentration at constant shear rate (7.3 s−1) in brine 1 (Figure 11). In all cases, apparent
Conclusions
The results obtained here indicate that the non-hydrolyzed polymer PAHM-0 is more sensitive to salt than hydrolyzed polymers, forming aggregates at lower salt concentrations than PAHM-21 and PAHM-25. In the case of partially hydrolyzed polymers, the repulsion between the carboxylic groups hinders the formation of hydrophobic aggregates. Due to the higher hydrophobicity of PAHM-0 compared to partially hydrolyzed derivatives, the former showed an increase in the number and size of aggregates with an increase in temperature, a inding not observed for PAHM-21 and PAHM-25. However, this aggregation did not increase the apparent viscosity of this sample to the apparent viscosity level of PAHM-21 and PAHM-25. The SAXS results showed that PAHM-21 and PAHM-25 polymers exhibit anisotropic domains of locally ordered chains and, consequently, high electrostatic persistence length, which may explain the higher viscosity of the partially hydrolyzed polyacrylamide compared to PAHM-0.
Acknowledgments
The authors are grateful to FINEP-CTPETRO, PETROBRAS, PRH-ANP/MCT and CAPES for inancial support. The authors also thank ABTLuS for the use of LNLS facilities (Project D11A - SAXS1 # 7660/08) in Campinas, Brazil.
References
1. Pritchett, J.; Frampton, H.; Brinkman, J.; Cheung, S.; Morgan, J.; Chang, K. T.; Williams, D.; Goodgame, J.; Paper SPE 84897 presented at the SPE International Improved Oil Recovery
Conference in Asia Paciic, Kuala Lumpur, Malaysia, 2003, http://www.onepetro.org/mslib/app/Preview.do?paperNumb er=00084897&societyCode=SPE; Frampton, H.; Morgan, J. C.; Cheung, S. K.; Munson, L.; Chang, K. T.; Williams, D.; Paper SPE 89391 presented at the 2004 SPE/DOE Fourteenth
Symposium on Improved Oil Recovery, Tulsa, USA, 2004, http:// www.onepetro.org/mslib/app/Preview.do?paperNumber=000 89391&societyCode=SPE; Melo, M. A.; Holleben, C. R. C.; Silva, I. P. G.; Correia, A. B.; Silva, G. A.; Rosa, A. J.; Lins, A. G.; Lima, J. C.; Paper SPE 94898 presented at the SPE Latin America and Caribbean Petroleum Engineering Conference, Rio de Janeiro, Brazil, 2005, http://www.onepetro.org/mslib/ app/Preview.do?paperNumber=SPE94898MS&societyCode =SPE; Paktinat, J.; Pinkhouse, J. A.; Johnson, N.; Williams, C.; Lash, G. G.; Penny, G. S.; Goff, D. A.; Paper SPE 104306 presented at the 2006 SPE Eastern Regional Meeting, Canton, USA, 2006, http://www.onepetro.org/mslib/app/Preview.do?
paperNumber=SPE104306MS&societyCode=SPE; Yañez, P. A. P.; Mustoni, J. L; Relling, M. F.; Chang, K. T.; Hopkinson, P.; Frampton, H.; Paper SPE 107923 presented at the 2007 SPE Latin America and Caribbean Petroleum Engineering
Conference, Buenos Aires, Argentina, 2007, http://www. onepetro.org/mslib/app/Preview.do?paperNumber=SPE1079 23MS&societyCode=SPE
2. Needham, R. B.; Doe, P. H.; J. Pet. Technol.1987, 39, 1503; Zheng, C. G.; Gall, B. L.; Gao, H. W.; Miller, A. E.; Bryant, R. S.; Paper SPE 39632 presented at the 1998 SPE/DOE Improved Oil Recovery Symposium, Tulsa, USA, 1998, http:// www.onepetro.org/mslib/app/Preview.do?paperNumber=0003 9632&societyCode=SPE; Melo, M. A.; Silva, I. P. G.; Godoy, G. M. R.; Sanmartim, A. A. N.; Paper SPE 75194 presented at the SPE/DOE Thirteenth Symposium on Improved Oil
Recovery, Tulsa, USA, 2002, http://www.onepetro.org/mslib/ app/Preview.do?paperNumber=00075194&societyCode=SPE; Martins, A. L.; Massarani G.; Waldmann, A. T. A.; Costa, F. G.; Paper SPE 82275 presented at the SPE European Formation
Damage Conference, Hague, The Netherlands, 2003, http:// www.onepetro.org/mslib/app/Preview.do?paperNumber=0008 2275&societyCode=SPE; Du, Y.; Guan, L.; Paper SPE 91787 presented at the 2004 SPE International Petroleum Conference
in Mexico, Puebla, Mexico, 2004, http://www.onepetro.org/ mslib/app/Preview.do?paperNumber=00091787&societyCod e=SPE
3. Rodrigues, J. A.; Lachter, E. R.; Sá, C. H.; Mello, M.; Nascimento, R. S. V.; Paper SPE 106527-STU (Student 11) presented at the 2006 SPE international Student Paper Contest at the SPE Annual
Technical Conference and Exhibition, San Antonio, USA, 2006, http://www.onepetro.org/mslib/app/Preview.do?paperNumber=S PE106527STU&societyCode=SPE
4. Dalrymple, D.; Eoff, L.; Everett, D.; Paper SPE 114557 presented at the 2008 SPE Tight Gas Completions Conference, San Antonio, USA, 2008, http://www.onepetro.org/mslib/app/ Preview.do?paperNumber=SPE114557MS&societyCode=SPE 5. Taylor, K. C.; Nasr-El-Din, H. A.; J. Pet. Sci. Eng.1998, 19, 265; Ranjbar, M.; Schafie, M.; J. Pet. Sci. Eng.2000, 26, 133; Niu, Y.; Ouyang, J.; Zhu, Z.; Wang, G.; Sun, G.; Shi, L.; Paper SPE 65378 presented at the 2001 SPE International Symposium
on Oilfield Chemistry, Houston, USA, 2001, http://www. onepetro.org/mslib/app/Preview.do?paperNumber=00065378 &societyCode=SPE; Eoff, L.; Dalrymple, D.; Reddy, B. R.; Morgan, J.; Frampton, H.; Paper SPE 80206 presented at the SPE International Symposium on Oilield Chemistry, Houston, 2003, http://www.onepetro.org/mslib/app/Preview.do?paperNu mber=00080206&societyCode=SPE
6. Gao, B.; Guo, H.; Wang, J.; Zhang, Y.; Macromolecules 2008,
41, 2890; Dai, Y.; Wu, F.; Li, M.; Wang, E.; Front. Mater. Sci.
China2008, 2, 113; Maia, A. M. S.; Borsali, R.; Balaban, R. C.;
SPE 29007 presented at the SPE International Symposium
on Oilield Chemistry, San Antonio, USA, 1995, http://www. onepetro.org/mslib/app/Preview.do?paperNumber=00029007 &societyCode=SPE
7. McCormick, C. L.; Middleton, J. C.; Cummins, D. F.; Macromolecules1992, 25, 1201; Branham, K. D.; Shafer, G. S.; Hoyle, C. E.; McCormick, C. L.; Macromolecules1995, 28, 6175; . Feng, Y.; Billon, L.; Grassl, B.; Khoukh, A.; François, J.; Polymer2002, 43, 2055; Feng, Y.; Grassl, B.; Billon, L.; Khoukh, A.; François, J.; Polym. Int. 2002, 51, 939.
8. Biggs, S.; Selb, J.; Candau, F.; Polymer1993, 34, 580. 9. Blagodatskikh, I. V.; Vasil’eva, O. V.; Ivanova, E. M.; Bykov,
S. V.; Churochkina, N. A.; Pryakhina, T. A.; Smirnov, V. A.; Philippova, O. E.; Khokhlov, A. R.; Polymer2004, 45, 5897. 10. McCormick, C. L.; Nonaka, T.; Johnson, C. B.; Polymer1988,
29, 731; Maia, A. M. S.; Costa, M.; Borsali, R.; Garcia, R. B.;
Macromol. Symp.2005, 229, 217.
11. Biggs, S.; Hill, A.; Selb, J.; Candau, F.; J. Phys. Chem.1992,
96, 1505; Hill, A.; Candau, F.; Selb, J.; Macromolecules1993,
26, 4521; Camail, M.; Margaillan, A.; Martin, I.; Papailhou, A.; Vernet, J. L.; Eur. Polym. J.2000, 36, 1853.
12. Candau, F.; Selb, J.; Adv. Colloid Interface Sci.1999, 79, 149. 13. Zurimendi, J. A.; Guerrero, S. J.; Leon, V.; Polymer1984, 25, 1314; Maurer, J. J.; Harvey, G. D.; Klemann, L. P. In Water-Soluble Polymer for Petroleum Recovery, Stahl, G. A.; Schulz, D. N., eds.; Plenum Press: New York, 1988; Moradi-Araghi, A.; Hsieh, E. T.; Westerman, I. J.; In Water-Soluble Polymer for Petroleum Recovery, Stahl, G. A.; Schulz, D. N., eds.; Plenum Press: New York, 1988.
14. Taylor, K. C.; Nasr-El-Din, H. A; J. Pet. Sci. Eng.1994, 12, 9. 15. Siergert, A.J. MIT Rad. Lab. Rap.1943, 465; Chu, B. In
Laser Light Scattering: Application of Photon Correlation
Spectroscopy; Academic Press: London, 1991.
16. Provencher, S.W.; Comput. Phys. Commun. 1982, 27, 213; Provencher, S.W.; Comput. Phys. Commun. 1982, 27, 229. 17. Pecora, R. Dynamic Light Scattering: Applications of Photon
Correlation Spectroscopy, 1st ed.; Plenum Press: New York, 1985.
18. Lucas, E. F.; Soares, B. G.; Monteiro, E.; In Caracterização de Polímeros–Determinação de Peso Molecular e Análise Térmica; E-papers Serviços Editoriais, 2001.
19. Feng, Y.; Billon, L.; Grassl, B.; Bastiat, G.; Borisov, O.; François, J.; Polymer2005, 46, 9283.
20. Schweins, R.; Hollmann, J.; Hube, K.; Polymer2003, 44, 7131. 21. Odijik, T.; Houwaart, A. C.; J. Polym. Sci., Part B : Polym. Phys.
1978,16, 627.
22. Durand, A.; Eur. Polym. J.2007, 43, 1744.
23. Dragan, S.; Ghimici, L.; Polymer2001, 42, 2887; Ghimici, L.; Popescu, F.; Eur. Polym. J.1998, 34, 13; Mello, I. L.; Delpech, M. C.; Coutinho, F. M. B.; Albino, F. F. M.; J. Braz. Chem. Soc.
2006, 17, 194; Mello, I. L.; Delpech, M. C.; Coutinho, F. M. B.; Albino, F. F. M.; Santos, S. M.; Polym. Bull.2005, 55, 115. 24. Ma, J.; Liang, B.; Cui, P.; Dai, H.; Huang, R.; Polymer2003,
44, 1281.
25. Volpert, E.; Selb, J.; Candau, F.; Macromolecules1996,29, 1452.
26. Truong, N. D.; Galin, J. C.; François, J.; Pham, Q. T.; Polymer
1986, 27, 459.
27. Kurenkov, V. F. In Handbook of Enginnering Polymeric Materials; Cheremisinoff, N. P. ed.; Marcel Dekker Inc.: New York, 1997, ch 3.
28. Volpert, E.; Selb, J.; Candau, F.; Polymer1998, 39, 1025. 29. Jiménez-Regalado, E.; Cadenas-Pliego, G.; Pérez-Álvarez, M.;
Hernández-Valdez, Y.; Polymer 2004, 45, 1993.
30. Golveia, L. M.; Paillet, S.; Khoukh, A.; Grassl, B.; Müller, A.; Colloids Surf., A2008, 322, 211.
31. Desbrières, J.; Polymer2004, 45, 3285; Ma, J.; Cui, P.; Zhao, L.; Huang, R.; Eur. Polym. J.2002, 38, 1627.
32. Villetti, M.; Borsali, R.; Diat, O.; Soldi, V.; Fukada, K.; Macromolecules2000, 33, 9418.
33. Borsali, R.; Nguyen, H.; Pecora, R.; Macromolecules 1998, 31, 1548; Ermi, B. D.; Amis, E. J.; Macromolecules1998, 31, 7378.
34. Zhu, Z.; Jian, O.; Paillet, S.; Desbrières, J.; Grassl, B.; Eur. Polym. J.2007, 43, 824.
Submitted: June 22, 2010