Article
Printed in Brazil - ©2017 Sociedade Brasileira de Química 0103 - 5053 $6.00+0.00
*e-mail: [email protected]
Improved NADH Electroanalysis on Nickel(II) Phthalocyanine Tetrasulfonic Acid/
Calf Thymus Deoxyribonucleic Acid/Reduced Graphene Oxide Composite
Izabela Aparecida L. Ribeiro,a Sakae Yotsumoto-Neto,b Wallans T. P. dos Santos,c
Ridvan N. Fernandes,b Marilia O. F. Goulart,d Flavio S. Damosb and Rita de Cássia S. Luz*,b
aDepartamento de Química, Universidade Federal dos Vales do Jequitinhonha e Mucuri,
Rodovia MGT 367, km 583, 39100-000 Diamantina-MG, Brazil
bDepartamento de Química, Universidade Federal do Maranhão, 65080-805 São Luís-MA, Brazil
cDepartamento de Farmácia, Universidade Federal dos Vales do Jequitinhonha e Mucuri,
Rodovia MGT 367, km 583, 39100-000 Diamantina-MG, Brazil
dInstituto de Química e Biotecnologia, Universidade Federal de Alagoas,
Av. Lourival Melo Mota, s/n, Cidade Universitária, 57072-900 Maceió-AL, Brazil
This work describes the electrochemical performance of a novel composite based on nickel tetrasulfonated phthalocyanine (NiTsPc), deoxyribonucleic acid from calf thymus (CT-DNA) and reduced graphene oxide (rGO) for the electroanalysis of reduced β-nicotinamide adenine dinucleotide (NADH), through electrocatalytic oxidation. The modified electrode was denoted as CT-DNA/NiTsPc/rGO. Fourier transform infrared and ultraviolet-visible spectroscopies were performed to characterize the composite material. The electrochemical performance of the composite for NADH oxidation was investigated by cyclic voltammetry (CV), chronoamperometry and differential pulse voltammetry (DPV). The CT-DNA/NiTsPc/rGO modified glassy carbon electrode (GCE) showed an excellent electrocatalytic activity for NADH oxidation with apparent electrocatalytic rate constant (kobs) of 7.35 × 10⁵ L mol-1 s-1 and linear response range for
NADH from 1 up to 1350 µmol L-1 for n = 12 (r = 0.999). The proposed sensor shows sensitivity,
detection limit and quantification limit of 0.014 µA L mol-1, 0.3 and 1 µmol L-1, respectively. The
prepared sensor was further tested for the determination of NADH in artificial human urine samples, showing promising biomedical applications.
Keywords: reduced graphene oxide, CT-DNA, nickel tetrasulfonated phthalocyanine, NADH, electroanalysis, sensor
Introduction
β-Nicotinamide adenine dinucleotide in its reduced
(NADH) or oxidized form (NAD+) are ubiquitous
biomolecules found in both eukaryotic and prokaryotic organisms. They are coenzymes of great importance in hundreds of natural reactions catalyzed by dehydrogenases.1
NADH levels are related to cell proliferation, sickle cell disease, tumor development, neoplasia and ischemia as well as several brain diseases.2
Thereby, the electrochemical oxidation of NADH has attracted special attention of many research groups in the field of biosensors development.3 In this sense, several
methods have been proposed for NADH determination
including fluorometric,4 high performance liquid
chromatography (HPLC),5 optical,6 photoelectrochemical,7
electrophoretic8 and electrochemical ones.9 However, even
if chromatographic as well as spectrometric techniques perform better than electrochemistry in terms of selectivity, both require numerous steps, analytical purity reagents, making such analyses very laborious and high cost.
Nowadays, graphene-based materials have been recognized as a very promising nanomaterial for the development of electrochemical sensors since they show interesting properties including high electrical conductivity, excellent thermal and mechanical properties, susceptibility to chemical modification,13 and large surface-to-volume
ratio.14-16 However, the applications of graphene as
platform to the development of sensors is limited by two main aspects, namely: (i) some forms of graphene present low reactivity and cannot be easily dispersed in many solvents17 and (ii) they show low ability to promote low
potential oxidation of several molecules.18 In this sense,
two approaches have been suggested to circumvent the limitations in graphene-based materials applications in development of platforms for sensors. The first is based on the use of dispersing agents, such as polymers, biopolymers or surfactants. Among the various biomolecules, DNA has emerged as an interesting alternative to the construction of sets of nanomaterials. The interactions of specific pairing sequence between the complementary chains of DNA may act as a dispersant agent improving the dispersity of the graphene in aqueous medium.19 In this sense, DNA can
protect the graphene from possible degradations ensuring chemical and thermal stability to the composite material.20-22
The second approach to improve graphene electrocatalytic properties is related to the use of molecules with high electrocatalytic capability such as metalo-N4-macrocyclic compounds such as phthalocyanines.23 Thus, we have
investigated the interaction of a nickel tetrasulfonated phthalocyanine (NiTsPc) with calf thymus DNA (CT-DNA) and graphene.
The nickel phthalocyanine was chosen because these macromolecules are capable to electrocatalyzing several redox reactions, with minimal reorganization energy, and may act as mediators in electrochemical reactions.24 In
addition, these molecular catalysts show high chemical, mechanical and thermal stability,25 and they can adsorb on
the surface of graphene without disturbing its electronic configuration.26,27
In this sense, the present work reports the development of an electrochemical sensor as a novel and efficient alternative for NADH oxidation and electroanalysis with a wide linear response range at low overpotential using as mediator the hybrid material CT-DNA/NiTsPc/rGO.
Experimental
Reagents and solutions
NADH, deoxyribonucleic acid from calf thymus (CT-DNA), graphite oxide, nickel tetrasulfonated
phthalocyanine, hydrazine sulfate and 4-(2-hydroxyethyl) piperazine-1-ethanesulfonic acid (HEPES) were purchased from Sigma-Aldrich. Tris (hydroxymethyl) aminomethane (Tris), hydrochloric acid, acetic acid, boric acid, phosphoric acid, sodium perchlorate and sodium hydroxide were purchased from Vetec Fine Chemicals, Rio de Janeiro, Brazil. Dibasic anhydrous sodium phosphate (Na2HPO4)
was purchased from DinâmicaAnalytical Reagents, São Paulo, Brazil. The reagents used in the experiments were of analytical grade and all solutions were prepared using water purified by the Milli-Q system from Millipore, with resistivity greater than or equal to 18 MΩ cm.
Apparatus and procedures
The electrochemical measurements were performed with a potentiostat/galvanostat Autolab model PGSTAT 128N from Echo Chemie (Utrecht, The Netherlands) coupled to a computer with the GPES 4.9 software for potential control, acquisition and processing of data. The electrochemical system used to perform the analysis consisted of three electrodes immersed in an electrochemical cell of 10 mL. The working electrode was a glassy carbon with 2 mm of diameter mounted in Teflon®. An Ag/AgCl
(sat)
containing KCl (3 mol L-1) was the reference electrode and
a platinum wire, an auxiliary electrode. The charge transfer resistance of the sensors were measured by electrochemical
impedance spectroscopy (EIS) assays in 1.0 mol L-1
KCl solution containing 1 mmol L-1 [Fe(CN)
6]3−/4− in the
frequency range of 10 mHz-0.1 MHz under AC amplitude of 10 mV at formal potential. For pH control of the buffers solutions, NaOH 0.2 mol L-1 or HCl 0.1 mol L-1 were used.
Fourier-transform infrared (FTIR) spectra were obtained using a UV-Vis-NIR Cary-5000 spectrometer in the region of 4000-400 cm-1. KBr (1%) tablets were
prepared for analysis of the (NiTsPc) complex and the CT-DNA/NiTsPc/rGO composite. UV-Vis spectra of all materials were obtained using an AvaSpec-2048 spectrometer from Avantes. All measurements were carried out in a 10-milimeter optical path quartz cell from Varian. The spectra were recorded on wavelength range of 300 up to 800 nm. All measurements were performed at room temperature (25 °C).
Reduced graphene oxide (rGO) and sensor preparation
Graphene oxide was prepared according to the literature.18 The graphene oxide was reduced chemically
1 mL of an aqueous solution containing 2 mg of CT-DNA. The solution was mixed using magnetic stirring and ultrasonic treatment to form a homogeneous mixture. After this step, 7 µL of the suspension was added on the electrode surface and dried in an oven for 10 minutes at 60 °C. Finally, the CT-DNA/NiTsPc/rGO modified electrode was washed with distilled water to remove non-adsorbed species and submitted to electrochemical analysis. The modified glassy carbon electrode was denoted as CT-DNA/NiTsPc/ rGO/GCE.
The electroactive surface area of the CT-DNA/NiTsPc/ rGO/GCE was calculated from Randles-Sevcik theory by using ferricyanide (Fe[(CN)6]3−) as redox probe.28 The
electroactive area of modified electrode (0.14 cm2) was
evaluated from the slope of the plot of peak current versus
the square root of scan rate (Figure S1). On the other hand, the heterogeneous apparent transfer rate constant (kapp) of the CT-DNA/NiTsPc/rGO/GCE to redox probe
(Fe[(CN)6]3−) was evaluated by using electrochemical
impedance spectroscopy.29
Preparation of samples
The use of the proposed sensor in artificial urine samples was also investigated by direct analysis of NADH in two different artificial urine samples, described as following: (i) artificial urine was prepared in distilled water with the following constituents and final concentrations: 0.33, 0.12, 0.016, 0.007 and 0.004 mol L-1 of urea, sodium
chloride, potassium diphosphate, creatinine and sodium monophosphate, respectively;30 (ii) artificial urine was
also prepared according to Laube et al.31 The solution
contains the following constituents and final concentrations: 0.411 mol L-1 urea, 0.0268 mol L-1 potassium chloride,
3 g L-1 sodium chloride and 0.0513, 0.014, 0.0186 and
0.0068 mol L-1 of sodium sulfate, potassium phosphate,
ammonium choride and dihydrated calcium chloride, respectively. In both procedures, the pH value of the sample solution was 6.6 (± 0.1). The voltammetric measurements were carried out for the recovery tests to determine NADH in the artificial human urine samples.
Results and Discussion
Characterization of composite NiTsPc/rGO by infrared spectroscopy and characterization of NiTsPc and CT-DNA by UV-Vis spectroscopy
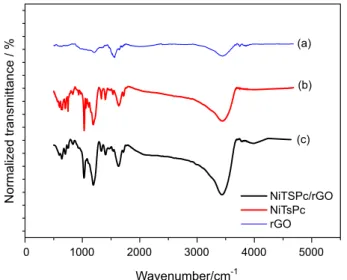
Fourier transform infrared spectroscopy (FTIR) measurements were carried out to examine possible interactions between reduced graphene oxide and the
nickel-N4 macrocyclic complex (NiTsPc). FTIR spectra were obtained for reduced graphene oxide, NiTsPc and composite NiTsPc/rGO (Figure 1). The FTIR spectrum presented in Figure 1a shows a broad band at 3446 cm-1,
which can be associated to the stretching of OH group. The peak observed at 1548 cm-1 is due to C=C stretching,
which is common in this region and can also be attributed to deformities of the O−H groups. The bands located in the region between 1500 and 900 cm-1 are possibly
assigned to stretching and strains of C-O bonds as well as to deformations in the O−H bond.32,33
The spectrum obtained for NiTsPc complex (Figure 1b)
shows bands between 650 and 812 cm-1 related to
deformations of C−H bonds. The peaks located at 1031 and 1328 cm-1 refer to the stretching of the SO group and
of the isoindol group, respectively.34-36
The spectrum obtained for the NiTsPc/rGO composite (Figure 1c) confirms the modification of rGO with the nickel-N4 macrocyclic by adsorption, since the peaks related to the complex and the graphene shown in Figures 1a and 1b were verified in the composite spectra.
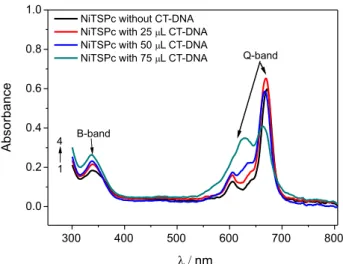
The interaction between NiTsPc and CT-DNA was also accompanied by UV-Vis spectroscopy. The absorption spectrum of NiTsPc shows two absorption bands. The former, B band (or Soret), at approximately 340 nm (a2u(π) → eg(π*))37 appears in the UV region and the later,
Q-band, between 600 and 700 nm (a1u(π) → eg(π*))37 in
the visible region of spectrum (Figure 2, black line). The Q-band shows a sharper peak with maximum at 669 nm as well as a weaker peak with maximum at 607 nm.
Figure 2 (spectra 2-3) show the interaction of NiTsPc with CT-DNA. The results show that the presence of CT-DNA promotes a decrease of the Q-band intensity at
669 nm. A considerable hypochromicity without red-shift in the Q-band of phthalocyanine is caused by its interaction with the DNA surface.
Thereby, the nickel(II) center of phthalocyanine is presumably coordinated by the carbonyl group of thymine or nitrogen-containing ring of the base pairs. The interaction between metallic phthalocyanines and DNA has been reported in the literature by other research groups.38-40
Electrochemical characterization of the CT-DNA/NiTsPc/ rGO modified electrode
In order to characterize the electrochemical performance of the sensor, electrochemical impedance studies were performed in ferricyanide as redox probe. Figure S2 shows the Nyquist plot for CT-DNA/NiTsPc/rGOmodified electrode in a solution containing 5 mmol L-1 [Fe(CN)
6]3− in
1.0 mol L-1 KCl. The semicircle shown in Figure S2 clearly
indicates that charge transfer is kinetically controlled. We obtained from the diameter of the semicircle a Rct equal
to 112.16 Ω for the Fe[(CN)6]3− redox processes on
CT-DNA/NiTsPc/rGO modified electrode. For the bare electrode a Rct of 500 Ω was found. The electron transfer
rate constants (kapp) of the redox probe at modified GCE
and bare GCE were calculated according to the following expression:29
(1)
where A is the geometric area of the electrode, C is the bulk concentration of the [Fe(CN)6]3− (mol cm-3), Rct is the
charge transfer resistance, and R, T, n and F have their usual meanings. The value of kap found was 6.68 × 10⁻³ cm s-1
for the modified electrode and 1.50 × 10⁻³ cm s-1 for
bare electrode. It is worth noting that the presence of the composite (CT-DNA/NiTsPc/rGO) enhances the rate constant by 4.5-fold, suggesting that it presents high electronic transfer constant in comparison to bare electrode.
In addition, cyclic voltammograms (CVs) were carried out in the absence and in the presence of 200 µmol L-1
NADH (Figure 3) and they were analyzed in comparison to the voltammograms obtained for each of the surface modifiers in the presence of 200 µmol L-1 NADH.
The CV obtained for the CT-DNA/NiTsPc/rGO modified electrode in absence of NADH (Figure 3, curve 1) shows no redox process in phosphate buffer solution (pH 7.0). In fact, the nickel tetrasulfonated phthalocyanine, when immobilized on the surface of an electrode, presents a redox couple, in solutions with pH values near to 12. On the other hand, the Ni-complex does not show redox pair when electrolyte solutions with pH values below 12 are employed. However, neutral solutions do not preclude the ability of nickel phthalocyanines to catalyze redox reactions.41,42
Figure 3 (curve 2) shows the CV on the bare GCE in the presence of 200 µmol L-1 NADH. The NADH oxidation on
bare GCE resulted in a low peak current with high oxidation potential of about 800 mV vs. Ag/AgCl. Figure 3 (curve 3) refers to NADH oxidation (200 µmol L-1) on the electrode
modified with CT-DNA. As can be seen, the NADH oxidation potential was about 130 mV vs. Ag/AgCl lower than that observed with the unmodified electrode (curve 2), which can be consequence of interaction between CT-DNA and NADH, causing a shift in the oxidation potential of the analyte to a less positive potential. On the other hand, the electrode modified with CT-DNA shows a smaller peak current compared with bare electrode, suggesting a slight resistance to the charge transfer process between the electrode and analyte.
Figure 3 (curve 4) shows the NADH oxidation (200 µmol L-1) on the modified electrode with rGO.
The oxidation of the analyte occurs at potential near 670 mV vs. Ag/AgCl. However, the anodic current obtained for NADH oxidation on the rGO modified electrode (curve 4) is higher and more defined than that obtained when the electrode was modified with CT-DNA (curve 3), suggesting a good electronic transfer between rGO and NADH. The curve 5 of Figure 3 shows oxidation of NADH (200 µmol L-1) on the NiTsPc complex-modified
electrode. The anodic peak potential of NADH occurs at about 560 mV vs. Ag/AgCl enabling a reduction of 240 mV NADH oxidation potential in comparison to that with unmodified electrode (Figure 3, curve 2). This result suggests that the nickel macrocyclic complex exhibits excellent electrocatalytic ability toward NADH oxidation.
The curve 6 of Figure 3 shows the voltammetric
profile of NADH oxidation (200 µmol L-1) on the
CT-DNA/NiTsPc/rGO modified electrode. As can be seen, the NADH oxidation potential was reduced to 240 mV vs. Ag/AgCl with a significant increase in anodic current in comparison to NADH oxidation on unmodified electrode (Figure 3, curve 2).
The higher anodic current of NADH on CT-DNA/ NiTsPc/rGO can be attributed to the low resistance to charge transfer of the composite NiTSPc/rGO, as well as good dispersion, fixation and stability of graphene and nickel complex on the electrode surface promoted by CT-DNA.19,20 These results suggest that the composite
material properties come from synergistic effects among the nickel complex, rGO and CT-DNA.
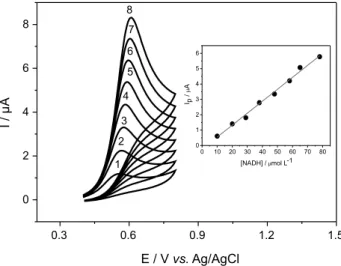
Figure 4 shows cyclic voltammograms for CT-DNA/ NiTsPc/rGO in presence of different concentrations of NADH in 0.1 mol L-1 phosphate buffer pH 7.0. As can
be seen, the peak current for NADH oxidation depends on NADH concentration (inset of Figure 4), suggesting that the CT-DNA/NiTsPc/rGO modified electrode can be successfully applied for NADH detection. Thus, the peak current for NADH oxidation was evaluated in more details to obtain new insights about the electrocatalytic processes on the sensor surface.
Electrocatalytic oxidation of NADH on CT-DNA/NiTsPc/ rGO/GCE
Cyclic voltammograms and amperograms were also performed to analyse the electrocatalytic oxidation of
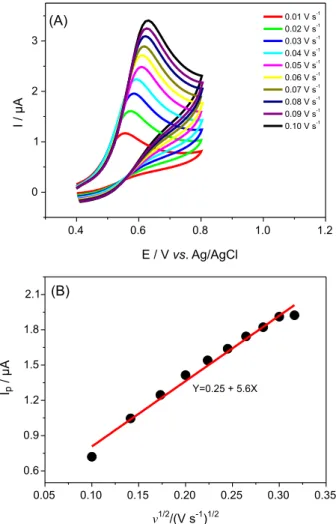
NADH on CT-DNA/NiTsPc/rGO/GCE. Figure 5A shows
CV obtained for NADH (200 µmol L-1) oxidation on
CT-DNA/NiTsPc/rGO/GCE at different scan rates. The plot of Ipvs. ν1/2 (Figure 5B) shows a linear relationship, which
suggests a diffusion-controlled NADH oxidation process on the composite modified electrode.28 As can be seen in
Figure 5A, CVs of NADH on modified electrode present only the anodic peak in the investigated potential range, which is typical of totally irreversible systems.28
Assuming an irreversible oxidation, the following equation was employed to find the number of electrons for NADH oxidation:28
(2)
where Ip is the peak current, n is the total number of
electrons involved in the reaction, α is the coefficient of electron transfer, na is the number of electrons involved
in the determining step of the reaction, Do is the diffusion
coefficient of the electroactive species (2.4 × 10⁻⁶ cm2 s-1),43
A is the area of the electrode, Co* is the concentration of
electroactive species within the solution (mol cm-3) and ν,
the scan rate.
The value of (1 – α)na for NADH oxidation was
calculated according to the following equation:28
(3)
where Ep is the potential peak and Ep/2 the potential at the
half height of the peak current. The value of (1 − α)na was
0.72. In this sense, the value of (1 −α)na from equation 3
was inserted in equation 2 to give a value of n of 1.7, which suggests that the total number of electrons involved in
Figure 3. CVs of the GCE modified with CT-DNA/NiTsPc/rGO in the absence of NADH (curve 1); CVs on the bare electrode, in the presence of NADH (curve 2) and CV of the modified electrode with: CT-DNA (curve 3); rGO (curve 4); NiTsPc (curve 5) and modified CT-DNA/NiTsPc/rGO (curve 6). Experimental conditions: 200 µmol L-1 NADH in 0.1 mol L-1 phosphate buffer pH 7.0, scan rate of 0.05 V s-1.
Figure 4. CVs related to oxidation of NADH at the following concentrations: (1) 10; (2) 20; (3) 30; (4) 38; (5) 48; (6) 57; (7) 65 and (8) 78 µmol L-1. Figure inserted: plot of I
the electron transfer process between the analyte and the modified electrode is about 2 electrons. This value is similar to that determined by other researchers.1,43,44
The electrocatalytic oxidation of NADH on the surface of CT-DNA/NiTsPc/rGO modified electrode was also verified by chronoamperometry. Figure 6A shows the plot of limiting current (Ilim) vs. the inverse of the square
root of the time (t-1/2) for modified electrode in presence
of different concentrations of NADH (50, 100, 150, 200 and 250 µmol L-1) while maintaining the potential at
0.56 V vs. Ag/AgCl. The amperograms are inserted in Figure 6A.
The plot of Ilimvs. t-1/2 (Figure 6A) confirms that the
observed currents are controlled by diffusion of NADH from solution to electrode surface. Thus, the corresponding current of the electrochemical reaction follows the Cottrell equation:28
Ilim = n F A Do1/2 Coπ-1/2 t-1/2 (4)
Based on the equation 4, the graph I vs. t-1/2 presents a
linear behavior for NADH concentrations between 50 and 250 µmol L-1 (Figure 6B). Taken into account that NADH is
oxidized to NAD+ via 2 electrons,1,43,44 the average diffusion
coefficient was 3.30 × 10⁻⁶ cm2 s-1, which is in agreement
with the value determined by CV in this work.
Chronoamperometry can be utilized for the evaluation of the apparent electrocatalytic rate constant (kobs) between
the NADH and redox sites of the CT-DNA/NiTsPc/rGO modified electrode based on the following equation:28
Icat/Ilim = γ1/2 [π1/2 erf (γ1/2) + exp (-γ) / γ1/2] (5)
where catalytic current (Icat) and Ilim are the currents of
the CT-DNA/NiTsPc/rGO/GCE in the presence and absence of NADH, respectively. Co is the concentration
of NADH in mol L-1, γ = k
obsCot and erf (γ1/2) is the error
function.
In cases where γ exceeds the value of 2, the error function (erf (γ1/2)) is almost equal to unity and therefore,
the above equation can be reduced to:
Icat/Ilim = γ1/2π1/2 = (kobs Coπ)1/2 t1/2 (6)
where kobs is the apparent electrocatalytic rate constant
(L mol-1 s-1) and t is the elapsed time (s). From the slope
of the plot of Icat/Ilimvs. t1/2 (Figure 6C), it was possible to
calculate the kobs value for NADH concentrations in the
range of 50 to 250 µmol L-1.
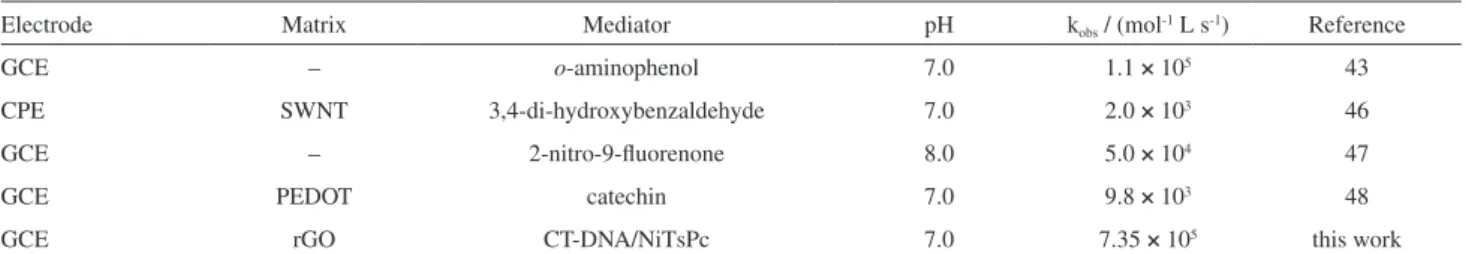
From the values of the slopes, the average value of k was found to be 7.35 × 10⁵ L mol-1 s-1. The average k
obs
value estimated from plot of Icat/IL vs. t1/2 represents a
higher electrocatalytic rate constant, in comparison with other electrodes for NADH detection (Table 1), suggesting that the electronic transfer process for NADH oxidation on CT-DNA/NiTsPc/rGO/GCE is very fast.
Influence of the concentrations of rGO, NiTsPc, and pH on the electrochemical oxidation of NADH
The response of the CT-DNA/NiTsPc/rGO can be affected by DNA, rGO, and NiTsPc concentrations. The concentration of CT-DNA was kept constant at 2 mg mL-1 for all subsequent experiments, since CT-DNA
concentrations higher than 2 mg mL-1 resulted in films
with low responses toward NADH. On the other hand, films prepared with CT-DNA concentrations lower than 2 mg mL-1 leach out of the electrode surface.
CVs on the electrode modified with several concentrations of rGO and NiTsPc were performed in the presence of 200 µmol L-1 NADH, in order to obtain
the optimal concentrations of rGO and NiTsPc for the electrochemical oxidation of NADH on CT-DNA/NiTsPc/ rGO/GCE.
The amount of rGO on the surface of GCE was controlled by using the same volume of the suspension with different concentrations of rGO (0.5, 0.75, 1.0, and
1.5 mg mL-1), maintaining the CT-DNA (2 mg mL-1) and
NiTsPc (10.0 mmol L-1) concentrations.
The effect of the rGO amount on the sensor response is shown in Table 2. As can be seen, the peak current for NADH oxidation decreases with the increase of rGO concentration. Films prepared with rGO concentrations lower than 0.5 mg mL-1 presented low stability. In this
sense, the rGO concentration was kept at 0.5 mg mL-1 for
all subsequent measurements in order to find the better stability of the film and response toward NADH oxidation.
The NiTsPc concentration also affects the sensor response (Table 2). As can be seen in Table 2, the anodic peak current toward NADH oxidation increased when the macrocyclic concentration increased from 0.1 to 1.0 mmol L-1. Sensors
constructed from solutions with NiTsPc concentrations lower than 1.0 mmol L-1 showed low peak currents toward
NADH oxidation. In addition, sensors prepared with NiTsPc concentrations higher than 1.0 mmol L-1 were also inefficient
to provoke the electrocatalysis of the NADH oxidation. Then, all subsequent sensors were prepared with 1.0 mmol L-1 of
Ni-complex, 2 mg mL-1 of CT-DNA, and 0.5 mg mL-1 of rGO.
The influence of the solution pH on the electrochemical response of NADH was also investigated for 0.1 mol L-1
PBS buffer solutions with pH between 5.0 and 8.5 (Figure S3). The experimental results indicate that pH has a significant influence on the values of the anodic peak potential. According to Figure S3, the anodic peak potential (Epa) shifted to more negative potentials with
an increase of pH value from 5.0 to 7.0. The Epa values
shift linearly with changes in pH values with a correlation coefficient of 0.998. The linear correlation obtained between pH values of 5.0 to 7.0 showed a slope of –22.68 mV/pH. This slope is close to that expected for an electrode reaction of proton/electron ratio of 1/2, which is 29.6 mV/pH at 25 °C. In addition, the number of electrons determined in the oxidation of NADH in this work was two electrons. The number of protons involved in this process should be one and a number of electrons equal to 2 for pH between 5.0 and 7.0, which is in accordance to proton/ electron ratio determined by other researchers.45
Figure 6. (A) Plot of I vs. t-1/2. Insert in (A): Chronoamperograms for different concentrations of NADH (50, 100, 150, 200 and 260 µmol L-1 NADH) in a fixed potential of 0.56 V vs. Ag/AgCl. (B) Plot of Icat/Ilim vs. t1/2. Experiments carried in 0.1 mol L-1 phosphate buffer solution (pH 7.0) for 20 seconds.
Table 1. Kinetic parameters for the electro-oxidation of NADH in different electrodes
Electrode Matrix Mediator pH kobs / (mol-1 L s-1) Reference
GCE – o-aminophenol 7.0 1.1 × 10⁵ 43
CPE SWNT 3,4-di-hydroxybenzaldehyde 7.0 2.0 × 10³ 46
GCE – 2-nitro-9-fluorenone 8.0 5.0 × 10⁴ 47
GCE PEDOT catechin 7.0 9.8 × 10³ 48
GCE rGO CT-DNA/NiTsPc 7.0 7.35 × 10⁵ this work
Analytical characterization of the modified electrode
In order to obtain an analytical curve for the proposed sensor, differential pulse voltammograms for different concentrations of NADH were carried out in 0.1 mol L-1
phosphate buffer at pH 7.0, after optimizing the experimental parameters (Figure 7). The proposed sensor showed a linear response range from 1 up to 1350 µmol L-1 (inset of Figure 7) which can be expressed
according to equation 7:
Ip(µA) = (0.06 ± 0.03) + (0.014 ± 0.006) [NADH] (µmol L–1) (7)
with a correlation coefficient of 0.999 (for n = 12). A detection limit of 0.30 µmol L-1 was determined using
a 3 σ/slope ratio and the quantification limit was 1.0 µmol L-1
using 10 σ/slope, where σ is the standard deviation of the mean value for ten voltammograms of the blank determined according to the IUPAC recommendations.49
Table 2. Influence of concentration of graphene with [NiTsPc] = 10 mmol L-1 and NiTsPc with [rGO] = 0.5 mg mL-1 of the electrochemical oxidation of NADH (200 µmol L-1). In both cases, 2 mg mL-1 of CT-DNA was used. Electrochemical measurements were performed in 0.1 mol L-1 phosphate buffer pH 7.0. v = 0.05 V s-1
[rGO] / (mg mL-1) I
p / µA
0.50 1.74
0.75 1.72
1.00 1.64
1.50 1.65
[NiTsPc] / (mmol L-1)
0.10 0.95
1.0 2.25
10.0 1.65
NiTsPc: nickel tetrasulfonated phthalocyanine; rGO: reduced graphene oxide.
Figure 7. DPV for the NADH oxidation at the following concentrations (1) 1, (2) 5, (3) 10, (4) 15, (5) 50, (6) 90, (7) 160, (8) 200, (9) 300, (10) 600, (11) 900 and (12) 1350 µmol L-1. Carried experiments under optimized experimental and operational parameters. Inset: calibration curve obtained from DPVs of Figure 7.
Table 3. Linear range, sensitivity and LOD for the determination of NADH using different electrodes
Electrode Linear range /
(µmol L-1)
Sensitivity / (µA L µmol-1)
LOD /
(µmol L-1) Reference
NanoAu-MWNTs-Teflon 10-100 0.037 NR 1
Pt disk/PDAMSa 70-400 0.00676 1.56 12
GCE/PEDOTSDS-NanoAg-MBb 500-3800 0.014 high 50
CESP/NADoxidase-Fcc 10-560 0.0023 0.1 51
Electrode paste graphene 5-200 NR NR 52
Graphite electrode/quercetin 0.5-100 0.034 0.15 53
Magnetic nanoparticles Fe3O4/MWNTs 1-70 0.0070 0.3 54
NanoAu/MWNT 18-1400 NR 0.5 55
Peptide diphenylalanine/MWNTs 20-800 0.00287 10 56
GCE/graphene 50-1400 0.013 20 57
Carbon black/Fe2O3 10-1000 0.0025 10 58
CRDE/Co3O4d 10-100 0.0028 4.25 59
Graphite/SiO2/SnO2/Sb2O5/Meldola blue 50-300 NR 10 60
GCE/rGOe 10-600 NR 0.33 61
GCE/PBCB/SWCNTf 3.0-104.2 0.0099 1.0 62
CT-DNA/NiTsPc/rGO 1-1350 0.014 0.3
According to Table 3 it was observed that although the references 1 and 53 show higher sensitivities than the proposed sensor, it is observed that both sensors therein reported show low linear ranges. In addition, although the low limits of detection presented in references 51 and 53, the present sensor presents a wide linear response range than those therein reported. Therefore, the present sensor presents promising analytical parameters such as sensitivity, detection limit and linear range of response for NADH determination in comparison to many reported works in the literature (Table 3). Such good analytical performance can be attributed to the efficiency of the electron transfer between the CT-DNA/NiTsPc/rGO electrode surface and NADH, due to the good electrocatalytic effect of the composite.
Even when stored at room temperature, no significant change in the sensor response was observed for at least two months. The modified electrode presented good repeatability for the NADH determination. The relative standard deviation (RSD) for 10 determinations of 50 µmol L-1 NADH was 2.33%. Additionally, a series of
10 sensors were prepared in the same manner and tested in 0.1 mol L-1 phosphate buffer (pH 7.0) containing 50 µmol L-1
NADH, and responses with a RSD of 3.10% were observed. These results indicate that the CT-DNA/NiTsPc/rGO/GCE has good repeatability and reproducibility, probably due to the ability of rGO and CT-DNA to fix the NiTsPc complex on the electrode surface in a reproducible and accurate way.
The selectivity of the CT-DNA/NiTsPc/rGO modified electrode was evaluated by examining the influences of several possible interfering substances on the detection
of 50 µmol L-1 NADH. Solutions of these compounds
were freshly prepared in the same conditions of NADH (0.1 mol L-1 PBS at pH 7.0). The electrochemical results
(Table S1) indicated that 100-fold higher concentrations of different species (sodium chloride, sodium bicarbonate, potassium chloride, potassium phosphate dibasic trihydrate, magnesium chloride hexahydrate, ascorbic acid, uric acid, dopamine, glucose and vitamin B6) did not interfere in the NADH determination.
Application to samples and recovery tests
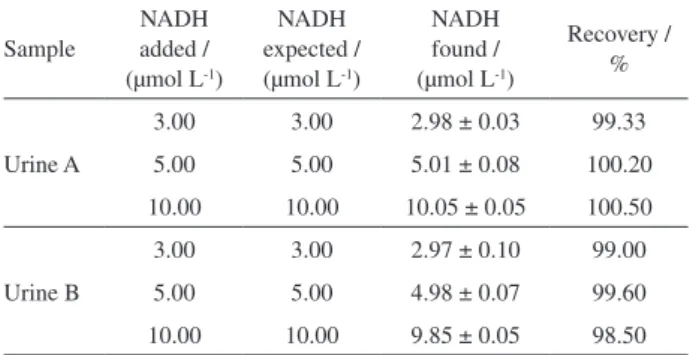
For an additional analysis on the accuracy of the developed method and the interference of the matrices, analytical recovery experiments were performed by adding known amounts of NADH (3, 5 and 10 µmol L-1) in two
samples in triplicate (urine samples). The percentage of recovery was calculated by comparing the concentration obtained from the samples with actual and added concentrations. The recoveries for the urine samples are
shown in Table 4. It can be clearly observed that there is no influence of the matrices on the developed sensor.
Conclusions
This work demonstrated that glassy carbon electrode modified with CT-DNA/NiTsPc/rGO is a feasible alternative for the analytical determination of NADH. Optimization of the experimental conditions yielded a detection limit and sensitivity for NADH, respectively, of 0.3 and 0.014 µA L µmol-1. This sensor showed good repeatability
for the measurements and electrode preparation, evaluated in terms of relative standard deviation, of 2.33 and 3.10%, respectively. The proposed sensor was applied in artificial urine samples and the average recovery for these samples was 99.5 ± 0.5%. In this sense, this work demonstrated that the glassy carbon electrode modified with CT-DNA/ NiTsPc/rGO is a sensitive and stable sensor showing great potential for NADH determination.
Supplementary Information
Supplementary information is available free of charge at http://www.jbcs.sbq.org.br as a PDF file.
Acknowledgments
The authors are grateful to Conselho Nacional de Desenvolvimento Científico e Tecnológico (CNPq), Rede Mineira de Química, Fundação de Amparo à Pesquisa do Estado de Minas Gerais (FAPEMIG), INCT-Bio and Fundação de Amparo à Pesquisa do Estado do Maranhão (FAPEMA).
References
1. Saleh, F. S.; Rahman, M. R.; Okajima, T.; Mao, L.; Ohsaka, T.; Bioelectrochemistry 2011, 80, 121.
Table 4. Recovery values of NADH obtained for two urine samples (n = 5)
Sample
NADH added / (µmol L-1)
NADH expected / (µmol L-1)
NADH found / (µmol L-1)
Recovery / %
Urine A
3.00 3.00 2.98 ± 0.03 99.33
5.00 5.00 5.01 ± 0.08 100.20
10.00 10.00 10.05 ± 0.05 100.50
Urine B
3.00 3.00 2.97 ± 0.10 99.00
5.00 5.00 4.98 ± 0.07 99.60
10.00 10.00 9.85 ± 0.05 98.50
2. You, J.; Jeon, S.; Electrochim. Acta 2011, 56, 10077. 3. Radoi, A.; Compagnone, D.; Bioelectrochemistry 2009, 76,
126.
4. Duboc, D.; Toussaint, M.; Renault, G.; Polianski, J.; Guerin, F.; Pocidalo, J. J.; Degeorges, M.; Arch. Mal. Coeur Vaiss. 1987, 80, 236.
5. Margolis, S. A.; Schaeffer, R.; Clin. Chem. 1976, 22, 1179. 6. Tang, L.; Lei, X.; Zeng, G.; Liu, Y.; Peng, Y.; Wu, M.; Zhang,
Y.; Liu, C.; Li, Z.; Shen, G.; Spectrochim. Acta, Part A 2012, 99, 390.
7. Dilgin, Y.; Dilgin, D. G.; Dursun, Z.; Gökcel, H. I.; Gligor, D.; Bayrak, B.; Ertek, B.; Electrochim. Acta 2011, 56, 1138. 8. Dewitt, C. M.; Moore, K. H.; FASEB J. 1995, 9, A476.
9. Omar, F. S.; Duraisamy, N.; Ramesh, K.; Ramesh, S.; Biosens. Bioelectron. 2016, 79, 763.
10. Zanardi, C.; Ferrari, E.; Pigani, L.; Arduini, F.; Seeber, R.; Chemosens. 2015, 3, 118.
11. Shan, C.; Yang, H.; Han, D.; Zhang, Q.; Ivaska A.; Niu, L.; Biosens. Bioelectron. 2010, 25, 1504.
12. Jiménez, A.; Armada, M. P. G.; Losada, J.; Villena, C.; Alonso, B.; Casado, C. M.; Sens. Actuators, B 2014, 190, 111. 13. Li, Z.; Huang, Y.; Chen, L.; Qin, X.; Huang, Z.; Zhou, Y.; Meng,
Y.; Li, J. Huang, S.; Liu, Y.; Wang, W.; Xie, Q.; Yao, S.; Sens. Actuators, B 2013, 181, 280.
14. Yang, W.; Ratinac, K. R.; Ringer, S. P.; Thordarson, P.; Gooding, J. J.; Braet, F.; Angew. Chem., Int. Ed. 2010, 49, 2114. 15. Kuila, T.; Bose, S.; Khanra, P.; Mishra, A. K.; Kim, N. H.; Lee,
J. H.; Biosens. Bioelectron. 2011, 26, 4637.
16. Liu, Y.; Dong, X.; Chen, P.; Chem. Soc. Rev. 2012, 41, 2283. 17. Zhong, J.; Fan, Y.; Wang, H.; Wang, R.; Fan, L.; Shen, X.; Shi,
Z.; Electrochim. Acta 2013, 113, 653.
18. Ferreira, G. M. M.; Oliveira, F. M.; Leite, F. R. F.; Maroneze, C. M.; Kubota, L. T.; Damos, F. S.; Luz, R. C. S.; Electrochim. Acta 2013, 111, 543.
19. Sharifi, E.; Salimi, A.; Shams, E.; Bioelectrochemistry 2012, 86, 9.
20. Premkumar, T.; Geckeler, K. E.; Prog. Polym. Sci. 2012, 37, 515.
21. Castro, J. G. M.; Ferreira, G. M. M.; Oliveira, F. G.; Damos, F. S.; Luz, R. C. S.; J. Electroanal. Chem. 2014, 732, 93. 22. Vilela Jr., E. T.; Carvalho, R. C. S.; Yotsumoto Neto, S.; Luz,
R. C. S.; Damos, F. S.; J. Electroanal. Chem. 2015, 752, 75. 23. Damos, F. S.; Luz, R. C. S.; Tanaka, A. A. In Electrochemistry of
N4 Macrocyclic Metal Complexes, vol. 2; Zagal, J. H.; Bedioui, F., eds.; Springer International Publishing: New York, 2016, p. 201.
24. Lever, A. B. P.; J. Porphyrins Phthalocyanine 1999, 3, 488. 25. Zagal, J. H.; Griveau, S.; Silva, J. F.; Nyokong, T.; Bedioui, F.;
Coord. Chem. Rev. 2010, 254, 2755.
26. Zhou, X.; Wang, X.; Wang, B.; Chen, Z.; He, C.; Wu, Y.; Sens. Actuators, B 2014, 193, 340.
27. Pakapongpan, S.; Mensing, J. P.; Phokharatkul, D.; Lomas T.; Tuantranont, A.; Electrochim. Acta 2014, 133, 294.
28. Bard, A. J.; Faulkner, L. R.; Electrochemical Methods: Fundamentals and Applications, 2nd ed.; John Wiley & Sons,
Inc.: Hoboken, New Jersey, 2001, p. 833.
29. Sabatani, E., Rubinstein, I.; J. Phys. Chem. 1987, 91, 6663. 30. Haglock-Adler, C. J.; Hurley, A.; Strathmann, F. G.; Clin.
Biochem. 2014, 47, 80.
31. Laube, N.; Mohr, B.; Hesse, A.; J. Cryst. Growth 2001, 233, 367.
32. Low, C. T. J.; Walsh, F. C.; Chakrabarti, M. H.; Hashim, M. A.; Hussain, M. A.; Carbon 2013, 54, 1.
33. Frogley, M. D.; Wang, C.; Cinque, G.; Barber, A. H.; Vib. Spectrosc. 2014, 75, 178.
34. Berríos, C.; Cárdenas-Jirón, G. I.; Marco, J. F.; Gutiérrez, C.; Ureta-Zañartu, M. S.; J. Phys. Chem. A 2007, 111, 2706. 35. Bertoncello, P.; Peruffo, M.; Colloids Surf., A 2008, 321,
106.
36. Verma, D.; Dash, R.; Katti, K. S.; Schulz, D. L.; Caruso, A. N.; Spectrochim. Acta, Part A 2008, 70, 1180.
37. N4-Macrocyclic Metal Complexes; Zagal, J. H.; Bedioui, F.; Dodelet, J. P., eds.; Springer: New York, 2006.
38. Asadi, M.; Safaei, E.; Ranjbar, B.; Hasanib, L.; New J. Chem. 2004, 28, 1227.
39. Pasternack, R. F.; Schaefer, K. F.; Hambright, P.; Inorg. Chem. 1994, 33, 2062.
40. Aghaie, M.; Naderi, F.; Monajjemil, M.; Aghaie, H.; Safari, N.; Jamaat, P. R.; J. Phys. Theor. Chem. 2007, 3, 27.
41. Sousa, A. L.; Santos, W. J. R.; Luz, R. C. S.; Damos, F. S.; Kubota, L. T.; Tanaka, A. A.; Tanaka, S. M. C. N.; Talanta 2008, 75, 333.
42. Luz, R. C. S.; Moreira, A. B.; Damos, F. S.; Tanaka, A. A.; Kubota, L. T.; J. Pharm. Biomed. Anal. 2006, 42, 184. 43. Nassef, H. M.; Radi, A.; O’Sullivan, C. K.; Electrochem.
Commun. 2006, 8, 1719.
44. Lima, P. R.; Santos, W. J. R.; Oliveira, A. B.; Goulart, M. O. F.; Kubota, L. T.; Biosens. Bioelectron. 2008, 24, 448. 45. Elving, P. J.; Bresnahan, W. T.; Moiroux, J.; Samec, Z.;
Bioelectrochem. Bioenerg. 1982, 9, 365.
46. Antiochia, R.; Lavagnini, I.; Magno, F.; Anal. Bioanal. Chem. 2005, 381, 1355.
47. Mano, N.; Kuhn, A.; J. Electroanal. Chem. 1999, 477, 79. 48. Vasantha, V. S.; Chen, S.; Electrochim. Acta 2006, 52, 665. 49. Analytical Methods committee; Analyst; 1987, p. 199. 50. Balamurugan, A.; Ho, K.; Chen, S.; Huang, T.; Colloids Surf., A
2010, 362, 1.
51. Creanga, C.; Murr, N. E.; J. Electroanal. Chem. 2011, 656, 179. 52. Gasnier, A.; Pedano, M. L.; Rubianes, M. D.; Rivas, G. A.; Sens.
Actuators, B 2013, 176, 921.
54. Teymourian, H.; Salimi, A.; Hallaj, R.; Biosens. Bioelectron. 2012, 33, 60.
55. Tiwari, I.; Gupta, M.; Mater. Res. Bull. 2014, 49, 94. 56. Yuan, J.; Chen, J.; Wu, X.; Fang, K.; Niu, L.; J. Electroanal.
Chem. 2011, 656, 120.
57. Guo, K.; Qian, K.; Zhang, S.; Kong, J.; Yu, C.; Liu, B.; Talanta 2011, 85, 1174.
58. Kim, Y. H.; Kim, T.; Ryu, J. H.; Yoo, Y. J.; Biosens. Bioelectron. 2010, 25, 1160.
59. Chen, C.; Chen, Y.; Lin, M.; Biosens. Bioelectron. 2012, 42, 379.
60. Canevari, T. C.; Vinhas, R. C. G.; Landers, R.; Gushikem, Y.; Biosens. Bioelectron. 2011, 26, 402.
61. Tabrizi, M. A.; Azar, A. J.; Varcani, J. N.; Anal. Biochem. 2014, 460, 29.
62. Yang, D. W.; Liu, H. H.; Biosens. Bioelectron. 2009, 25, 733.
Submitted: November 30, 2016
![Table 2. Influence of concentration of graphene with [NiTsPc] = 10 mmol L -1 and NiTsPc with [rGO] = 0.5 mg mL -1 of the electrochemical oxidation of NADH (200 µmol L -1 )](https://thumb-eu.123doks.com/thumbv2/123dok_br/19000900.463717/8.892.479.821.108.376/table-influence-concentration-graphene-nitspc-nitspc-electrochemical-oxidation.webp)