Nota Técnica
*e-mail: [email protected]
SIMPLE AND SELECTIVE SPECTROPHOTOMETRIC ASSAY OF DIETHYLCARBAMAZINE CITRATE USING 2,3-DICHLORO-5,6-DICYANO-p-BENZOQUINONE AND 2,4-DINITRO PHENOL
Nagaraju Swamy and Kanakapura Basavaiah*
Department of Chemistry, Manasagangothri, University of Mysore, Mysore-570 006, Karnataka, India
Recebido em 09/10/2014; aceito em 02/02/2015; publicado na web em 14/04/2015
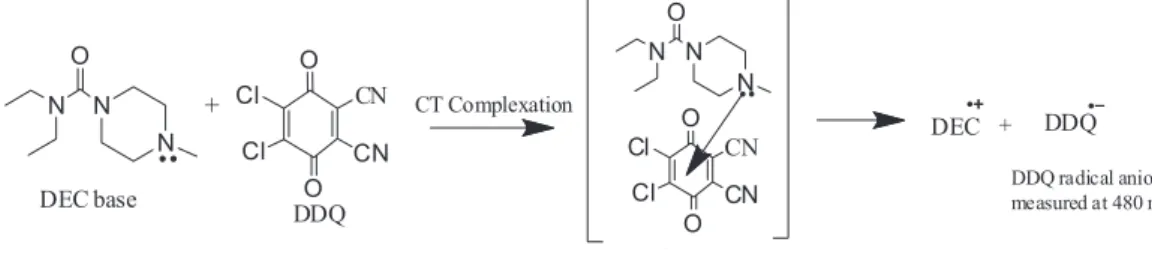
Two simple, rapid and inexpensive spectrophotometric methods are described for the determination of diethylcarbamazine citrate (DEC) in bulk drug and formulations. The methods are based on the charge–transfer (CT) complexation reaction involving DEC as the n- donor and 2,3-dichloro-5,6-dicyano-p-benzoquinone [DDQ] (method A) and 2,4-dinitro phenol [DNP] (method B) as π-acceptors in chloroform. The absorbance of CT complexes was measured at 480 nm for method A, and 420 nm for method B. Under optimum conditions, Beer’s law was obeyed over the concentration ranges 4-90 and 4-100 µg mL-1 for methods A and B, respectively. Keywords: diethylcarbamazine citrate; spectrophotometry; charge-transfer complexes.
INTRODUCTION
Diethylcarbamazine citrate (DEC), chemically known as [N, N-diethyl-4-methyl-1-piperazinecarboxamide citrate] is an anthel-mintic agent used in the treatment of filarial infections caused by a host of organisms commonly found in the tropics.1 It is also the alter-native drug of choice in Onchocerca volvulus infections and tropical eosinophilia.2 The drug is official in British Pharmacopoeia (BP),3 which describes a non-aqueous titration method for its determination and also in the United States Pharmacopoeia (USP)4 which uses a liquid chromatographic technique with phosphate buffer-methanol system as the mobile phase for the assay with uv detection at 220 nm. Other than these official methods, several methods have been reported for the determination of DEC in pharmaceutical dosage forms, and include gas chromatography (GC),5-8 high performance liquid chromatography (HPLC),9-11 proton magnetic resonance (PMR) spectroscopy,12,13 DC polarography,14 ion selective electrode poten-tiometry15 and titrimetry.16,17 However, many of the reported methods for DEC, particularly, the chromatographic methods are complex, requiring expensive instrumental set up and skilled operator which are not always found in laboratories of developing and under deve-loped countries. Thus, the need for a simple, selective and low-cost method is obvious, especially for routine quality control analysis of pharmaceuticals containing DEC.
Several spectrophotometric methods based on diverse chemical reactions are found in the literature for DEC. Charge-transfer com-plex formed with iodine was used by Wahbi et al.18 for the assay of 1-6 µg mL–1 DEC in tablets. Chloranilic acid has been employed by two groups of workers19,20 whereas picric acid was used by Ramachandran21 as CT complexing agent for the assay of drug in pharmaceuticals based on the same type of reaction. In a method reported by Basu and Dutta,22 the ion associate formed by DEC with ammonium reineckate at pH 3.5 was filtered, dissolved in acetone and absorbance measured at 525 nm. The colored condensation product23 formed by malonic acid with acetic anhydride in the presence of DEC was measured at 333 nm facilitating the assay of the drug in dosage forms. In a similar method,24 the base form of the drug was reacted with malonic acid and acetic anhydride at 80 οC for 30 min and the
resulting condensation product was measured at 334 nm. The yellow colored condensation product25 formed by an acetous solution of
DEC with acetic anhydride-pyridine mixture was measured at 428 nm and used for the determination of DEC in 10-100 µg mL–1 range in commercial tablets.
There are three reports on the use of ion-pair complexation reactions for the spectrophotometric assay of DEC. Rao and Subramanyam26 employed bromophenol blue at acidic pH as the ion pair complexing agent for the determination of the drug in tablets and biological fluids. The drug in tablets, syrups and parenterals was determined by extracting the ion-pair complex formed with bromocre-sol green27 at pH 4.6 with chloroform. The colored complexes of the drug with Fast green FCF at pH 5.0 and orange II in 0.1 mol L-1 HCl were successfully employed by Sastry et al.,28 for the determination of DEC in bulk drug and pharmaceutical preparations by extractive spectrophotometry.
The reported spectrophotometric methods suffer from one or the other disadvantage such as poor sensitivity and narrow linear range,18-20 use of critical pH condition,22-28 heating,23-25 tedious and time consuming steps like precipitation, filtration and washing,23 and extraction.26-28 Hence, there is a need for developing a method free from such disadvantages.
The aim of the present study was to develop and validate two simple, rapid, sensitive, cost-effective and extraction-free spectro-photometric methods based on charge-transfer (CT) complexation reactions using DDQ and DNP as π-acceptors. In both the methods, drug is reacted with DDQ and DNP in chloroform to form orange/ yellow colored CT complexes with absorption maxima peaking at 480 and 420 nm, respectively. The methods were successfully applied to quantify DEC in pharmaceutical formulations.
EXPERIMENTAL
Apparatus
A Systronics model 166 digital spectrophotometer (Systronics, Ahmedabad, Gujarat, India) equipped with 1-cm matched quartz cells was used for all absorbance measurements.
Materials
Nashik, India) and Banocide syrup (Glaxo Smith Kline Pharma. Ltd., Bangalore, India) both were purchased from local commercial stores. Reagents and chemicals
All reagents used were of analytical reagent grade and spectro-scopic grade organic solvents were used throughout the investigation. A 0.1% DDQ (Avra Syntheis Pvt. Ltd., Hyderabad, India), and 0.4% DNP (S.D. Fine Chem., Mumbai, India) solutions were prepared separately in chloroform (CHCl3) (Merck Ltd., Mumbai, India) for method A, and method B, respectively.
Standard DEC base solution [200 µg mL-1]
An amount of the powdered salt equivalent to 10 mg DEC base was accurately weighed and dissolved in 10 mL water in a 125 mL separatory funnel. The solution was made alkaline by adding 10 mL of 1 mol L-1 NaOH and shaken successively for 2 min with three 10 mL portions of CHCl3, each extract was pooled in a beaker and passed through 2 g of anhydrous sodium sulphate supported on a quantitative filter paper using small funnel in to a 50 mL calibrated flask and completed to the mark with CHCl3.
ASSAY PROCEDURES
Method A (Using DDQ)
Different aliquots of 0.1, 0.25, 0.5, 1.0, 1.5, 2.0, and 2.25 mL of standard DEC base solution (200 µg mL-1) were accurately transferred to 5 mL calibrated flasks using a micro burette, and the total volume was adjusted to 2.5 mL by adding adequate quantity of CHCl3 and 0.75 mL of 0.1% DDQ was added to each flask and the mixture was diluted to the volume with CHCl3 and mixed well. The absorbance of each solution was measured at 480 nm against a reagent blank within 10 min.
Method B (Using DNP)
Varying aliquots of 0.1, 0.25, 0.5, 1.0, 1.5, 2.0 and 2.5 mL of standard DEC base solution (200 µg mL-1) were accurately added to 5 mL standard flasks using a micro burette, and the total volume was adjusted to 2.5 mL with CHCl3. One mL of 0.4% DNP was added to each flask and the mixture was diluted to the volume with CHCl3 and mixed well. After 5 min, the absorbance of each solution was measured at 420 nm against a reagent blank prepared simultaneously.
A standard graph was constructed by plotting absorbance against concentration, and the unknown concentration was computed from the regression equation derived using Beer’s law data.
Procedure for tablets
Ten tablets each containing 100 mg DEC was weighed accurately and ground into a fine powder. An accurately weighed quantity equi-valent to 10 mg of DEC base was dissolved in 10 mL water in a beaker and filtered to remove the insoluble matter. The residue was washed with water, the washings along with the filtrate were transferred to a 125 mL separatory funnel and the base solution was prepared as described earlier. Appropriate aliquots were then subjected to analysis following the above procedures.
Procedure for syrup
The content of five 100 mL bottle syrup was pooled and 5 mL
syrup was diluted with water to 50 mL, and 5 mL of the resulting dilute syrup was pipetted out into a 125 mL separating funnel and mixed with 10 mL water. Shaken for 2 minutes with 10 mL 1 mol L-1 NaOH and three 10 mL portions of chloroform, and the base were extracted as described under ‘standard DEC base so-lution’. This 240 µg mL-1 syrup extract was further diluted to get working standard solution of 200 µg mL-1 with CHCl
3 and used in the assay.
RESULTS AND DISCUSSION
Charge-transfer complexes arise from a donor-acceptor mecha-nism of Lewis acid-base reaction between two or more different chemical constituents. The formation of electron donor acceptor complexes can be assessed for their validity as a simple quantitative analytical method for many drug substances which can act as elec-tron donors. DDQ and DNP as π- acceptors have been successfully employed in the determination of a variety of electron donating basic compounds of pharmaceutical importance.29-38
Absorption spectra
The reaction of DDQ or DNP with DEC base, results in the formation of intense orange or yellow colored product. The absorp-tion of colored products was recorded at 380-500 nm against the corresponding reagent blanks. The resulting colored charge-transfer complexes showed maximum absorbance at 480 nm and 420 nm for DEC base-DDQ (Figure 1) and DEC base-DNP (Figure 2), respectively.
0 0.1 0.2 0.3 0.4 0.5 0.6 0.7
400 420 440 460 480 500 520 540
Wavelength, nm
A
b
so
rb
a
n
ce
Figure 1. Absorption spectra of DEC base-DDQ complex(- -) [40 µg mL-1
DEC] and blank (- -)
0 0.1 0.2 0.3 0.4 0.5 0.6
400 410 420 430 440 450 460 470 480
A
b
so
rb
a
n
c
e
Wavelength, nm
Figure 2. Absorption spectra of DEC base-DNP complex(- -) [80 µg mL-1
Reaction mechanism
The reaction involved in the present methods is the charge-transfer complex formed by the electronic transition to an excited state where the transfer of electronic charge from donor to acceptor moiety takes place partially. As a result, the transition in this excitation energy occurs very frequently in the visible region of the electromagnetic spectrum.39 DEC base reacts with DDQ or DNP yieldingorange or yellow colored chromogen that exhibits a maximum absorption at 480 nm or 420 nm in chloroform. This can be attributed to the formation of charge-transfer complex between DEC base (as n-donor), DDQ and DNP (as π-acceptors)followed by the formation of radical anion due to the dissociation of DEC base-DDQ/DNP complex in chloroform. The interaction between the donor and acceptor occurs according to the Schemes 1 and 2.
Choice of solvent
DEC is soluble in water, hot alcohol and practically insoluble in most organic solvents, and hence the drug was converted into base form using sodium hydroxide and extracted into CHCl3 before reacting with DDQ or DNP. For preparation of the reagent solutions,
attempts were made to use different solvents such as 1,4-dioxan, CHCl3, acetonitrile, acetone, t-butanol, 2-propanol and dichlorome-thane, and the reaction of DEC base with DDQ or DNP was followed. In both the methods, CHCl3 was best suited for preparation of DEC base, and DDQ and DNP solutions. Similarly, the effect of the diluting solvent was studied and the results showed that the ideal diluting solvent to achieve maximum sensitivity was CHCl3.
Effect of reagent concentration
Though, 0.5 mL of 0.1% DDQ was found adequate in method A (Figure 3), in order to achieve greater stability of the colored species, 0.75 mL of 0.1% DDQ was used; and 1.0 mL of 0.4% DNP gave maximum absorbance in method B (Figure 4). Larger volumes were unsuitable because of increasing blank absorbance values.
Reaction time and stability
In method A, although the complex (DEC base:DDQ) was for-med instantaneously, constant absorbance readings were obtained after not less than 60 min of standing time at ambient temperature (28±2 ºC) and remained constant for at least 24 h (Figure 5), hence,
N N N
O
+
OH NO2
NO2
CT Co mplexation
N N N
O
DEC + DNP
DNP ra dical anion m easured a t 420 nm
1:1 DEC base-DNP complex OH
NO2
NO2
DNP DEC base
Scheme 2. Reaction mechanism for the formation of DEC base-DNP CT complex (method B)
N N N
O
+ O
O
CN
CN Cl
Cl
DEC base
DDQ
CT Complexation
N N N
O
O
O
CN
CN Cl
Cl
DEC + DDQ
DDQ radical anion measured at 480 nm
1:1 DEC base-DDQ complex
Scheme 1. Reaction mechanism for the formation of DEC base-DDQ CT complex (method A)
0 0.2 0.4 0.6
0.25 0.5 0.75 1 1.25 1.5
Volume of 0.1% DDQ, mL
A
b
s
or
b
an
c
e
Figure 3. Effect of volume of 0.1% DDQ (Method A)
0 0.2 0.4 0.6 0.8 1
0 0.5 1 1.5 2 2.5
Volume of 0.4% DNP, mL
A
b
so
rb
a
n
c
e
in order to avoid a standing time of 60 min, absorbance were mea-sured within 5 min.
Complete color development of the DEC base:DNP complex was attained immediately in method B, and the colored species were stable for at least 24 h (Figure 6).
Composition of the CT complexes
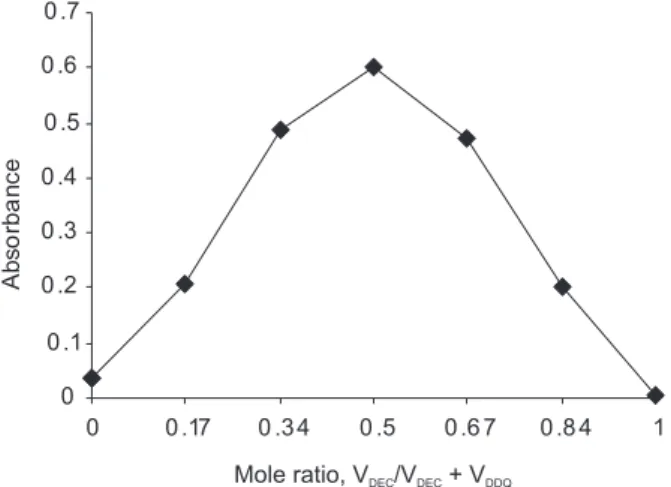
The composition of the CT complexes was established by the Job’s method of continuous variations40 using equimolar concentrations of the drug (base form) and reagents (1.003×10⁻³ mol L–1 in both methods). The results indicated that a 1:1 (drug: dye) complex is formed in both methods, shown in Figure 7 and Figure 8.
METHOD VALIDATION
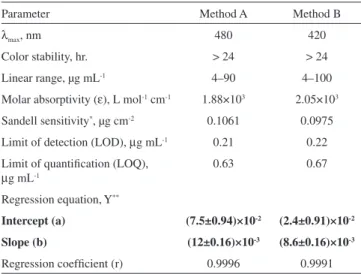
A linear correlation was found between the absorbance at λmax and the concentration of DEC (Figure 9) in the ranges given in Table 1. Regression analysis of the Beer’s Law data using the least squares method was performed to evaluate the slope (b), intercept (a) and the correlation coefficient (r) for each system and the values are presented in Table 1. The optical characteristics such as the limits of the Beer Law, molar absorptivity and the Sandell sensitivity values of both methods are also given. Inaddition, the limits of detection (LOD) and quantification (LOQ), calculated according to ICH guidelines41 are also compiled in Table 1. As can be seen from Table 1, the values of slope indicate moderate sensitivity of the methods, and low values of intercept imply nearly perfect adherence to the Beer’s law. Further,
low values of standard deviation of slope and intercept indicate that the points tend to be very close to the expected values.
Precision and accuracy
For three levels of analyte, the assays were repeated seven times within the day to determine the intra-day precision and five times on different days to determine the inter-day precision of the methods. The percentage relative standard deviation (RSD) values were ≤1.54% (intra-day) and ≤2.13% (inter-day), indicating the high precision of the methods. The accuracy was evaluated as the percentage relative error (RE) between the measured mean concentrations and the taken concentrations for DEC. The RE values of ≤2.25% demonstrate the high accuracy of the proposed methods as shown in Table 2. Selectivity study
Selectivity was determined by using placebo blank and synthetic mixture analysis. A placebo blank, consisting of starch (20 mg), acacia (15 mg), hydroxyl cellulose (25 mg), sodium citrate (30 mg), talc (20 mg), magnesium stearate (25 mg) and sodium alginate (25 mg) was prepared by thorough mixing and its solution was prepared as described under “procedure for tablets”, and then subjected to analysis. The absorbance of the placebo blank was almost equal to the absorbance of the reagent blank suggesting no interference.
A synthetic mixture was prepared by adding 10 mg of pure DEC to about 12 mg of the above mentioned placebo blank, and the mixture was homogenized. Following the same procedure for tablets, the synthetic mixture solution was prepared, and a suitable aliquot Figure 5. Stability of DEC base-DDQ complex in method A
0 0.1 0.2 0.3 0.4 0.5 0.6
0 1 2 3 5 12 24
Time, h
A
b
s
o
rb
an
c
e
Figure 6. Stability of DEC base-DNP complex in method B 0.69
0.695 0.7
0 1 2 3 5 12 24
Time, h
A
b
so
rb
a
n
c
e
0 0 .1 0 .2 0 .3 0 .4 0 .5 0 .6 0 .7
0 0 .17 0 .3 4 0 .5 0 .6 7 0 .8 4 1
A
b
s
o
rba
n
c
e
Mole ratio, VDEC/VDEC+ VDDQ
Figure 7. Job’s plot for DEC base-DDQ complex (1.003×10⁻³ M solutions of
DEC base and DDQ in method A)
0 0.1 0.2 0.3 0.4
0 0.17 0.34 0.5 0.67 0.84 1
A
bs
o
rba
nce
Mole ratio, VDEC/VDEC+ VDNP
Figure 8. Job’s plot for DEC base-DNP complex (1.003×10⁻³ M solutions of
was subjected to analysis by both methods (n=5), after appropriate dilution. The percent recoveries of DEC were 98.1±1.5 and 101.4±2.1 for methods A and B respectively. This confirms the selectivity of the methods in presence of common excipients.
Robustness and ruggedness
The robustness of the methods was evaluated by making small incremental changes in the volume of reagent (0.75±0.2 mL of DDQ; 1±0.2 mL of DNP) and contact time (1±0.2 min in both methods A and B), and the effect of the changes was studied on the absorbance of the complex systems. The changes had negligible influence on the results as revealed by small intermediate precision values expressed as RSD % (≤ 3%). Method ruggedness was demonstrated by having
the analysis performed by four analysts, and by a single analyst performing the analysis on four different instruments in the same laboratory. The intermediate precision values (RSD) in both instances were in the range 0.93-2.98%, indicating acceptable ruggedness as indicated in Table 3.
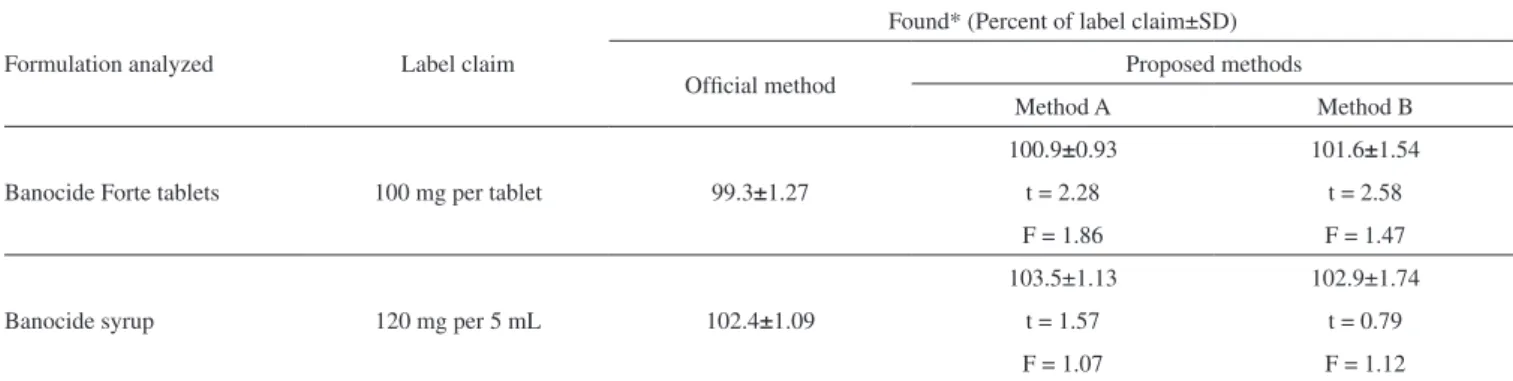
Applications
The proposed methods were applied for the determination of DEC in commercial formulations. The results were compared with those obtained by the US Pharmacopoeia method.5 Statistical analy-sis of the results did not detect any significant difference between the performance of the proposed methods and official method with respect to accuracy and precision as revealed by the Student’s t- and variance ratio F-values as shown in Table 4.
Recovery studies
The recovery test was performed by spiking the pre-analyzed commercial formulations with pure DEC at three different levels (50, 100 and 150% of the content taken) and the total was found by the proposed methods. Each test was repeated three times. In both the cases, the recovery values ranged between 98.40 and 102.8%, with a standard deviation in the range 0.59–1.84%. The closeness of the results to 100% showed the fairly good accuracy of the methods (Table 5).
Table 1.Sensitivity and regression parameters
Parameter Method A Method B
λmax, nm 480 420
Color stability, hr. > 24 > 24 Linear range, µg mL-1 4–90 4–100 Molar absorptivity (ε), L mol-1 cm-1 1.88×10³ 2.05×10³ Sandell sensitivity*, µg cm-2 0.1061 0.0975 Limit of detection (LOD), µg mL-1 0.21 0.22 Limit of quantification (LOQ),
µg mL-1
0.63 0.67
Regression equation, Y**
Intercept (a) (7.5±0.94)×10-2 (2.4±0.91)×10-2
Slope (b) (12±0.16)×10-3 (8.6±0.16)×10-3
Regression coefficient (r) 0.9996 0.9991 *Limit of determination as the weight in µg mL-1 of solution, which corre-sponds to an absorbance of A = 0.001 measured in a cuvette of cross-sectional area 1 cm2 and l = 1 cm. **Y=a+bX, Where Y is the absorbance, X is con-centration in µg mL-1, a is intercept and b is slope.
Table 2. Evaluation of intra-day and inter-da-y accuracy and precision
Method DEC taken (µg mL-1)
Intra-day accuracy and precision (n=7) Inter-day accuracy and precision (n=7) DEC founda
(µg mL-1)
RSDb
%
REc
%
DEC found (µg mL-1)
RSDb
%
REc
%
A
40.0 60.0 80.0
40.7 59.2 81.2
1.45 1.18 0.95
1.70 1.34 1.50
40.9 61.2 81.4
1.68 1.43 1.29
2.25 2.01 1.75
B
40.0 60.0 80.0
39.46 60.91 79.10
1.54 0.96 1.42
1.36 1.52 1.12
40.6 60.93
81.1
1.59 2.13 1.81
1.62 1.55 1.37 aMean value of 7 determinations; bRelative standard deviation (%);cRelative error (%).
CONCLUSIONS
The proposed methods make use of simple reagents and instru-ment which an ordinary analytical laboratory can afford; the methods are rapid, extraction-free, cost-effective and do not involve any criti-cal reaction conditions. The suggested methods utilize a single step reaction and single solvent. The proposed methods are accurate and precise, and free from interference caused by the excipients expected to be present in dosage forms. The method was demonstrated to be both robust and rugged. The methods offer several advantages over the existing methods in terms of sensitivity, selectivity, linear dynamic range and mild optimum conditions as indicated in Table 6 and also many advantages over the other techniques, such as HPLC, GC and
PMR such as reduced cost, and speed with high accuracy. Hence, the methods can be used in the routine analysis of drugs in quality control laboratories.
ACKNOWLEDGEMENTS
Authors wish to thank the quality control manager, Inga Laboratories Pvt. Ltd., Mumbai, India, for gift sample of pure die-thylcarbamazine citrate. Prof K. Basavaiah thanks the UGC New Delhi, for the award UGC-BSR faculty fellowship. One of the authors (NS) thanks the authorities of the University of Mysore, Mysore, for providing research facilities and for awarding a UGC NON-NET Ph.D fellowship.
Table 3. Method robustness and ruggedness expressed as intermediate precision
Method DEC taken (µg mL-1)
Method robustness Method ruggedness
Parameters altered
Inter-analysts (%RSD), (n=4)
Inter-instruments (%RSD), (n=4) Volume of DDQ / DNP mLa
%RSD (n=3)
Reaction timeb %RSD (n=3)
A
40.0 1.26 1.12 1.35 1.63
60.0 1.78 1.25 2.05 1.84
80.0 2.09 1.13 2.12 2.98
B
40.0 0.93 1.27 1.12 1.36
60.0 1.85 1.08 0.96 1.21
80.0 1.52 2.09 1.89 2.35
aIn method A, the volumes of reagent were 0.75±0.2 mL and in method B, the volumes were 1±0.2. bThe reaction times were 1±0.2 min in both methods. Table 4. Results of analysis of formulations by the proposed methods
Formulation analyzed Label claim
Found* (Percent of label claim±SD) Official method Proposed methods
Method A Method B
Banocide Forte tablets 100 mg per tablet 99.3±1.27
100.9±0.93 101.6±1.54 t = 2.28 t = 2.58
F = 1.86 F = 1.47
Banocide syrup 120 mg per 5 mL 102.4±1.09
103.5±1.13 102.9±1.74 t = 1.57 t = 0.79
F = 1.07 F = 1.12
*Mean value of five determinations. Tabulated t-value at the 95% confidence level is 2.77. Tabulated F-value at the 95% confidence level is 6.39. Table 5. Results of recovery study via standard addition technique
Method Formulation studied
DEC in formulation, µg mL-1
Pure DEC added, µg mL-1
Total found, µg mL-1
Pure DEC recovered* Percent±SD
A
Banocide Forte tablets
20.18 20.18 20.18
10 20 30
30.09 40.26 50.48
99.7±1.54 100.2±0.98 100.6±1.59
Banocide syrup
20.70 20.70 20.70
10 20 30
31.40 41.47 52.32
102.3±1.52 101.9±0.97 103.2±0.59
B
Banocide Forte tablets
20.32 20.32 20.32
10 20 30
29.84 40.76 49.91
98.4±1.49 101.1±1.19
99.2±0.54
Banocide syrup
20.58 20.58 20.58
10 20 30
30.98 41.72 52.40
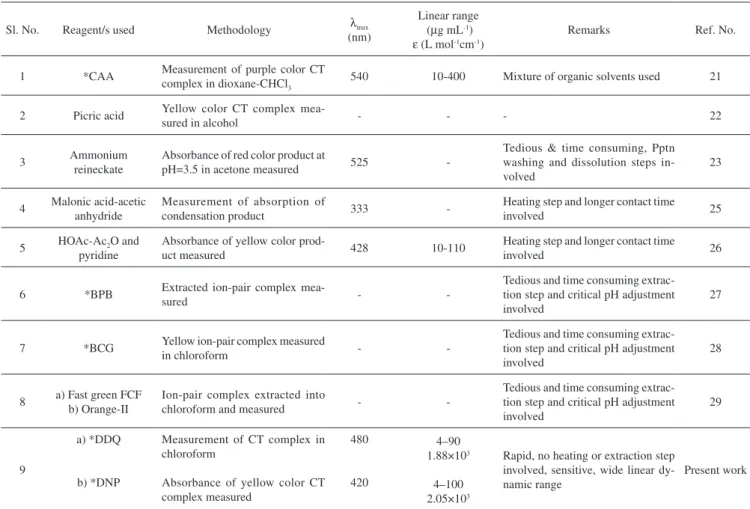
Table 6. Comparison of performance of the present methods with the existing methods
Sl. No. Reagent/s used Methodology λmax (nm)
Linear range (µg mL-1) ε (L mol-1cm-1)
Remarks Ref. No.
1 *CAA Measurement of purple color CT complex in dioxane-CHCl3
540 10-400 Mixture of organic solvents used 21
2 Picric acid Yellow color CT complex
mea-sured in alcohol - - - 22
3 Ammonium reineckate
Absorbance of red color product at
pH=3.5 in acetone measured 525
-Tedious & time consuming, Pptn washing and dissolution steps in-volved
23
4 Malonic acid-acetic anhydride
Measurement of absorption of
condensation product 333
-Heating step and longer contact time
involved 25
5 HOAc-Ac2O and pyridine
Absorbance of yellow color
prod-uct measured 428 10-110
Heating step and longer contact time
involved 26
6 *BPB Extracted ion-pair complex
mea-sured -
-Tedious and time consuming extrac-tion step and critical pH adjustment involved
27
7 *BCG Yellow ion-pair complex measured
in chloroform -
-Tedious and time consuming extrac-tion step and critical pH adjustment involved
28
8 a) Fast green FCF b) Orange-II
Ion-pair complex extracted into
chloroform and measured -
-Tedious and time consuming extrac-tion step and critical pH adjustment involved
29
9
a) *DDQ
b) *DNP
Measurement of CT complex in chloroform
Absorbance of yellow color CT complex measured
480
420
4–90 1.88×10³
4–100 2.05×10³
Rapid, no heating or extraction step involved, sensitive, wide linear dy-namic range
Present work
*CAA-chloranilic acid, BCG-bromocresol green, BPB-bromophenol blue, DDQ-2,3-dichloro, 5,6-dicyano-p-benzoquinone and DNP-2,4 -dinitro phenol.
REFERENCES
1. Swinyard, E. A.; Remington’s Pharmaceutical Sciences, Mack Publish-ing Company: Easton, 1990, p. 1242.
2. Rollo, L. M.; The Pharmacological Basis of Therapeutics, Macmillan: New York, 1985, p. 1010.
3. The British Pharmacopoeia, Her Majesty’s Stationery Office, London, England, 1988, p. 190.
4. United States Pharmacopoeia, Monographs, (USP30-NF25 p.1929), Pharmacopoeial forum, Vol. 28, p. 1098.
5. Rao, G. R.; Raghuveer, S.; Khadgapathi, P.; Indian Drugs 1986, 24, 37. 6. Nene, S.; Anjaneyulu, B.; Rajagopalan, T. G.; J. Chromatogr., Biomed.
Appl. 1984, 308, 334.
7. Pfaff, M. C.; Gayral, P.; Mahuzier, G.; J. Chromatogr. 1978, 150, 155. 8. Joseph, R. M. J.; Lawrence, F.; J. Pharm. Biomed. Anal. 2001, 26, 665. 9. Mathew, N.; Kalyanasundaram, M.; Acta Trop. 2001, 80, 97.
10. Mahesh Reddy, J.; Jeyaprakash,M. R.; Madhuri, K.; Meyyanathan, S. N.; Elango, K.; Ind. J. Pharm. Sci. 2011, 73, 320.
11. Krishna Vamsi, M.; Jayalakshmi, B.; Vijay, A. R.; Sandeep, C.; Int. J. Pharm. Sci. Res. 2012, 3, 3347.
12. El-Obeid, H. A.; Spectrosc. Lett. 1984, 17, 361.
13. Jezzy, W. J.; Dina B.; Frank, A. S.; Paol, E. S.; Mette, K. A.; J. Pharm. Biomed. Anal. 1996, 14, 543.
14. Walash, M. I.; Rizk, M. S.; Ibrahim, F. A.; J. AOAC Int. 1985, 68, 532. 15. Campbell, M. J. M.; Demetriou, B.; Jones, R.; Analyst 1980, 105, 605. 16. Abigail, W.; Patrick, B.; Shannon, H.; Marco, M.; Brennan, E. B.; Domi-nique, M.; Thomas, G. S.; Marya L.; PLoS Neglected Trop. Dis. 2011,
5, e1005.
17. Bhanumathi, L.; Wadodkar, S. G.; Kasture, A. V.; Indian Drugs 1981,
18, 204.
18. Wahbi, A. M.; el-Obeid, H. A.; Gad-Kariem, E. A.; Farmaco Prat. 1986,
41, 210.
19. Rizk, M.; Walash, M. I.; Ibrahim, F.; Spectrosc. Lett. 1984, 17, 423. 20. Michael, U. A.; Kenneth, C. O.; Anthony, A. A.; Chem. Pharm. Bull.
1999, 47, 463.
21. Ramachandran, M.; Curr. Sci. 1972, 41, 890. 22. Basu, K.; Dutta, B. N.; Ind. J. Pharm. 1961, 23, 326.
23. Refaat, I. H.; El-Kommos, M. E.; Farag, H. H.; El-Rabat, N. A.; Bull. Pharm. Sci., Assiut Univ. 1987, 10, 85.
24. Bulbule, M. V.; Kasture, A. V.; Wadodkar, S. G.; Indian Drugs 1981, 19, 27.
25. Bhuee, G. S.; Rastogi, S. N.; Jetley, U. K.; Singh, J.; East. Pharm. 1981,
24, 19.
26. Rao, K. N.; Subrahmanyam, D.; Ind. J. Med. Res. 1970, 58, 746. 27. Vadodaria, D. J.; Vora, M. N.; Mukherji, S. P.; Ind. J. Pharm. 1968, 30,
41.
28. Sastry, C. S. P.; Aruna, M.; Reddy, M. N.; Sankar, D. G.; Ind. J. Pharm. Sci. 1988, 50, 140.
29. Prashanth, K. N.; Basavaiah, K.; Acta Pol. Pharm. 2012, 69, 213. 30. Basavaiah, K.; Kalsang T.; Vinay, K. B.; Croat. Chem. Acta 2010, 83,
415.
31. Elmorsy, K.; Talanta, 2008, 75, 1167.
32. Sameer, A. M. A.;Basavaiah, K.; Int. J. Anal. Chem.2011, 2011, 1, Article ID 619310.
35. Raghu, M. S.; Basavaiah K.; Vinay, K. B.; Bull. Chem. Soc. Ethiop.
2012, 26, 319.
36. Basavaiah K.; Abdulrahman S. A. M.; Thai J. Pharm. Sci. 2010, 34, 134. 37. Cijo, M. X.; Basavaiah, K.; Sameer, A. M. A.; Vinay, K. B.; Chem. Ind.
Chem. Eng. Q. 2011, 17, 469.
38. Raghu, M. S.; Basavaiah, K.; J. Assoc. Arab Univ. Basic Appl. Sci. 2012,
12, 33.
39. Abou A. F. M.; Il Farmaco 2000, 59, 771.
40. Douglas, A. S.; Donald, M. W.; Principles of Instrumental Analysis, Holt Rinehart & Winston: New York, 1971, p. 104.
![Figure 2. Absorption spectra of DEC base-DNP complex (- -) [80 µg mL -1 DEC] and blank (- -)](https://thumb-eu.123doks.com/thumbv2/123dok_br/18986498.459065/2.892.468.786.861.1089/figure-absorption-spectra-dec-base-dnp-complex-blank.webp)