1. Introduction
To deposit titanium ilms, samples were positioned on an isolated alumina disc totally enclosed in a metallic cage. This technique is known as cathodic cage deposition which ensures that plasma acts on the cage and not on the samples surfaces eliminating problems inherent in conventional nitriding1-4. It also allows the treatment of metallic and insulating materials, as well as the deposition of layers on different substrates. This technique uses the hollow cathode effect5 which occurs in the holes of the metallic cage to increase the eficiency of the treatment, thus making it possible to obtain different layers on any kind of substrate, based on the material of the cage as well as the gaseous mixture used. This technique, developed in our laboratory, was used very successfully in different studies1,4,6. Depending on the treatment temperatures used the cathodic cage ilms obtained by this process exhibit great uniformity, roughness control and crystallinity. The great advantage of this process is that it is very versatile, simple and low cost.
Titanium nitride (TiN) produces a large increase of surface micro-hardness in materials, besides reducing the friction
coeficient, providing a huge increase in the lifetime of components and tools employed in metal mechanical industry.
Due to its importance, a great number of techniques was used to produce TiN ilms, as dip-coating, sol-gel, thermal oxidation, electron beam, sputtering, CVD, PECVD, MOCVD, BEM. In conventional deposition processes, the pressure is very low, about 10–3 mba7-10.
Thin ilms of Titanium oxide (TiO) and Titanium dioxide (TiO2) have received a great deal of attention worldwide due to their numerous applications in several ields, mainly because of properties such as chemical stability, low toxicity, relatively low cost, high refractive and permittivity index, broadband valence, good chemical stability and high transmittance1,2,4,9. These ilms crystallize in phases such as anatase, bruquita and rutile, and depending on the relationship between these phases as well as the thin ilm formed, quite different properties are presented. Many studies have focused on the dependency of relationships between different phases on preparation methods and deposition parameters. Each one of these phases has its own intrinsic properties leading to different applications. TiO2 in anatase phase is considered
Thin Tin and Tio
2Film Deposition in Glass Samples by Cathodic Cage
Rômulo Ribeiro Magalhães de Sousaa, Francisco Odolberto de Araújob,
Thercio Henrique de Carvalho Costac*, Igor Oliveira Nascimentoc, Francisco Eroni Paes Santosd,
Clodomiro Alves Júniorb, Michelle Cequeira Feitore
aGrupo de Pesquisa em Materiais e Metrologia, Departamento de Mecânica, Instituto Federal
de Educação, Ciência e Tecnologia do Piau – IFPI, Teresina, PI, Brazil
bDepartamento de Ciências Ambientais, Universidade Federal Rural do Semi-Árido – UEFRSA,
Mossoró, RN, Brazil
cLaboratório de Processamento de Materiais por Plasma – Labplasma, Departamento de Engenharia
Mecânica, Universidade Federal do Rio Grande do Norte – UFRN, CEP 59072-970, Natal, RN, Brazil
dDepartamento de Física, Universidade Federal do Piauí – UFPI, Teresina, PI, Brazil eDepartamento de Engenharia Têxtil, Universidade Federal do Rio Grande do Norte – UFRN,
CEP 59072-970, Natal, RN, Brazil
Received: August 12, 2014; Revised: March 04, 2015
Thin nitride and titanium dioxide ilms were produced using an innovative technique called cathodic cage depositon. Uniformity, three-dimensionality and high rate deposition are some of the advantages of this technique. In this study we discuss the inluences of temperature, treatment time and gaseous atmosphere on the characteristics of the deposited ilms. The TiN (titanium nitride) and TiO2 (titanium dioxide) ilms were produced using a high deposition rate of 2,5 µm/h at a work temperature and pressure of 400°C and 150 Pa respectively. EDS technique was used to identify the chemical composition of the thin ilm deposited, whilst Raman spectroscopy indicated the phases present conirmed by DRX analysis. The thickness of the deposited ilms was studied using electron microscopy scanning. The results based on the deposition parameters conirm the great eficiency and versatility of this technique, which allows a uniform three-dimensional ilm deposition on any material without the appearance of stress. Compared to other techniques, cathodic cage deposition enables deposition at lower temperatures and higher pressures.
one of the best photocatalysts with remarkable activity and non-toxic properties10. It is also used in photochemical solar cells2 and as gas sensors6. Photons with energy equal to or higher than its gap (~3,2 eV) are capable of triggering photo activation in TiO2 which creates electron pairs/holes in the conductive (BC) and valance (BV) bands of TiO210.
Rutile, another structural phase of TiO2, has high resistivity and high dielectric constant, and is used in the manufacture of capacitors in microelectronic devices. Rutile is also an important biocompatible material11. Many methods have been employed to deposit thin TiO2 ilms. Among these are the Ti(OiPr)4 hydrolysis sol-gel method, followed by 500 – 600 ºC calcination, chemical vapor deposition (CVD), physical vapor deposition (PVD), chemical bath deposition (CBD), reactive cathode pulverization and atomic layer deposition (ALD)12-14. Chemical vapor deposition assisted by plasma (PECVD) has also been used to grow TiO2 ilms on a great variety of substrates15.
In this study we discuss the inluences of temperature, treatment time and gaseous atmosphere on the characteristics of the deposited ilms.
2. Material and Methods
Thin ilm deposition was performed using conventional nitriding equipment with the addition of a double cathodic cage. For deposition, a continuous high voltage DC source (1500 V, 2 A), as well as an austenitic stainless steel cylindrical vacuum chamber (30 cm in diameter and 40 cm in height), (Figure 1) were used. The sample was placed on an insulating alumina disc (Figure 1). Plasma was produced in the cathodic cage, which works as a hollow cathode (the wall chamber is the anode) and not directly on sample surfaces, which remain as a loating potential positioned on an insulating surface.
Glass samples measuring 20 mm × 20mm × 2 mm were submitted to a cleaning process of irstly, a KOH solution followed by a HNO3 solution and secondly, to an ultrasonic bath with acetone, before being positioned in the reactor for deposition. The Glass is common composed by 72% silica dioxide (SiO2), 14% Sodium oxide (Na2O); 9% Calcium Oxide (CaO); 4% Magnesium Oxide (MgO);
0,7% Aluminium Oxide (Al2O3) and 0,3% Potassium Oxide (K2O). For deposition, a double cathodic cage was used to increase the rate of deposition. The cages, comprising of two concentric cylinders (outer and inner), were manufactured from a 2 mm thick grade 2 titanium sheet. The outer cage measured 75 mm × 55 mm (diameter and height), and the inner cage measured 45mm × 35 mm (diameter and height). The walls of the cages were punctured with 8 mm diameter, 9 mm equidistant holes. The cages were then sanded, polished and plated with a solution containing 50 ml of HNO3, 25 ml of HF and 425 ml of water in a Sonic-Teck ultrasonic cleaning instrument for 10 minutes. Finally the cages were washed in acetone and dried using a common dryer, Figure 1. The samples were positioned in the inner cage. The shortest distance between the samples and the wall was 25 mm. An insulating disc was placed between the cathode and the samples to maintain same in loating potential.
The chamber was cleaned irstly with an argon injection and subsequently by evacuation process. This operation was repeated twice. Prior to deposition, sample surfaces underwent pre sputtering to remove oxides. After cleaning, the deposition process was initiated under the following conditions:
TiN deposition:
- 12 sccm H2 and 4 sccm N2/H2 (being 80% of N2) mixture;
- 350°C and 420°C temperatures; - 1.5, 2 and 3 hours duration; and - 150 Pa working pressure. TiO2 deposition:
- Two mixtures:
o 6 sccm Ar adding 6 sccm H2 and 3 sccm of O2; o 3 sccm Ar adding 9 sccm H2 and 3 sccm O2. - 350°C, 370ºC, 400°C, 420°C and 450ºC temperatures; - 2, 2.5, 3, 4 and 6 hours duration; and
- 150 Pa working pressure.
Phase composition and texture were analyzed using Raman Spectroscopy (laser 785 – Perkin Elmer) and X-Ray Diffraction (DRX) techniques. Raman Spectra were obtained using a mono grade Bruker Senterra spectrometer equipped
with a charge-coupled device as well as a detection system (CCD). A solid state 785 nm laser was used for excitation. The lens of an Olympus microscope with a focal distance of f = 20,5 mm and numerical gap of Na = 0,35 was used to focus the laser beam on the sample surface. Gaps in the spectrometer were created to obtain a 3 cm–1 resolution. The laser power was approximately 25 mW on the sample surface and the recording time was 20 seconds with twenty accumulations.
DRX analyses described were performed using Cu Kα lines with a wave length of 0.154 nm operated in a 40 KV Shimadzu model XRD-6000 X-ray diffractometer. To observe the morphology of the nitrited layer, an Olympus BX60M microscope, coupled with a digital camera, and Image Pro Plus software were employed.
Layer thickness was observed through electronic scanning microscopy. A Shimadzu electronic microscope, model SSX-550, coupled with EDS, was used to identify the chemical composition of deposited ilm, as well as visualize and measure deposited nitrited layer thickness on cross sectional cuts of nitrited samples.
3. Results
3.1. Titanium nitride deposition
The Raman pattern shown in Figure 2 indicates typical titanium nitride ilms deposited on glass samples under all treatment conditions using a double titanium cage. The 210, 302 and 568 cm–1 peaks observed in the spectra relate to transverse acoustic (TA), longitudinal acoustic (LA) and transverse optical (TO) modes respectively and refer to the irst order Raman vibration.
Figure 3 shows X-ray diffraction patterns of thin ilms deposited on glass samples, using a double titanium cage, at varied temperatures and treatment times. Under all treatment conditions, diffraction patterns conirm the deposition of titanium nitride ilm, as already observed in Raman spectroscopy.
The EDS spectra, Figure 4, shows the chemical composition of the deposited ilms on glass samples, using a double titanium cage, at variable temperatures and times. In these spectra, the percentage of titanium in all deposited surface samples is highlighted.
3.2. Deposition of titanium dioxide
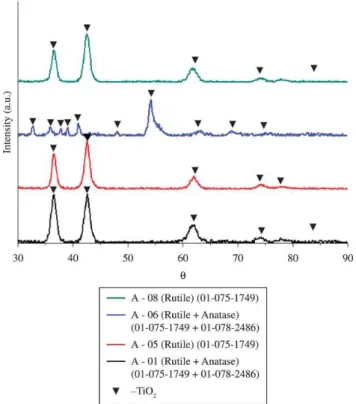
Figure 5 presents X-Ray diffraction patterns of the titanium dioxide films deposited on glass substrates, highlighting the phases present on ilm surfaces, using a double titanium cage and employing varied temperature, time and gas mixture conditions.
The electronic scanning microscope and atomic force microscope images shown in Figure 6 present ilms deposited on glass samples under the following deposition conditions: double titanium cages, work temperature of 370°C, deposition time of 2,5 h, gas mixture of 06 sccm H2 + 06 sccm Ar + 03 sccm O2. The images have been magniied 5000X (Figure 6).
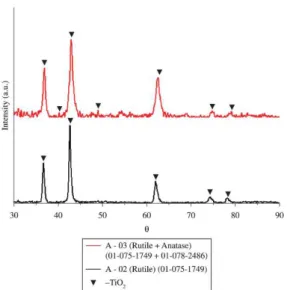
The X-ray diffraction patterns shown in Figure 7 indicate the phases present on dioxide titanium surface ilms deposited
Figure 2. Raman spectra of titanium double cathode cage deposited
samples at 350 and 420ºC and 1,5, 2 and 3 treatment time.
Figure 3. X- Ray diffractogram in rasante incident of deposited
glass sample using two Titanium cages in 350 and 420ºC and 1.5,
2 and 3 treatment time.
Figure 4. EDS graphics showing the chemical composition of the
on glass using double titanium cage at varied temperature and time conditions.
The Raman patterns shown in Figure 8 indicate the phases present on double cage ilm deposited on glass samples at 350°C and two different gas mixtures: a) 06 sccm H2 + 06 sccm Ar + 03 sccm O2, and b) 09 sccm H2 + 06 sccm Ar + 03 sccm, with 4 hour and 6 hour treatment times for both conditions. In samples with a 4 hour deposition time the presence of TiO2 with a mixed phase containing rutile and a small percentage of anatase (bandwidths of 154, 249, 412 and 600 cm–1) was observed on samples deposited with a gas mixture of 06sccm H2 + 06 sccm Ar, and a pure anatase phase
(bandwidths 145, 395 552 e 635 cm–1) with decreasing argon gas to 03 sccm, indicating that an increase in argon lux leads to a faster transition to rutile phase. In samples with a 6 hour deposition time, a TiO2 single phase can be observed in rutile form (bandwidths 154, 259, 414 e 605 cm–1) conirmed mainly by the bandwidths displacement of aproximately 145 cm–1 to 154 cm–1. Another fact that proves the rutile phase formation is the reduction in band intensity, proving a full phase transition from anatase to rutile due to longer deposition time, independent of argon proportion used.
The Raman pattern shown in Figure 9 indicates the results of the 2 hour deposition time, 06 sccm H2 + 06 sccm
Figure 6. (a) MEV and (b) AFM of double titanium cage deposited sample at 370°C - 2,0h – magniication 5000X.
Figure 5. X-Ray diffractogram in rasante incidente of deposited glass sample with double titanium cage at 350° C, where sample A – 01
and A – 05 were the treatment time lasted 4 e 6h, respectively and a gaseous mixture of 06 sccm H2 + 06 sccm Ar + 03 sccm O2. Samples
Raman patterns in Figures 8 and 9 verify the alteration in ilm structure from anatase phase to rutile phase due to the different parameters used during deposition. In the 350°C and 6 hour deposition time scenario, formation of pure rutile phase, independent of argon content, was observed. However, the reduction of deposition time to 4 hours resulted in the formation of TiO2 in anatase + rutile mixed phase, whilst a decrease in argon from 06 sccm to 3 sccm resulted in pure anatase phase formation. It was also possible to obtain a pure rutile phase reducing deposition time to 2 hours, increasing temperature to 400°C, and at a 6 sccm argon lux. Reducing temperature by 30°C produced a mixed anatase and rutile phase. Therefore, we can state that deposition parameters can inluence the deposited TiO2 phase, contributing signiicantly to the formation of the distinct phases observed.
4. Conclusion
The cathode cage nitriding technique consists of a hybrid process of diffusion and deposition. The deposition process is proven by ilm deposition on glass samples where there is no diffusion.
This technique enables a deposition at elevated pressures of 150 Pa which would otherwise not occur in known thin ilm deposition techniques.
Deposited samples generated using 150 Pa, varied temperature and treatment time conditions, and N2/H2 atmosphere, showed a thin ilm of TiN whilst a TiO2 ilm was generated using the same conditions and H2/Ar/O2 atmosphere. Film deposition was conirmed through DRX and Raman techniques, thus proving the eficiency and versatility of this deposition technique.
Anatase phase transition to rutile is supported by increasing temperature, higher deposition times and higher argon luxes. Therefore, it is possible to control the phases present on deposited ilm in accordance with the treatment parameters utilized.
Figure 7. X-Ray diffractogram of double titanium cage deposited
glass sample where sample A – 02 was treated at 400ºC and sample A – 03 was treated at 370ºC and for the treatment time lasted 2 hours
Figure 8. Raman spectra of the double titanium cage deposited
samples at different conditions. The samples A-01 and A-05 were deposited at 350ºC, with a gaseous mixture of 06 sccm H2 + 06 sccm
Ar + 03 sccm O2 and the treatment time lasted 4 and 6 hours,
respectively. The samples A-06 and A-08 were deposited at 350ºC,with a gaseous mixture of 09 sccm H2 + 03 sccm Ar + 03 sccm O2 and
the treatment time lasted 4 and 6 hours, respectively.
Figure 9. Raman spectra of doble titanium cage ilm deposited
samples in different conditions. The samples A-02 and A-03 were deposited with a treatment time of 2 hours, a gaseous mixture of 06 sccm H2 + 06 sccm Ar + 03 sccm O2 and a treatment temperature
of 400 and 370ºC, respectively.
Ar + 03 sccm O2 gas mixture scenario. Sample A – 03 (at 370°C) shows the formation of anatase and rutile mixed phase in the sample due to the presence of a strong intensity 154 cm–1 bandwith. Sample A – 02 indicates TiO
References
1. Alves C Jr, Araújo FO, Ribeiro KJB, Costa JAP, Sousa RRM and Sousa RS. Use of cathodic cage in plasma nitriding. Surface and Coatings Technology. 2006; 201(6):2450-2454. http://
dx.doi.org/10.1016/j.surfcoat.2006.04.014.
2. Sousa RRM, Araujo FO, Ribeiro KJB, Mendes MWD, Costa JAP and Alves C Jr. Cathodic cage of samples with different
dimensions. Materials Science and Engineering. 2007; 465(1-2):223-227. http://dx.doi.org/10.1016/j.msea.2007.03.007.
3. Janosi S, Kolozsvary Z and Kis A. Controlled hollow cathode effect: new possibilities for heating low-pressure furnaces. Metal Science and Heat Treatment. 2004; 46(7-8):310-316.
http://dx.doi.org/10.1023/B:MSAT.0000048840.94386.25.
4. Sousa RRM, Araujo FO, Ribeiro KJB, Dumelow T, Costa JAP and Alves C Jr. Ionic nitriding in cathodic cage of AISI
420 martensitic stainless steel. Surface Engineering. 2008; 24(1):52-56. http://dx.doi.org/10.1179/174329408X271589.
5. Sankaran RM and Giapis KP. Hollow cathode sustained plasma microjets: characterization and application to diamond deposition. Journal of Applied Physics. 2002; 92(5):2406. http://dx.doi. org/10.1063/1.1497719.
6. Sousa RRM, Araújo FO, Ribeiro KJB, Costa JAP, Sousa RS and Alves C Jr. Uniformity of temperature in cathodic cage technique in nitriding of austenitic stainless steel AISI 316. Surface Engineering. 2008; 24(4):313-318. http://dx.doi.
org/10.1179/174329408X326830.
7. Nishimoto A, Bell TE and Bell T. Feasibility study of active
screen plasma nitriding of titanium alloy. Surface Engineering. 2010; 26(1-2):74-79. http://dx.doi.org/10.1179/02670840
9X12454193831760.
8. Yazdani A, Soltanieh M, Aghajani H and Rastegari S. Deposition of Nano Sized Titanium Nitride on H11 Tool Steel using Active
Screen Plasma Nitriding Method. Journal of Nano Research. 2010; 11:79-84. http://dx.doi.org/10.4028/www.scientific.net/
JNanoR.11.79.
9. Li CX, Georges J and Li XY. Active screen plasma nitriding of
austenitic stainless steel. Surface Engineering. 2002; 18(6):453-457. http://dx.doi.org/10.1179/026708402225006240.
10. Araujo FO, Almeida EO, Alves C Jr, Costa JAP and Dumelow T. Deposition of TiO2 on silicon sputtering in hollow cathode. Surface and Coatings Technology. 2006; 201(6):2990-2993.
http://dx.doi.org/10.1016/j.surfcoat.2006.06.015.
11. Liu X, Chu PK and Dhere C. Surface modification of titanium, titanium alloys, and related materials for biomedical applications. Materials Science and Engineering R Reports. 2004; 47(3-4):49-121. http://dx.doi.org/10.1016/j.mser.2004.11.001.
12. Moutinho HR, Albin D, Yan Y, Dhere RG, Li X, Perkins C-S, et al. Deposition and properties of CBD and CSS CdS thin films for
solar cell application. Thin Solid Films. 2003; 436(2):175-180.
http://dx.doi.org/10.1016/S0040-6090(03)00646-1.
13. Wang YL, Li MC and Zhao LC. The effects of vacuum annealing on the structure of VO2 thin films. Surface and Coatings Technology. 2007; 201(15):6772-6776. http://dx.doi.
org/10.1016/j.surfcoat.2006.09.097.
14. Putkonen M, Sajavaara T, Niinistö L and Keinonen J. Analysis
of ALD-processed thin films by ion-beam techniques. Analytical and Bioanalytical Chemistry. 2005; 382(8):1791-1799. http:// dx.doi.org/10.1007/s00216-005-3365-3. PMid:16021420
15. Guillard C, Debayle D, Gagnaire A, Jaffrezic H and Herrmann JM. Physical properties and photocatalytic efficiencies of TiO2 films prepared by PECVD and sol–gel methods. Materials Research Bulletin. 2004; 39(10):1445-1458. http://dx.doi.