Infrared Analysis of Thin Films:
Amorphous, Hydrogenated Carbon on Silion
Wolfgang Jaob,AhimvonKeudell, and ThomasShwarz-Selinger
Max-Plank-Institutf urPlasmaphysik,
EURATOMAssoiation,Boltzmannstr.2,85748 Garhing,Germany
Reeived28February,2000
Theinfraredanalysisof thinlmsonathiksubstrate isdisussed usingtheexampleof
plasma-deposited,amorphous, hydrogenated arbonlayers (a-C:H)onsilion substrates. Theframework
for the optial analysis of thin lmsis presented. The mainharateristi of thinlm optis is
theourrene ofinterfereneeets duetothe oherent superpositionof light multiplyreeted
at the various internal and external interfaes of the optial system. These interferene eets
lead to a sinusoidal variationof the transmitted and reetedintensity. As a onsequene, the
Lambert-BeerlawisnotappliableforthedeterminationoftheabsorptionoeÆientofthinlms.
Furthermore,observablehangesofthetransmissionandreetionspetraourintheviinityof
strongabsorptionbands dueto the Kramers-Kronig relation. For asound data evaluation these
eetshavetobeinludedintheanalysis. Tobeable toextratthefullinformationontainedin
ameasuredoptialthinlmspetrum,anexperimentallymeasuredspetrumhastobesimulated
usingthefull formalisminluding the Kramers-Kronig relation. Infrared absorption spetra and
theresultingkspetraintherangeofthe CHvibrationalbands around3000 m 1
are presented
foravarietyofa-C:Hlayers. Theshapeandthetotalintensityofthepeakarequitesensitivetothe
lmstruture. Soft,polymerlikehydroarbonlayersareharaterizedbyawellstrutured,intense
IR absorptionband, while hard, amorphous, hydrogenated arbonlayers exhibit astrutureless,
broadIRabsorptionband withrelativelow intensity. ThekspetraoftheCH vibrationalbands
anbeonsideredasngerprintfor thetypeofa-C:Hlm.
I Introdution
Infraredabsorption spetrosopyis awide-spreadand
easily aessible tehnique. Above that, infrared
ab-sorptionspetrosopyisnondestrutiveandamatured
eldofmaterialsanalysiswhihiswelloveredinlarge
number of textbooks and monographs [1,2℄. In the
followingthe aronym IRAS will beused for infrared
absorption spetrosopy. This aronym should notbe
onfused with IRRAS whih meansinfrared reetion
absorptionspetrosopyandwhihisusuallyperformed
undergrazinginideneformonolayerlmsona
metal-lisubstrate.
Many laboratories world wide have easy aess to
IRAS instruments and no laborious sample
prepara-tionisneessaryifthinlmsare diretlydeposited on
aninfrared-transparentsubstrate,suhas,forexample,
singlerystallinesilion. Duetotheombinationofthe
mentioned favorable experimental prerequisites IRAS
isoftenapplied fortheanalysisof thinlms. Inmany
suhasessilionis anywayusedor aneasily beused
assubstratematerial. Ifnot,otherinfrared-transparent
materialsanbefoundorthemeasurementanbe
per-reetion[2-4℄. Butbesidesthesemorepratial
argu-ments, thereare sound physial argumentsthat speak
for IRAS asamethod forthin lm analysis. IRAS is
notonlyapableofdeliveringqualitativestrutural
in-formationaboutthebulkofthedepositedmaterial,but
an also, under favorable irumstanes, yield
quanti-tative results of the density of ertain infrared-ative
struturalgroupsorevenofthelayerstoihiometry. A
good examplefor thelatter is the analysis of
plasma-deposited, amorphous, hydrogenated silion layers
(a-Si:H).Thisisbasedonthebasiinvestigationsof
Brod-sky et al. [5℄ whohaveshown that thehydrogen
on-tentofa-Si:HanbedeterminedbyIRAS.Lateritwas
shownbyLangfordetal. [6℄that themethod of
Brod-sky et al., although in prinipal orret, an lead to
errorsoftheorderof75%inthequantitativeanalysis.
These errorswere mainlyattributed to theourrene
of oherentmultiple reetionsin thelm, whih lead
to aninreaseoftheeetiveoptialpathlength. The
quantitativeanalysisofIRASspetraasdemonstrated
fora-Si:Hannotsimplybegeneralizedandthe
phys-ial requirementsforithavetobearefullyhekedin
eah ase. For example, in the above ase of a-Si:H,
thetransitiondipolemoments(`dipolestrength')ofthe
dierent Si-H strething vibrations, whih ontribute
totheabsorptionbandgenerallyusedforanalysishave
beenindividuallydeterminedbyomparisonwithother
quantitativemethods [5,6℄. Ithas tobestressed, that
the transition dipole moments of individual IR bands
an dier signiantly, by up to more than an order
of magnitude. TheanalysisoftheIR spetraof
amor-phous, hydrogenatedarbon(a-C:H)lmsis,however,
oftenbasedontheassumptionthat allvibrations
on-tributing to the CH streth vibrationsloated around
3000m 1
areofthesamemagnitude. Thisledtomany
wrongandambiguousresultsintheaseofa-C:H[7-9℄.
But before suh question an be disussed on a
sound basis, anotherpoint hasto beonsidered. This
isthegeneralanalysisofIRASspetrafrom thinlms.
ManyauthorssimplyusetheLambert-Beerlaw[10,11℄
whihpreditsanexponentialdereaseofthe
transmit-tedintensitywithinreasinglmthikness. Thissimple
analysis isinorretintheaseofthin lmsbeauseit
takesnotintoaountinterfereneeets ofthe
inves-tigated optialsystem. The samewasalreadypointed
out by Langford et al. in the ase of a-Si:H [6℄. A
thin lmon asubstratediersonsiderably from
typ-ial IRAS setups desribed in textbooks where uids,
gases, orratherthiksolids are investigated. Another
related problem is the orret treatment of the
bak-ground. Both of these points will be disussed in the
rstsetionofthisartile.
Theartileis organizedasfollows: in therst
se-tion, the theoretial framework for optial analysis of
transparentthinlmsonasubstrateispresented. This
framework takes into aount interferene eets due
to multiple reetions at the boundaries of the
opti-al system and the ontribution of absorption peaks
to the real part of the refrative index aording to
the Kramers-Kronig relation, whih slightly modies
thebakgroundunderanabsorptionpeak. Theseond
setion presents some results of the infrared analysis
of plasma-deposited,amorphous,hydrogenatedarbon
lms(a-C:H) andaomparison toquantitativeresults
suhastherefrativeindex orthestoihiometry
II Optial analysis of thin lms
Theproblem wearedealingwithis theanalysis ofthe
response of an optial system to inident
eletromag-netiradiation. Inthisontext,thefollowingproesses
play a role: reetion, transmission, absorption, and
interferene. This is treated in great detailin alarge
numberoftextbooksonoptis[10,12℄. Afull,rigorous
treatment of the eletromagneti eld equations may
be foundin thetextbook of Born and Wolf [12℄. The
appliation ofthesamepriniples tothin lmltersis
treatedbyMaleod[13℄. Anexellentdisussionofthe
theoretialframeworkwithrespettothinlmsanbe
foundinthebookofStenzel[11℄whihis,however,only
available inGerman. A highlyondensedEnglish
ver-sionofthesamematerialisfoundinRef. [14℄.The
the-oretial formalism is further treated by Harbeke and
oworkers[15-18℄.
Figure1. Shematirepresentationofthe investigated
op-tialsystem: a thinlm ontopof athik substrate. The
boundaryontheseondsideofthesubstrateisnotshown.
Ingeneral,themediumbehindthesubstrateisidentialto
medium1.
Theunderlyinganalysis isin priniplethesame
ir-respetive of whether we perform transmission or
re-etion measurements orif we measure the hange in
thestateofpolarizationasinellipsometry[19,20℄. The
analysis in the following will be made for a simple
transmissionmeasurementof a thin lm on topof an
infrared-transparentsubstrate. The most simple
on-eivablesystemisthat ofathinhomogeneouslayeron
topofathiksubstrate. ThesystemisskethedinFig.
1. Both,substrateandlayerareharaterizedbytheir
omplexrefrativeindexN =n ik. Wewilluse this
notationthroughoutthisartile. N standsforthe
om-plexrefrativeindex,nistherealandktheimaginary
partof therefrativeindex. k isalso oftendenotedas
extintionoeÆient. Thethinlayeris further
hara-terized byits thiknessd. In real ases, thesituation
may sometimes be abit more ompliated due to the
preseneofathin interfaiallayerof eithernative
sili-ondioxideoramodiedlayerduetoapossiblein-situ
leaningsteppriorto depositionsuh as,forexample,
sputtering. Thisaneasilybeinludedinthe analysis
applyingasimilarproedureaspresentedinthisartile,
butwillnotbefurtherworkedouthere.
If a beam of light hits the interfae of two media
itwill bepartially reeted(subsriptr)and partially
transmitted(refrated)(subsriptt). Letn
1
bethereal
partoftherefrativeindexofmedium1andn
2 thatof
medium2.
1 and
2
aretheanglesbetweenthesurfae
normalandtheinidentandthetransmittedbeams,
re-spetively,asindiatedinFig. 1. Therelationbetween
n 1 sin 1 =n 2 sin 2 (1)
Let further be E
1
the eld vetor of the inident
beam. E
1
is split into 2omponentsE
p and E s [E 1 = (E p;1 ;E s;1
)℄; whih are parallel (p) and perpendiular
(s) to theplane of inidene. Then theamplitude
re-etion and transmission oeÆients r
p , r t and t p , t s
aregivenbyFresnel'sequations [see10-13℄. The
Fres-neloeÆientsdesribetheratiosoftheamplitudesof
therespetivebeamstotheorrespondingamplitudeof
theinidentbeam(e.g.,r
p =E p;r =E p;1 ;r p =reetion
oeÆient for the parallel omponent of E; E
p;r and
E
p;1
beingtheparallelomponentsofthereetedand
inidenteletrield,respetively).
r p = N 2 os 1 N 1 os 2 N 2 os 1 +N 1 os 2 r s = N 1 os 1 N 2 os 2 N 1 os 1 +N 2 os 2 t p = 2N 1 os 1 N 2 os 1 +N 1 os 2 t p = 2N 1 os 1 N 1 os 1 +N 2 os 2 (2)
where the subsripts p and r denote the parallel (p)
andperpendiular(s)omponents. Inthegeneralase,
these oeÆientsare omplex numbers. As intensities
areproportionaltothesquareoftheomplexeld
am-plitudes, the orresponding intensity reetion
oeÆ-ients are given by R
12 = r 12 r 12
, and so on, where
r
denotes the omplex onjugate. The notation R
ij
means thereetion oeÆient for light inident from
medium1ontheinterfaetomedium2. The
transmis-sion oeÆient T
12
is given by 1 - R
12
. It should be
keptin mind that T
12
is, due to it's denition bythe
Poyntingvetor[11,12℄,notequaltot
12 t 12 ,but: T 12
=1 R
12 = N 2 os 2 N 1 os 1 t 12 t 12 (3)
Duetothemultiplereetionsattheinternalinterfaes
apartoftheinidentlightintensitytraversesthethin
lm several times orresponding to an inrease of the
eetive optial pathlength. Weget, therefore, a
an-alytial dependene that dierssigniantly from the
wellknownLambert-Beer law:
I(x)=I
0
exp( x): (4)
TheLambert-Beerlawdesribestheattenuationoflight
travellingthroughisotropi,homogeneousmatter. I(x)
is theremainingintensityat position x, I
0
is the
ini-dentintensity(atpositionx=0), andisthe
absorp-tion oeÆient. is related to the imaginary partof
therefrativeindex(theextintionoeÆientk)ofthe
mediumasfollowing:
= 4k
: (5)
ItisommontodenethereetaneR ofthesample
astheratioofthespeularlyreetedintensityI
r tothe
inidentintensityI
i (R=I
r =I
i
)andthetransmittane
T as T =I
t =I
i
; the absorptane A asA =I
a =I
i , and
the optial satter S asthe ratioof the diusely
sat-tered intensity to the inident intensity (S = I
s =I
i ).
Thereetaneandtransmittaneareoftenalsonamed
reetivity and transmittivity, respetively (For name
onventionssee Ref. 4,page50). Energyonservation
requires:
R+T+A+S=1: (6)
In many pratial appliations, in partiular the ones
onsideredhere,theoptialsatterisnegligibleandEq.
4simpliestoR+T+A=1:
As mentioned above, it is, for a thin-lm system,
notappropriatetouseLambert-Beerlawbeause
mul-tiple reetionsin thethin lmhavetobeonsidered,
asindiated in Fig. 1. Thereetedintensityis
om-posed ofaninnitenumberof individual, multiply
re-etedbeams. Intheaseofanon-absorbinglayer(i.e.,
N
2
is real, N
2 =n
2
)onasemi-innite substrate(this
means that no light returns from the bakside of the
substrate),weanwritethereetaneR as:
R = R
Andthetransmittaneisgivenby:
T =1 R (8)
Itshouldbementionedherethatthesummationofthe
intensitiesorrespondstotheinoherentsuperposition
oftheindividuallightbeamsasopposedtotheoherent
superpositiondisussedfurtherbelow.
Letusonsidernowtheommonaseof
perpendi-ularinidene(
1 and
2
=0)andmedium 1beingair
(N
1
= 1 i0). Lets in addition assume that we are
dealingwithafreestandinglm,i.e. medium3isalso
air (N
3 = N
1
); then R
23
hanges to R
21
. Using the
identityR
12 =R
21
,Eqs. 7and8simplify to:
R= 2R
12
1+R
12 = (n 2 1) 2 n 2 2 +1 (9) T = 1 R 12
1+R
12 = 2n 2 n 2 2 +1 (10)
TheaboveonsiderationsleadingtoEqs. 7to10were
made for anon-absorbing medium. Foran absorbing
medium Eqs. 7to 10an be generalizedby replaing
eah ourreneof R
12 , R
21 and T
21
in thederivation
of Eq. 7aordingto:
T 21 !T 21 e d rmand R 12(21) !R 12(21) e d :
The term e d
aountsfor the lossof intensity in a
singlepaththroughourlayerwiththiknessd. isthe
absorption oeÆient that we already know from the
Lambert-Beer law (Eq. 4). This replaement yields
(weagainuseR
12 =R 21 ): R= R 12 [1 e 2d (2R 12 1)℄ 1 R 2 12 e 2d (11) and T= (1 R 12 ) 2 e d 1 R 2 12 e 2d (12)
Asaonsequeneofthemultiplereetionswithinour
thin layer, the transmittane of our system given by
Eq. 12 is notproportionalto e d
as would be
anti-ipated from a simple Lambert-Beer type behavior
a-ording toEq. 4. The transmittaneis onlythen
ap-proximatelyproportionalto e d
, ifthe reetion
o-eÆientsofbothinterfaes(R
12
intheabovease)are
low. Weshouldretainhere,that theappliationofthe
Lambert-Beerlawis,ingeneral,notvalidintheaseof
thin lmoptis. Unfortunately,it has,however,tobe
statedthatitisstillfrequentlyappliedintheliterature.
Thedisussionso farwasmadeon thebasisofthe
involved light intensities. This is orret only, if the
lmsarethikerthantheoherenelengthofthelight.
If the lm thikness beomes muh smaller than the
oherenelength,weannotsimplyaddtheintensities
of the individual light beams to get the total
inten-sity(asdonein thederivationofEqs. 7to12),but we
havetoaddtheamplitudesoftheeletrieldstrength
observingthe atualphase. This leadsto the
appear-ane of interferene eets [11,12,14℄ in the reeted
andtransmittedsignals. Thederivationoftheformulas
forthereetaneandtransmittaneisverysimilar to
thederivationofEq. 7. Butinsteadoftheintensity
o-eÆientsR
ij andT
ij
,weusetheamplitudeoeÆients
r
ij andt
ij
,andwehavetomultiplywiththephase
fa-tore i
foreahtraversalofthelayer. Forthesystem
depited in Fig. 1, we anwrite down the amplitude
reetionandtransmissionoeÆientsinloseanalogy
toEq. 7:
r 123 = r 12 +t 12 e i r 23 e i t 21 +t 12 e i r 23 e i r 21 e r 23 e i t 21 +::: = r 12 +t 12 r 23 t 21 e 2i 1 X j=1 (r 21 r 23 r 12 e 2i ) j 1 =r 12 + t 12 r 23 t 21 e 2i 1 r 21 r 23 e 2i (13) d
Using the identities t
12 t
21
= 1 r 2 12 and r 21 = r 12
whih followfrom Fresnel'sequations, weansimplify
Eq. 13to:
r 123 = r 12 +r 23 e 2i
1+r
12 r 23 e 2i (14)
Correspondinglywend:
t 123 = t 12 t 23 e i
1+r r e 2i
(15)
Thephase2followsfromasimplegeometrial
on-sideration of the phase dierene whih is given by
thepathdiereneoftwoneighboring interferinglight
Theaboveformulas(Eq. 14and15)arevalidforboth
polarizations. Thereetaneandtransmittaneofthe
optialsystemisagaingivenby:
R 123 =r 123 r 123 and T 123 = N x os 3 N 1 os 1 t 123 t 123 (16) R 123 and T 123
desribe the reetane and
transmit-tane through the system depited in Fig. 1, a thin
layeron topof asemi-innite substrate. Wewill
fur-theron allthis treatmenttheoherentdesriptionof
the multiple reetions as opposed to the inoherent
desriptionin Eqs. 7to12. Itisworthnotingthatthe
inoherentdesriptionyieldsthesameresultsassetting
the realpart ofthe phaseoeÆient to zero,asthe
phaserelationisdestroyedbetweenthemultiple
ree-tions,andaddingtheindividualintensitiesofevery
re-etion[15-18℄. Itan beshownthate d
=e +2Im()
.
Inreality,thesubstratehasanitethiknessand
in-troduesanotherinterfae. Inmost asesthemedium
on the bakside of the wafer (medium 4) is idential
to medium 1. If the bakside of the substrate is also
of optial quality, as we so far impliitly assumed for
all involvedinterfaes, we will alsoget reetion from
thebaksideand wehavetoinlude thisin our
analy-sis. Weuseinourexperimentsingeneralsilionwafers
whiharepolishedonbothsides,togetahigherenergy
throughputthroughthewaferand,thus, ahigher
sen-sitivity. Wehave,therefore,toinludethesereetions
inthesilionwaferinouranalysistoo. Ifthebaksideis
rough,reetionsfromthebaksideofthesilionwafer
anbe omitted. The thikness of thesilion waferis,
in general, so thik, that these reetions have to be
treatedinoherently,aordingtoEqs. 11and12.
Inpratie,thisisdonebyinsertingR
123 ,R 321 ,and T 123 , T 321
in Eqs. 11and 12 insteadofR
12 , R 21 , and T 12 , T 21
, respetively. Finally, in real samples, a thin
interfaiallayerofeithernativesiliondioxideora
mod-ied layerdue toapossiblein-situ leaningstep prior
to deposition suh as,forexample,sputtering,maybe
present betweenthe deposited lm andthe substrate.
This anbeinludedin theanalysis in asimilar
man-ner,butisnotexplainedfurtherhere.
Thetotaltransmittaneandreetanethroughour
systemisthengivenby:
T total = T 123 T 34 exp[+2Im( 3 )℄ 1 R 34 R 321 exp[+4Im( 3 )℄ (18) R total =R 123 T 123 T 321 R 34 exp[+4Im( 3 )℄ 1 R 34 R 321 exp[+4Im( 3 )℄ (19) with 3
beingthephaseshiftourringinmedium3(in
fat,foronsistenyreasons in Eqs. 13to 15should
be replaed by
2
and orrespondingly d by d
2 , sine
theyapplytomedium2).
Theseexpressions allow to model the transmission
through an unoated as well as to a oated sample.
Theyare used to model the transmissionthroughthe
unoated referenesample (the silionwafer) T
ref and
theoated sampleT
lm
. InastandardIRAS
measure-ment the transmittane T
exp
is measured relative to
areferenesample (ingeneral,aunoated silion
sub-strate),sothattheexperimentaltransmittaneisgiven
by T exp = T lm =T ref
. By applying the above
formal-ism T
exp
an be diretly ompared to the model
re-sults T mod = (T lm =T ref)mod
. The parametersfor the
model alulation are the omplex refrative indies
and thiknesses of the individual layers. The known
parametersaretheoptialonstantsandthethikness
ofthesilionsubstrateandinterfaelayer,and,in
gen-eral, thethiknessofthedeposited layer. Theyanbe
takenfrom literature ordeterminedbyother methods
suh as ex-situ ellipsometry and prolometry. As
un-knownparameterremainstheomplexrefrativeindex
N lm =n lm ik lm
ofthedepositedlayer. Thesetwo
parametersaredeterminedbyaomputer-basedtting
routinewhihtsthemodelspetrumT
mod
tothe
mea-suredspetrumT
exp .
IR spetra areusually measured overawide
spe-tralrange. Inmostpartsofthespetrumnoabsorption
bands our and the measured transmission depends
only on the real part of the index of refration n
lm
andaonstantontributiontotheextintionoeÆient
k
lm;0
. Thesetwoparametersaretoarst
approxima-tiononsideredtobeonstantoverthemeasured
spe-tral range. Therst stepisto ttheoptialmodel by
avariationofn
lm andk
lm;0
to themeasureddataof
the IR spetrum in the whole rangewhere no expliit
absorptionbands our. Thisonstantindexof
refra-tion n
lm
is denoted n
1
. Afterwards, the imaginary
partk lm =k lm;0 +k lm(!)
of therefrativeindex in
thespetralrangeofthe absorptionbands anbe
al-ulatedfromthemeasuredIRdatausingtheformalism
desribedabove. It hasto betakenintoaount,
how-ever,thatn
lm
isnotonstantinthespetralregionof
theabsorptionband,beausetherealpartoftheindex
of refration n
lm
is onneted to the imaginary part
oftheindexofrefrationk
lm
viatheKramers-Kronig
relation(KKR). Forthealulationof n
lm
(!)from a
knownk
lm
(!) by theKKR,it isin generalneessary
to know the imaginary part k
lm
(!) of the refrative
index in thewhole spetralrange andnot onlyin the
infrared spetral region. If k
lm
(!) anbe only
mea-sured in the infrared, the inuene of the absorption
in the residualspetralregions an be integrated and
introduedintheKKRbyn
1
. Thisyields:
n
lm
(!)=n
1 + 2 P Z infrared sk lm (s) s 2 ! 2 ds (20)
where P meanstheCauhyprinipal value. With this
formula thevariation ofn
lm
(!)in the spetral range
of the absorption bands anbealulated for agiven
k
lm
(!). Theself-onsistentdeterminationofn
lm (!)
beahievedbyaniterativesolutionoftheoptialmodel
andequation(20).
In the following a few model alulations will be
shown to disuss the various optial thin- lm eets
ourringinIRASmeasurements. Theerrorsourring
due to a neglet of various of these thin lm eets
havebeenpreviouslydisussedbyTzolovetal. [21℄for
amorphous,hydrogenatedsilion(a-Si:H)layers. They
found that these errors an be as high as 10%. All
model resultspresentedhere are made for athin lm
ontopofasingle-rystallinesilionwaferwithanative
silion oxidelayerof 2nmthikness. Theoptial
on-stantsforsilionand silionoxidearetakenfrom Ref.
22. As examplesfor theoptial properties of thethin
lms, values typial of plasma-deposited, amorphous,
hydrogenated arbon lms were hosen [23℄. Fig. 2
shows model results for 3 lm thiknesses. The solid
anddashedlinesarefor2typesoflmswithout
absorp-tion (k =0) with refrativeindies of1.5 and 2.0,
re-spetively. Twopointsareremarkable: First,welearly
see the inuene of theinterfereneeets in thethin
layerwhihausethesinusoidalvariationofthe
trans-mittane. Theeetisthemorepronounedthelonger
theoptialpathndis. Seond,thenormalized
trans-mission isalwayslargerthan 1. That means that the
transmittaneof thesilionsubstratewith thinlmis
larger than without it, and the layerworks as a
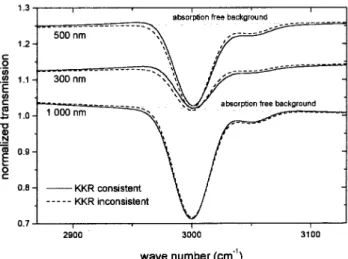
anti-reetion oating. Fig. 3 shows model results for a
lm with n = 1:5 that shows absorption around 3000
m 1
. Forsimpliity twoGaussianlines positionedat
3000 and 3050 m 1
eah with awidth = 20m 1
(FWHM 47m 1
)were assumedto model k
lm (!).
Theintensityofpeak1wassetto0.1andthatofpeak
2 to 0.01. The solid and dashed lines in Fig. 3 show
the model results inluding and negleting the KKR,
respetively. In addition, the`bakgroundline' for an
absorptionfreelayerisshownasdottedlineforthe500
and1000nmthiklms. Theinuene oftheKKRon
the absorptionisnotdramati, but learlydetetable.
Forthe500nmlmtheKKR onsistentspetrumlies
forlowerwavenumbersaboveandforhigherwave
num-bersbelowtheKKRinonsistentspetrum. Itis
obvi-ousthataonsiderationofthebakgroundaordingto
theabsorptionfreemodeloraKKRinonsistent
anal-ysis will auseadistortion ofthe k spetrum. On the
other hand, itwill beimpossible to ahieveagood t
ofthemodeltothemeasuredspetrumifthe
Kramers-Kronig relation is not observed. We an further
re-ognize that thepeak in theKKR onsistentspetrum
is slightlyshiftedto largerwavenumbersomparedto
theKKR inonsistentmodel. Theeets disussedfor
the500nmspetrumareevenmorepronounedinthe
300 nmspetrum,but they aremuh lesspronouned
inthe1000nmspetrum. Thepartiulareetsofthe
KKR vary depending onwhether theabsorption peak
isloatedontherising,falling,oratpartofthe
inter-beenpresentedbyTzolovetal. [21℄ fora-Si:Hlayers.
Figure2. Modelalulationsforathintransparentlmon
top of silion. The simulations are made for
absorption-freelayers (k= 0) withthiknessesof 300, 500and 1,000
nmassuminganrefrativeindexof1.5(solidlines)and2.0
(dashed lines). An additional inlusion of a onstant
ex-tintionoeÆientwouldauseadampingofthepresented
osillatoryomponent.
Figure3. Modelalulations for alm withanabsorption
struturearound3000m 1
. Fortheabsorptionstruture
two peaks with Gaussian line shape were assumed. The
peaksareenteredat3000and3050 m 1
. Thewidthwas
setto20m 1
andthe intensitiesto 0.1 and0.01,
respe-tively. The `bakground' absorptionisset to 0. Thesolid
linesareKKRonsistentandthedashedlinesareKKR
in-onsistent. Theabsorption-free bakgroundfromFig. 2 is
shownasdottedlinefor the500and1,000nmspetrum.
Toonludethismodelingsetionweanstatethat
optialtransmissionspetrahavetobemodeled tobe
able to extrat the omplete ontained information.
This work is abit tedious, but an eÆiently be
per-formed with the help of a omputer program. The
bakgroundin atransmission spetrum is determined
byinterferenesin thethin lmand ontains thus
in-formationonthethiknessand refrativeindexof the
on-distortionsmayour. Thelatterarepartiularly
per-turbingifsmallpeaksnexttolargepeaksshallbe
ana-lyzed,asituation typiallyenountered intheanalysis
of the CH vibrational bands of a-C:H layers around
3000 m 1
. Inanyase where ameaningful ttingof
theabsorptionstrutureshallbeattemptedthespetra
haveto bealulatedKKRonsistent.
III Experimental
Thin lms are deposited by low-temperature plasma
depositioninanECRplasmadeviedesribedreently
[24,25℄. Inshort, mirowavesof2.45 GHzareoupled
toaplasmahamberabout20min diameterthrough
analuminumoxidewindow. Theresonaneeldof87.5
mT is provided by externalmagneti oils. The
mag-netieldattheouplingwindowisabout110mT
de-aying ontinuouslywith inreasing distane from the
window. The plasmaisonned toavolumeofabout
2.7litersbyametalliage,toobtainaertain
deou-pling of the plasma prodution from the proesses at
the growing lmsurfae. Throughan aperture in the
age (35mmin diameter)aplasmabeamisextrated
and direted onto the substrate eletrode. Gas ows
are measured by gas ow ontrollers and range from
15 to 20 sm. The operating pressure is set to 0.2
Pa. Single-rystallinesilionisusedassubstrates. The
substratesaremountedonarf-driveneletrode.
Appli-ationofrfpowerleadstoadself-biaswhihisvaried
between 0 and -250 V. At the low applied pressures,
theplasmasheathisonsideredtobefreeollisions,so
thattheappliedd-self-biasplustheplasmapotential
ofabout10to15Vyieldsdiretlytheionenergy. The
temperatureofthesubstrate holderis monitoredby a
thermoouple.
Thesamplepreparationismonitoredinsituby
real-time ellipsometry. Details of the ellipsometri set-up
were presented elsewhere [26℄. All ellipsometry
mea-surements are performed at a onstant wavelength of
600nm. Evaluation oftheellipsometrydata yieldthe
omplexrefrativeindexofthelayersat600nmandthe
preiselmthikness. Detailsonthedeposition
proe-dure and ellipsometri measurements for these layers
arefoundinRef. 25.
After deposition the samples are investigated by
high energyionbeamanalysis (IBA)todeterminethe
lmstoihiometry[25℄. Infraredabsorptionspetraare
measuredforlms about300nmthikusing aPerkin
Elmer 1760XFouriertransforminfrared spetrometer.
The spetra are reorded in transmission at
perpen-diular inidene in the spetral range from 1000 to
4000m 1
. Alltransmissionmeasurementsare
normal-izedtothetransmissionofanunoatedsilionsubstrate
ofthesamewafer. Fromthetransmissionspetra,the
extintionoeÆientkisdeterminedusingthe
formal-IV Results
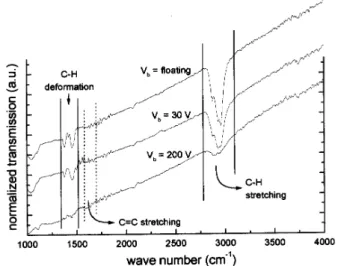
Fig. 4 shows a series of original IRAS spetra. The
lmsweredeposited fromn-butane (n-C
4 H
10
). Shown
are three spetra for deposition at oating potential,
at 30 V and at 200 V d self-bias. All treelayers are
about300nmthik. Therstthingtoreognizeisthe
ontinuous inreaseofthe bakgroundwith inreasing
wave numbers. This inrease is due to the
interfer-ene in the thin lm as was demonstrated in Fig. 2.
It ompares well with the urves for 300 nm in Fig.
2. Superimposedtothisslowlyvaryingbakgroundwe
nd various absorption strutures. In the range from
about1300to 1500m 1
wendC-H deformation
vi-brations,between1500and1700m 1
C=Cstrething
vibrationsfrom the arbonnetwork,and around3000
m 1
C-H strething vibrations. In the following we
will onentrateon theC-H strethingregion beause
themostprominentstrutureoursthereandthis
re-gionisdominantlydisussedinliterature. Alreadyfrom
Fig. 4 it is lear, that this region is also strongly
af-fetedbythedepositiononditionsand,aordingly,by
theresultinglmstruture.
Figure4. Originalmeasurementdataoftheinfrared
trans-mission through silion substrates oated with
plasma-deposited a-C:H layers. The 3 layers are deposited from
n-C4H10applyingdierentbiasvoltagesVb. Thelayersare
between250and 300nmthik. Allspetraarenormalized
relativetothetransmissionofabaresilionsubstratefrom
thesamewafer. Theurvesarevertiallyosetforlarity.
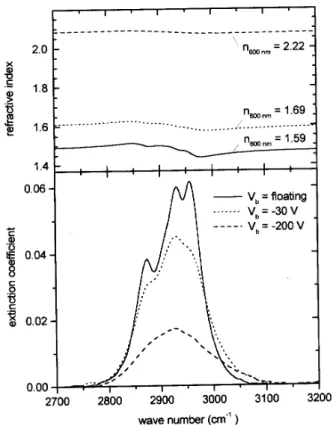
Fig. 5presenttheresultsfortheoptialproperties
ofthese3layersin theregionoftheC-Hstrething
vi-brationsaround3000m 1
. Theupperpartshowsthe
real part of the refrativeindex n and the lowerpart
theextintionoeÆientk. Withinreasingdself-bias
V
b
,orrespondingtoinreasingionenergyduring
depo-sition,therefrativeindexninreasesandkdereases.
d self-bias. The refrativeindex at 600nm, as
mea-sured by in-situellipsometryduring deposition, shows
theidentialtrend,butthevaluesaresomewhathigher.
Theorrespondingvaluesforn(600nm)are1.59,1.69,
and2.25[25℄. Thehydrogenontent[H/(H+C)℄ofthe
samelayersasmeasuredbyionbeamanalysisdereases
forthesamelmsfrom0.48(oatingpotential)to0.31
(-200V)[25℄. Thevariationofnintheregionofstrong
absorptionislearlyvisibleintheupperpartofFig. 5,
partiularlyforthelmdepositedatoatingpotential
(n1:5). Inthisase,thedierenebetweenthe
max-imumandminimumofnisabout5%. Thisvariationof
nisduetomutualdependeneofnandkasexpressed
by the Kramers-Kronig relation (Eq. 20). The
vari-ation of n is less pronouned for the other two lms,
beausetheretheabsorptionisalsolower.
Figure 5. Real (n)and imaginary(k) partof theomplex
refrativeindexforthelayersshowninFig. 4.
Thekspetraofthethree layersaredistintly
dif-ferent. They dier in absolute intensity as well as
in shape. The general trend is that with inreasing
ion energy the maximum intensity and the peak
in-tegral derease while the shape beomes broader and
muhlessstrutured. Theassignmentoftheindividual
CH bands follows the basi investigations of Dishler
[27℄. A verydetailed investigation of the dependene
of the IRAS spetra on deposition onditions was
re-entlypublished byRistein et al. [28℄. The above
de-sribed observation of dereasingintensity and loss of
nestrutureoftheCHvibrationalbandsisavery
gen-disussion of the hange of the IR absorption
stru-turewouldleadtoofarhereandwillbepublished
else-where [30℄. Wean, however,summarizethat the
ob-served hanges reet the hanges of the
mirostru-ture of the deposited layers. With inreasing ion
en-ergy thedensity of sp 3
-CH
3
groups, whih ontribute
verystronglytotheobservedstruture,dereaseswhile
thedensity of sp 3
-CH
2 , sp
3
-CH, and sp 2
-CHx groups
inreases. The infrared absorption ross setions
(of-ten also alled dipole strength) for the latter groups,
in partiular forthe sp 2
-related bands, is signiantly
lowerthanforthesp 3
-CH
3
groups[9,28℄. Togetherwith
theintegral derease of thehydrogen ontent and the
inreaseofsp 2
harater [23℄ thisaountsfor the
de-reaseoftheCHvibrationalbandintensity. Inareent
studyoftheinueneofhydroarbonsouregasonthe
properties ofplasma-deposited thin lms,wefounda
strong orrelation of all investigated physial
proper-ties of the layers[25℄. In partiular, the density, the
refrative index, and the hydrogen ontent exhibit a
very strong orrelation. A omparison of the integral
overtheCHvibrationalbandwiththeotherlm
prop-erties has shown that the IR k spetra of the a-C:H
layersarealsostronglyorrelatedtotheotherlm
pa-rametersandanbeusedasangerprintofthesystem
as demonstrated in Fig. 5. Soft, polymerlike
hydro-arbon layers posses a high hydrogen ontent (up to
morethan60%),alowrefrativeindex(n1:5),alow
density (down to values below 1g m 3
) [23,25℄, and
are haraterized by a well strutured IR absorption
band with maximumvalues fork >0:06around 3000
m 1
. Ontheontrary,hardamorphoushydrogenated
arbonlayers(`diamond-likearbon')possesalow
hy-drogenontent(typiallyaround30%),high refrative
index(n>2),highdensity(>1:8gm 1
)andexhibit
astrutureless,broadIRabsorptionbandwithrelative
lowintensity(k<0:02).
V Conlusions
Thisartiledisussedtheinfraredanalysisofthinlms
hoosingtheexampleofplasma-deposited,amorphous,
hydrogenated arbon layers. First the framework for
the optial analysis of thin lms was presented. The
mainharateristiofthinlmoptisistheourrene
of interferene eets due to the oherent
superposi-tion of light multiply reeted at the various internal
andexternalinterfaesoftheoptialsystem. These
in-terferene eets lead to a sinusoidal variation of the
transmitted and reetedintensityand are ommonly
presentinpublishedIRASspetra. Theyontain
infor-mationonthe refrativeindex andthe lm thikness.
A onsequeneof these interferene eets is that the
Lambert-Beer law is,in general, notappliableforthe
deneofrealandimaginarypartoftheomplex
refra-tiveindexasexpressedbytheKramers-Kronigrelation
leadstoobservablehangesofthetransmissionand
re-etion spetra. A negletof these eets in thedata
evaluationwillauseadistortionofthepeakshapeand
aslightshiftofthepeakposition. Ifameaningful
anal-ysis of the absorption peaks shall be attempted, e.g.,
apeakdeomposition,itisindispensableto modelthe
transmission (or reetion spetra) using the full
for-malisminludingtheKramers-Kronigrelation.
Seond,infrared absorptionspetraand the
result-ingkspetraintherangeoftheCHvibrationalbands
around3000m 1
werepresented. Theshapeandthe
total intensity of the peak are quite sensitive to the
lm struture. Soft, polymerlike hydroarbon layers
are haraterized by awell strutured, intense IR
ab-sorption band, while hard, amorphous, hydrogenated
arbonlayersexhibit astrutureless,broadIR
absorp-tion band with relative low intensity. Theintegralof
thekspetraoftheCHvibrationalbandofa-C:H
lay-ersaround3000m 1
isstronglyorrelatedtotheother
physialparameterofthelayerssuhasdensity,
hydro-gen ontent, and refrative index. Due to the strong
sensitivityofthekspetraoftheCHvibrationalband
tothelmstruture,theyanbeonsideredas
nger-printforthetypeofa-C:Hlm.
Referenes
[1℄ A large numberof textbooks oninfrared spetrosopy
exists in many languages. The following are only an
exemplary seletion: L.J. Bellamy, Advanes in
In-fraredGroupFrequenies,Methuen,London,1968.N.B.
Colthup, L.H. Daly, and S.E. Wiberly, Introdution
to Infrared and Raman Spetrosopy, Aademi Press,
Boston,1990.
[2℄ H. Gunzler and H.M. Heise, IR-Spektroskopie: Eine
Einf uhrung,3.Ed.,VCHVerlag,Weinheim,1996.
[3℄ N.J. Harrik, Internal Reetion Spetrosopy, Wiley,
NewYork,1967.
[4℄ E.D. Palik (Ed.), Handbook of Optial Constants of
SolidsII,AademiPress,Boston,1991.
[5℄ M.H.Brodsky,M.Cardona,andJ.J.Cuomo,Phys.Rev.
B16,3556(1977).
[6℄ A.A.Langford,M.L.Fleet,B.P.Nelson,W.A.Lanford,
andN.Maley,Phys.Rev.B45,13367(1992).
[7℄ A. Grill and V.V. Patel, Appl. Phys. Lett. 60, 2089
(1992).
[8℄ W. Jaob and W. Muller, Appl. Phys. Lett. 63, 1771
(1993).
[9℄ W. Jaob and M. Unger, Appl. Phys. Lett. 68, 475
(1996).
[10℄ H. Gobreht (ed.), Bergmann Shaefer Lehrbuh der
Experimental Physik Bd. III:Optik, 8. Ed., Walter de
Guyter,Berlin, 1987.
[11℄ O.Stenzel,Das D unnshihtspektrum, Akademie
Ver-lag,Berlin1996.
[12℄ M. Bornand E.Wolf,Priniplesof Optis,Pergamon
Press, NewYork,5thEd.,1975.
[13℄ H.A.Maleod,Thin-FilmOptialFilters,AdamHilger
LTD,London,1969.
[14℄ O.StenzelandA.Stendal,OptialPropertiesinWiley
Enilopedia of Eletrial and Eletronis Engineering
Vol.15,J.G.Webster(ed.),JohnWileyandSons,New
York,1999,p.327-336.
[15℄ B.Harbeke,B.Heinz, V.Oermann,andW.Thei,
Far-Infrared Spetrosopy in Optial Charaterization
of Epitaxial Semiondutor Layers, G. Bauer and W.
Rihter(eds.),Springer,Berlin1996,pp.203.
[16℄ P.Grosse,B.Harbeke,B.Heinz,R.Meyer,M.
Oen-berg,Appl.Phys.A39,257(1986).
[17℄ B. Harbeke, B. Heinz, P.Grosse, Appl. Phys.A 38,
263(1985).
[18℄ B.Harbeke,Appl.Phys.B39,165(1986).
[19℄ R.M.A. Azzam and N.M. Bashara, Ellipsometry and
PolarizedLight,ElsevierSienePublishers,Amsterdam
1977.
[20℄ U.RossowandW.Rihter,SpetrosopiEllipsometry
inOptialCharaterization of Epitaxial Semiondutor
Layers,G.BauerandW.Rihter(eds.),Springer,Berlin
1996,pp.68.
[21℄ M.B. Tzolov, N.V. Tzenov, and D.I.
Dimova-Malinovska,J.Phys.D:Appl.Phys.26,111(1993).
[22℄ E.D. Palik, (ed.), Handbook of Optial Constants of
Solids,AademiPress, Orlando,1985.
[23℄ W.Jaob,ThinSolidFilms326,1(1998).
[24℄ B. Landkammer, A. von Keudell, and W. Jaob, J.
Nul.Mater.264,48(1999).
[25℄ T.Shwarz-Selinger,A.vonKeudell,andW.Jaob, J.
Appl.Phys.86,3988(1999).
[26℄ W.FukarekandA.vonKeudell.Rev.Si.Instrum.66,
2029 (1995).
[27℄ B.Dishler,inAmorphousHydrogenatedCarbonFilms
EMRS Symp.Pro. Vol. 17, P. Koidland P.Oelhafen
(eds.),LesEditionesdePhysique,Paris1987,p.198.
[28℄ J.Ristein, R.T.Stief,L. Ley,andW.Beyer, J.Appl.
Phys.84,3836(1998).
[29℄ A.vonKeudelandW.Jaob,J.Va.Si.Tehnol.A15,
402(1997).
[30℄ T.Shwarz-Selinger,A.vonKeudell,andW.Jaob,to