Influence of the Camera Resolution and Distance in
the Measures Made by the Postural
Assessment Software (Sapo)
Yomara Lima Mota1
Luis Mochizuki2
Gustavo de Azevedo Carvalho3
1. Physiotherapy Course of the Catholic University of Brasília – Brasília (DF), Brazil.
2. Physical Activities Sciences Course of the Art School, Sciences and Humanities of the University of São Paulo – São Paulo (SP), Brazil.
3. Master’s and Doctorate Course in Physical Education of the Catholic University of Brasília – Brasília (DF), Brazil.
Mailing address:
Rua 18 sul, lote 8, apto. 1.103, Residencial Ilha de Sicília 71940540 – Águas Claras, DF, Brazil. E-mail: [email protected]
ABSTRACT
Error in measurement of a posture evaluation system is related to the digitalization, camera resolution and distance in relation to the volunteer studied, among others. These errors are summed up during the process and many of them are not possible to be avoided; however, they must be known and quantified. Objective: to quantify the error of the positions measured by SAPO (postural assessment software) in diffe-rent experimental situations. Methods: 16 photos of a 1.40m tall articulated mannequin were taken at the anterior, posterior, right lateral and left lateral planes with 3.2 and 12.0 megapixels resolution cameras, at 3.0m and 5.0m from the model. To quantify the error, the differences between the measurements obtained by SAPO and the ones made directed on the mannequin were calculated. Results: the mean values of the horizontal, vertical, angular and distance measurements are close to zero; however, some angles were larger for the left and right measurements. The 3.2 megapixel digital camera located 3 m away showed the lowest error. The digitalization position is not influenced by the experience of the evaluators. Conclusion: SAPO is
an accurate method for clinicaluse. Further studies are necessary to verify the effect of the position plane
of the volunteer in relation to the camera, the effect of the relocation and the measurement palpation provided by the software.
Keywords: software, posture, evaluation
INTRODUCTION
Postural assessment is the initial step for any physiotherapeu-tic treatment since it is from the observation of the body alig-nment that the hypothesis of load distribution and mechanical
demand on the structures is created(1). However, the postural
assessment is most of the times performed in a subject manner by visual inspection and it depends on the ability and experience
in the interpretation of the results. Fedorak et al.(2) verified the
intra and interexaminer reliability and concluded that the visual inspection of the cervical and lumbar regions is not reliable, especially when procedures applied by different professionals are compared. Thus, the observation of the body alignment by visual inspection is not recommended for the examination of
patients’ posture(3-7).
The need to quantify postural deviations is old and the technological development has enabled the use of relatively
simple instruments for this purpose(1). Postural assessment
through images becomes a more reliable resource to reduce errors caused by subjective posture assessments. The use of photographs for postural assessment is a common proce-dure(8-11), however, it should be carefully used, since the
ap-plied methodology, despite being simple, can present factors which modify the measurement value, that is to say, errors can be introduced in the measurement taken. Therefore, different software, among it the SAPO (postural assessment software), has been developed for postural assessment from the record of digital photographs of the individual in different planes
for measurement of variables, such as: position, length, angle,
gravity center and body alignment(12).
Measurement error of a postural assessment system is related to digitalization, camera resolution, camera distance in relation
to the studied volunteer, among other factors(13-15). These errors
sum up during the methodological procedure and many of them cannot be avoided; however, they should be known and quanti-fied(16-18). Regarding the camera resolution, some authors infer
that high resolution presents higher accuracy when compared to a camera of low resolution for measurements performed with
the Biotonix software(14). Concerning the distance between the
volunteer and the camera, its increase produces lower systematic
error, since lenses distortion becomes lower(13).
Thus, the aim of this study was to assess the effect of the dis-tance between the camera and the evaluee and the level of the image resolution in the mean error of the postural assessment performed by the SAPO. The initial hypothesis is that different situations influence on the error magnitude.
MATERIALS AND METHODS
16 photographs on the posterior, right lateral and left lateral
planes of an articulated 1.4m high mannequin (Figure 1) (Human
Artist Model®
– Drawing mannequin) were taken. The mannequin
was placed next to a plumb line (Ramada®) and perpendicular to
the optical axis of the camera. The images were taken with two digital cameras with different definitions (3.2 megapixels Sony DSC-P52 and 12.1 megapixels Sony DSC-W220). The cameras
were placed parallel to the ground, on a leveled trip od (Nikon®
) ORIGINAL ARTICLE
335 Figure 1. Articulated mannequin (Human Artist Model® –
Drawing mannequin).
whose height was half of the height of the mannequin (0.70m). Only one evaluator performed the recording of the images; however, the digitalization of the points marked on the manne-quin in the software was performed by three individuals; each one performed 30 digitalization points of each analyzed method.
The cameras were placed 3.0m away from the mannequin and subsequently the images were taken and replaced for 5.0m and the image recording was repeated (3m at 3.2Mp, 3m at 12Mp, 5m at 3.2Mp and 5m at 12Mp). The zoom of each camera was not altered and the mannequin was placed in the middle of the image to reduce distortions.
Points determined in the SAPO protocol were marked with white styrofoam 15-mm balls, attached with double-face tape on the mannequin. All points were placed so that the measure-ments values between these points were equal to the SAPO’s reference standard. Whenever there were not reference values, a value which placed the mannequin the closest to the reference standard suggested by the literature was adopted. These points represent anatomic sites on the human body: earlobes, acromion, anterosuperior iliac spine, great trochanter of the femur, knee ar-ticular line, superior border of the patella, tibial tuberosity, medial and lateral malleolus, point between the head of the second and third metatarsal bones, inferior border of the scapula, posterosu-perior iliac spine, calcaneus, calcaneus tendon, posterior medial line of the tibia and also spinal processes of the seventh cervical
vertebra (C7) and of the third thoracic vertebra (T3).
Assessed variables
After the points have been marked on the mannequin, direct
measurement was taken with a goniometer (Cardiomed®) and a
pachymeter (CG®
). The 27 measurements directly and indirectly performed were:
Aligning measurements
Horizontal
Head (AHCA), acromions (AHA), anterosuperior iliac spines
(AHEIAS), head (C7) rigth and left sides (AHCLD and AHCLE), tibial
tuberosity (AHTT), right and left pélvis (AHPLD e AHPLE)
Vertical
Head (acromion) right and left sides (AVCLD and AVCLE), trunk
right and left sides (AVTLD and AVTLE), right and left body (AVCOLD
e AVCOLE).
Angle measurements
Angle
Frontal of the right lower limb (AFMID), frontal of the left lower limb (AFMIE), right Q (AQD),left Q (AQE), right leg/retro foot (APRD), left leg/retro foot (APRE), hip (trunk and lower
limb) right and left (AQLD and AQLE), knee (AJLD and AJLE), ankle
(ATLD and ATLE).
Distance measurement: difference in the length of the lower limbs (DCMI).
Error was quantified through the calculation of the
differ-ences (∆) of the measurement obtained through SAPO with the
measurements directly done on the mannequin. Afterwards, the measurement of the standard error was calculated using the formula:
The angle and distance measurements present variability due to the digitalization method. In this study 90 repetitions of each measure are available. In clinical practice though, it is not possible to perform this many repetitions to obtain an accurate measurement, which makes one question: how many repetitions are necessary to obtain an accurate measurement?
Considering that the variability statistics is exactly the one which provides information on how accurate the measurement is, the presented question can be paraphrased: how many repeti-tions are needed to obtain a measurement with variability close to that verified when using 90 repetitions?
In order to answer this question, the following procedure was adopted:
1. From the 90 repetitions, 1,000 samples with the n = 2 size
were drawn;
2. For each sample, the standard deviation was calculated generating hence a base of 1,000 standard deviations;
3. The mean of the 1,000 standard deviations was calculated; 4. Procedure fro m1 to 3 was repeated, ranging the sample size, from n = 2 to n = 30 (each sample size represents a simula-tion of the use of n repetisimula-tions of the measurement).
5. The mean standard deviation value obtained in step 3 was compared with the standard deviation calculated using the 90 initial observations.
Thus, the closer the mean standard deviation of the sample with 90 repetitions, the more accurate will the measurement be, that is to say, the results will present sufficient variability to provide a more reliable estimation.
RESULTS ANALYSIS
The results are presented with standard error values. After having tested the data normality, the four methods have been compared, namely: with a 3.2Mp camera and a 12Mp camera 3m
and 5m away. Analysis of variance (ANOVA) with Tukey post hoc
RESULTS
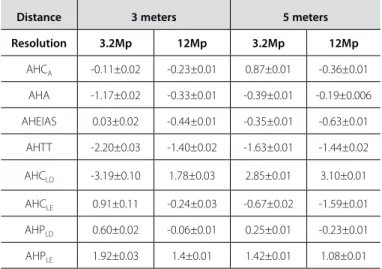
As follows, the standard errors of the horizontal align-ment (Table 1), vertical alignalign-ment (Table 2), angle and dis-tance alignment (Table 3) are presented. Analysis of variance of two factors joined all measurements in a single set. The analysis of the effect of the distance and the image resolu-tion in the standard error of the measurements showed that the distance (p = 0.3) and the level of image resolution (p = 0.09) did not affect the standard errors of the measurements.
The second analysis of variance was separately applied for each of the 27 assessed variables (table 4). Thus, the effect of the interaction between distance and image resolution in 23 variables was observed (p < 0.05). In the majority of the times (52%), the lowest stan-dard error occurred with the 3m distance and 3.2Mp resolution.
The relation between the number of repetitions (digitaliza-tion) necessary to obtain a reliable measurement was assessed In figure 2, the results found for two measurements (AHCA and AHA) are presented. It is observed that with up to 10 repetitions 95% of the accuracy which could have been obtained in case 90 repetitions were used is reached.
DISCUSSION
The aim of the study was to verify the effect of the distance of the camera and the image resolution in the standard error of measurements related to the postural assessment obtained through the SAPO software. Two-way ANOVA did not show main effect of the distance or image resolution in the standard error of
Table 1. Means of the differences and standard errors of the horizontal measure-ments for the four methods.
Distance 3 meters 5 meters
Resolution 3.2Mp 12Mp 3.2Mp 12Mp
AHCA -0.11±0.02 -0.23±0.01 0.87±0.01 -0.36±0.01
AHA -1.17±0.02 -0.33±0.01 -0.39±0.01 -0.19±0.006
AHEIAS 0.03±0.02 -0.44±0.01 -0.35±0.01 -0.63±0.01
AHTT -2.20±0.03 -1.40±0.02 -1.63±0.01 -1.44±0.02
AHCLD -3.19±0.10 1.78±0.03 2.85±0.01 3.10±0.01
AHCLE 0.91±0.11 -0.24±0.03 -0.67±0.02 -1.59±0.01
AHPLD 0.60±0.02 -0.06±0.01 0.25±0.01 -0.23±0.01
AHPLE 1.92±0.03 1.4±0.01 1.42±0.01 1.08±0.01
Head horizontal alignment (AHCA), acromial horizontal alignment (AHA), anterosuperior iliac spines hori-zontal alignment (AHEIAS), tibial tuberosity horihori-zontal alignment (AHTT), head horihori-zontal alignment (C7) right and left sides (AHCLD and AHCLE), right and left pelvis horizontal alignment (AHPLD and AHPLE).
Table 2. Means and standard deviations of the vertical measurements for the four methods.
Distance 3 meters 5 meters
Resolution 3.2Mp 12Mp 3.2Mp 12Mp
AVCLD 0.24±0.01 0.36±0.01 0.64±0.01 1.11±0.01
AVCLE 2.04±0.01 2.61±0.01 2.50±0.01 1.87±0.01
AVTLD -0.06±0.002 -0.31±0.004 0.01±0.003 -0.31±0.003
AVTLE -0.64±0.004 -1.12±0.005 -0.89±0.002 -0.82±0.005
AVCOLD 0.94±0.005 1.17±0.003 1.45±0.002 1.27±0.002
AVCOLE 0.37±0.003 0.17±0.002 0.26±0.002 0.28±0.002
Head vertical alignment (acromion) right and left sides (AVCLD and AVCLE), trunk vertical alignment right and left sides (AVTLD and AVTLE), right and left body vertical alignment (AVCOLD and AVCOLE).
Table 3. Mean of the differences and standard deviations of the angle and dis-tance measurements for the four methods.
Distance 3 meters 5 meters
Resolution 3.2Mp 12Mp 3.2Mp 12Mp
AFMID 0.84±0.01 1.30±0.01 1.32±0.005 1.02±0.01
AFMIE -0.66±0.02 -1.22±0.03 -0.86±0.01 -0.64±0.01
AQD -0.03±0.08 3.24±0.04 4.63±0.02 3.94±0.01
AQE -2.73±0.08 1.48±0.04 1.79±0.02 1.74±0.04
APRD -0.75±0.02 -2.38±0.02 -2.56±0.02 -1.30±0.04
APRE 1.08±0.01 1.41±0.03 2.47±0.02 1.75±0.03
AQLD -1.93±0.01 -2.86±0.01 -2.83±0.005 -3.16±0.008
AQLE -1.11±0.07 -1.63±0.006 -1.22±0.005 -1.12±0.009
AJLD -0.26±0.006 -0.40±0.01 -0.52±0.007 -0.56±0.01
AJLE 1.29±0.009 1.22±0.01 1.53±0.01 1.48±0.01
ATLD 1.61±0.009 2.14±0.003 2.32±0.005 2.27±0.004
ATLE 1.80±0.01 1.72±0.006 1.86±0.004 1.77±0.005
DCMI 0,89±0,01 0,42±0,003 0,47±0,002 0,47±0,003
Frontal angle of the left lower limb (AFMIE), right Q angle (AQD), left Q angle (AQE), leg/right retrofoot angle (APRD), leg/left retrofoot angle (APRE), frontal angle of the right lower limb (AFMID), hip angle (trunk and lower limb) right and left (AQLD and AQLE), knee angle (AJLD and AJLE), ankle angle (ATLD and ATLE), difference in the length of the lower limbs (DCMI).
Table 4. Quantity of variables by method which presents the lowest error among the 23 variables with significant difference.
Method Quantity of variables % with the lowest error
3,2Mp a 3m 12 52%
3.2Mp at 5m 6 26%
12Mp at 3m 1 4%
12Mp at 5m 4 17%
Figure 2. Relative variability of the head horizontal alignment (AHCA) and acromial ho-rizontal alignment (AHA) in relation to the number of repetitions of each measurement.
% mean standar
d de
via
tion in r
ela
tion
to the standr
d de
via
tion af
ter
90 r
epetitions
337
the chosen measurements. Thus, the standard error of a set of measurements for postural assessment does not suffer global effect of the camera distance from the individual, neither of the image resolution. The recommendation for these two fac-tors is very simple: the distance should be sufficient to place the entire body of the individual in the middle of the image and the resolution should be sufficient to clearly show each of the markers. The body image should be centralized to avoid distortion which could occasionally occur due to the lenses curvature, but for the level of analysis used in this study is ir-relevant. Centralizing the image reduces the risk of not showing the entire body of a person in it.
On the other hand, the resolution level allows distinguishing details of the image; in the case of postural assessment, the markers. Regardless of the image resolution, the markers should be visualized in the image. This condition facilitates visualiza-tion and digitavisualiza-tion of the points in the image processing for postural assessment.
Standard error was used as an indicator of measurement accuracy for the postural assessment. The lack of main effect in the set of measurements selected suggests that different photographic cameras and distances between a camera and a person can be used with no alteration in the accuracy of the postural assessment. Such fact ensures that the SAPO system is robust enough to be a system of postural assessment simple and versatile.
In order to determine the measurements error with the SAPO software, the values offered by it were compared from the photos of a mannequin with measurements taken on the mannequin itself (actual measurement). Such errors could be influenced by the data collection method; therefore, different methodologies were applied. The mean values of the errors of the 27 analysed measurements are close to zero, indicating that SAPO is an accurate method for clinical use. Recent studies have
found errors around 0.1º (19,20); however, they used only three
reference points in their methodologies for digitalization of the actual measurements. The advantage of the present study was that it used a mannequin to quantify the measurement error of SAPO in a condition similar to the clinical practice.
The postural assessment systems are different from the ki-netatic assessment systems for having a pre-set representation for some postures which makes it possible to define postural deviations and other body measurements which present clinical meaning. Thus, systems based on photometry are offered to evaluate posture, facilitate and increase assessment reliability.
The Weaving Posture Analysis System (WEPAS) is a system of
bi-dimensional video based on image processing for posture re-cording and analysis during laboratory activities, which presents
an error lower than 1º(21). Another postural assessment system
is the PosturePrint, which presents mean errors for dislocation
between 0.5º and 1.3º, and 0.9 and 1.2mm. The PosturePrint
system enables the accurate measurement of the pelvis (22) and
trunk rotation and translation (23). The BioTonix’s video system for
postural assessment presents mean errors of 1.5º and 3.3mm,
for angle and distance, respectively. The BioTonix’s is also
con-sidered valid, being recommended for postural assessment(14).
The SAPO is accurate for postural assessment and presents errors similar to the ones observed in other software; therefore
it is recommended for clinical postural assessment. However, one should be careful in some measurements, such as in the
Q angle ones. Sacco et al.(24) concluded that computer postural
assessment is reliable concomitantly to goniometry, except for the Q angle, and attributes that the unsatisfactory results found should be due to the fact that this angle involves postures of more than one articular segment (hip, femoropatellar and femorotibial) adding up between each other many freedom degrees, which makes the measurement of this angle difficult.
Besides the Q angle, other measurements presented dif-ferences higher than 1º; this fact may be due to the site of the anatomic marks which range with the segment contour, which may make the visualization of some points difficult and offer difficulty in their digitalization as well. A system which recognized the center of the markers during the process of point marking could minimize this effect.
Iunes et al.(25) report that the computer postural assessment
presents acceptable variability, being recommended for the majority of the angle measurements assessed; however, they also report low reproducibility and hence the follow-up of the pre and post-results may not be sufficiently reliable. The au-thors discuss that this low reproducibility may be due to the environment preparation and luminosity, tripod, camera and volunteer placement, among other elements. It was observed that alterations in the camera distance in relation to the object as well as the camera resolution have no effect when all the measurements offered by the software are considered; however, when these measurements are observed separately; the best choice is shorter distance and low resolution.
Still concerning the camera positioning, Paul and Douwes(13)
infer that the bigger the distance between the volunteer and the camera, the shorter the systematic error since the lenses presents less distortion. It was observed during the digitalization that the higher the distance the higher the need to use the zoom in the software (100%), which could have caused image distortion increasing hence error in some measurements. Regarding the
resolution, Normand et al.(14) found high reliability when
com-pared high and low resolution cameras; however, in their study the authors do to report which resolutions were used.
Santos et al.(26), with the aim to test the inter-examiner
con-cordance of the photogrametry applied to evaluate postural alignment in chidren, used some resources, such as the devising
of a target (Pimaco®
adhesive) on the marker (styrofoam marker) and standardization of the zoom in the software in 100%, and believe that such devices are crucial to offer greater accuracy to the analyses and reduce the variability in the measurements. The present study corroborates that the use of a target is an important device to guarantee accuracy to the analyses; ho-wever, zooming should be avoided.
The process of manual digitalization of the marks may in-duce to measurement variability; however, it has been estab-lished that manual digitalization is reliable between evaluators
and at different days(27). Since variability can be understood
as quantification of how accurate the angle (28), alignment or
been obtained in case 90 repetitions had been used is reached. Such data facilitates the digitalization process performed in the clinical practice.
An inanimate object termed a mannequin was used and the measurements taken from this mannequin were performed with a goniometer and a pachymeter. Such methods also present errors which in the present study have been disconsidered. Since a mannequin has been used, other error sources such as repo-sitioning, palpation of the anatomic marks and others, have not been quantified.
CONCLUSION
The standard error of a set of measurements for postural as-sessment does not suffer global effect of the distance of the camera until the volunteer neither of the image resolution. It
was observed that the mean errors are generally close to zero, especially when they are observed through a 3.2Mp camera used 3m away from the volunteer. The SAPO is an accurate method for clinical use; yet, further studies are necessary to verify the influence of the positioning plane of the volunteer in relation to the camera as well as the effect of the repositioning and palpa-tion in the measurements offered by the software.
ACKNOWLEDGEMENTS
We thank Vânia Ballo for her subvention of the mannequin used in this study.
All authors have declared there is not any potential conflict of interests concerning this article.
REFERENCES
1. Ferreira EAG. Postura e controle postural: desenvolvimento e aplicação de método quantitativo de avaliação postural. Teste de doutorado. Faculdade de Medicina da Universidade de São Paulo. São Paulo 2005.
2. Fedorak C, Ashworth N, Marshall J, Paull H. Reliability of the visual assessment of cervical and lumbar lordosis: how good are we? Spine 2003;28:1857-9.
3. Burton AK, Edwards V, Skyes DA. Invisible skin marking for testing palpatory reliability. Journal of Manual Medicine 1990;5:27–9.
4. Bryan JM, Mosner E, Shippee R, Stull MA. Investigation of the validity of postural evaluation skills in assessing lumbar lordosis using photographs of clothed subjects. J Orthop Sports Phys Ther 1990;12:24-9.
5. Bullock-Saxton J. Postural alignment in standing: A repeatability study. Aust J Physiother 1993;39:25-9.
6. Billis EV, Wright FCC. Reproducibility and repeatablity: errors of three groups of physiotherapists in locating spinal levels by palpation. Manual Therapy 2003;8:233-2.
7. Harlick JC, Milosavljevic S, Milburn PD. Palpation identification of spinous processes in the lumbar spine. Manual Therapy 2007;12:56–62.
8. Watson AWS. Procedure for the production of high quality photographs suitable for recording and evaluation of posture. Rev Fisioter Univ São Paulo 1998;5:20-6.
9. Tommaselli AMG, Silva JFC, Hasegawa JK, Galo M, Dal Poz AP. Fotogrametria: aplicações a curta distância. In: Meneguetti Jr M, Alves N, editores. FCT 40 anos Perfil cientifico e educacional. UNESP-FCT. Presidente Prudente: UNESP; 1999. p. 147-59.
10. ASPRS – American Society for Photogrammetry and Remote Sensing. What is ASPRS [homep-age na Internet]. Bethesda: American Society for Photogrammetry and Remote Sensing; 2000 [atualizada em 16 Nov 2006; acesso em Out 2006]. Disponível em: http://www.asprs.org/ society/about.html
11. Van Niekerk SM, Louw Q, Vaughan C, Grimmer-Somers K, Schreve K. Photographic measure-ment of upper-body sitting posture of highschool students: a reliability and validity study. BMC Musculoskelet Disord 2008;9:113.
12. Duarte M. “Portal do Projeto Software para Avaliação Postural”. São Paulo. 2006; De: http://sapo. incubadora.fapesp.br/portal
13. Paul JA, Douwes M. Two dimensional photographic posture recording and description a validity study. Applied Ergonomics 1993;24:83-90.
14. Normand MC, Harrison DE, Cailliet R, Black H, Harrison DD, Holland B. Reliability and
measure-ment error of the BioTonix video posture evaluation system – Part I: Inanimate Objects; J Manipulative Physiol Ther 2002;25:246-50.
15. Dunk MN, Lalone J, Callaghan JP. Implications for the use of postural analysis as a clinical diagnostic tool: reliability of quantifying upright standing spinal postures from photographic images. J Manipulative and Physiol Ther 2005;28:386-92.
16. Verducci FM. Measurement concepts in physical education. C.V. Mosby Company, 1980. 17. Baumgartner TA, Jackson AS. Reliability and objectivity, chapter 4, In: Measurement for
evalu-ation in physical educevalu-ation and exercise science. Brown Publishers, 1991.
18. Trischler KA. Medida e avaliação em educação física e esportes de Barrow & McGee. Barueri, SP: Manole, 2003.
19. Braz RG, Goes FP, Carvalho GA. Confiabilidade e validade de medidas angulares por meio do software para avaliação postural. Fisioter Mov 2008;21:117-26.
20. Ferreira EAG, Duarte M, Maldonado EP, Burke TN, Marques AP. Postural assessment software (PAS/SAPO): validation and reliability. Clinics 2010;65:675-81.
21. Choobineh A, Hosseini M, Lahmi M, Sharifian S, Hosseini AH. Weaving posture analyzing system (WEPAS): introduction and validation. International Journal of Industrial Ergonomics 2004;34:139-47.
22. Harrison DE, Janik TJ, Cailliet R, Harrison DD, Normand MC, Perron DL, et al. Upright static pelvic posture as rotation and translations in 3-dimensional from three 2-dimensional digital images: validation of a computerized analysis. J Manipulative Physiol Ther 2008; 31:137-45. 23. Harrison DE, Janik TJ, Cailliet R, Harrison DD, Normand MC, Perron DL, et al. Validation of a
computer analysis to determine 3-D rotations and translations of the rib cage in upright posture from three 2-D digital images. Eur Spine J 2007;16:213-8.
24. Sacco ICN, Alibert S, Queiroz BWC, Pripas D, Kieling I, Kimura AA, et al. Confiabilidade da fotogrametria em relação a goniometria para a avaliação postural de membros inferiores. Rev Bras Fisioter 2007;11:411-1417.
25. Iunes DH, Castro FA, Salgado HS, Moura IC, Oliveira AS, Bevilaqua-Grossi D. Confiabilidade intra e interexaminadores e repetibilidade da avaliação postural pela fotogrametria. Rev Bras Fisioter 2005;9:327-34.
26. Santos MM, Silva MPC, Sanada LS, Alves CRJ. Análise postural fotogramétrica de crianças saudáveis de 7 a 10 anos: confiabilidade interexaminadores. Rev Bras Fisioter 2009;13:350-5. 27. Sullivan D, Bryden P, Callaghan JP. Inter and intra-observer reliability of calculating cumulative
lumbar spine loads. Ergonomics 2002;45:788-97.