EPIC-PHASE: a Model to explore Irrigation Strategies
A. M. Santos!; M. Cabelguenne"; F. L. Santos!; M. R. Oliveira!; R. P. Serralheiro!; M. A. Bica# !Universidade de EDvora, Apartado 94, 7002-554 EDvora, Portugal; e-mail of corresponding author: [email protected] "INRA Centre de Recherches de Toulouse BP27-F31326, Castanet Tolosan, France; e-mail: [email protected]
#INIA Estaia!o de Culturas Regadas de Alvalade do Sado, 7565 Alvalade do Sado, Portugal
(Received 16 November 1998; accepted in revised form 9 December 1999)
The erosion productivity impact calculator phase (EPIC-PHASE) model has been used to simulate, using 1972 to 1994 climatic date, two irrigation strategies with a non-limited water supply: (1) a standard strategy based on simple decision rules advisable for moderately deep soils of the Lauragais region (France) and in the Alentejo region (Portugal); and (2) a model strategy based on the daily development of soil water depletion and daily water stress intensity predicted by the model. At Lauragais, the results show that for the same level of yield it would have been possible with the model to save 73 mm on average, equivalent of two irrigations per year, compared to the standard strategy. These savings are due to an increased soil water contribution during the cycle and to an earlier end of the irrigation supply. At Alentejo, the results show that for the same level of yield as obtained with the standard strategy, it would have been possible with EPIC-PHASE model to save 100 mm of water on average, equivalent of two irrigations per year due to an increased use of soil water during the cycle. Although the results are from simulations it is proved that the standard strategy is inadequate. Regarding the environmental impact, the model management allows for an increase in the level of water depletion at harvest, delaying the risk of percolation and nitrogen losses during the re"ll period. The EPIC-PHASE model proved to be a tool capable of de"ning an irrigation schedule better adapted to the Mediterranean region.
! 2000 Silsoe Research Institute
1. Introduction
Simulation models of crop growth and develop-ment, such as the erosion productivity impact calculator phase (EPIC-PHASE) model (Cabelguenne & Debaeke, 1996; Cabelguenne & Deumier, 1996; Cabelguenne et al., 1997), can be an e$cient and useful tool for managing irrigation, especially in water-limited situ-ations. The EPIC-PHASE model was developed and tested to schedule irrigation on maize at the INRA Station d'Agronomie of Toulouse in Auzeville, Southwest of France, from 1972 to 1994 and was calib-rated and validated, from 1994 to 1996, at Alvalade do Sado, Southwest of Portugal (Santos et al., 1996, 1999). Alvalade do Sado is under a sub-humid Mediterranean climate. Annual rainfall from 1972 to 1994 was highly variable, ranging from 353 to 890 mm and concentrated throughout the year from October to April. The average rainfall from May to September was 105 mm, which represents 20% of the average annual amount
of 532 mm. The average climatic de"cit}evapotrans-piration (ET) less rainfall}from May to September was 789 mm. In Auzeville, the climate is also Mediterra-nean but with annual rainfall ranging from 415 to 1000 mm. During the period considered above, the aver-age rainfall from May to September was 304 mm, repre-senting 43% of the average annual amount of 715 mm. The average climatic de"cit from May to September was 448 mm.
These two extreme Mediterranean regions provided excellent conditions to test and evaluate the potential of the EPIC-PHASE model to de"ne an irrigation schedul-ing strategy adapted to each situation. At each site, the model was tested to schedule irrigation under two di!er-ent water application strategies. The scheduling strat-egies were designed to attain the same level of yield traditionally obtained in the two regions but achieving an economy of water supply due to a better management of the soil water storage during the crop cycle through the use of the model.
doi:10.1006/jaer.1999.0523, available online at http://www.idealibrary.com on
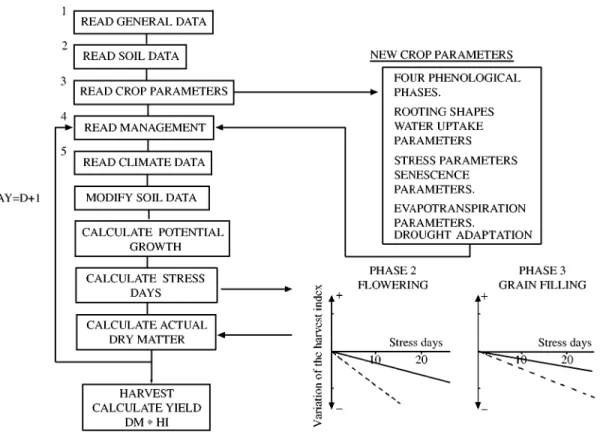
Fig. 1. Program yowchart for the erosion productivity impact calculator phase (EPIC-PHASE) model: DM, dry matter; HI, harvest index; , ewect on the harvest index of a moderate water stress; } } } }, ewect of a high water stress
2. Material and methods
2.1. ¹he irrigation scheduling model
The EPIC-PHASE model is a modi"ed version of the EPIC model (Williams et al., 1989) which incorporates the e!ects on harvest index of water stress at di!erent crop physiological phases.
This modi"ed version is well adapted for irrigation scheduling and for optimizing the use of available water according to a set objective, and for taking into account the crop water stress sensitivity at each growth stage. The EPIC-PHASE model contains additional crop para-meters, resulting in a better simulation of water stress e!ects on growth and yield throughout the growing sea-son. Although details of the model have been presented elsewhere (Cabelguenne & Debaeke, 1995), the program #owchart is presented in Fig. 1.
As well as the additional crop parameters, the model considers four phenological phases expressed as fractions of the whole growing season. With regard to crop root development, the EPIC-PHASE model also includes new parameters, which account for the shape of the root system, simulating either a rather cylindrical system such
as found with sun#owers or a conical system similar to the maize root system. The model simulates the ability of roots to absorb water in soils of di!erent texture.
Compared with the original model, EPIC-PHASE model includes new parameters representing the sensitiv-ity to water stress at each phase. These parameters a!ect the harvest index according to the duration (stress days) and intensity of stress using an average response slope during the phases. But, as an option, the harvest index sensitivity can be modulated through the use of other parameters specifying a water stress threshold for each phase. The model will choose between two di!erent response slopes, depending on the relative magnitude of the water stress intensity (moderate or strong) compared with the threshold value (Fig. 1).
The larger the duration and the intensity of stress, the earlier the plant begins to senesce. A parameter is included in EPIC model to simulate the normal senesc-ence starting at the end of the vegetative period. The EPIC-PHASE model includes an additional parameter which allows the model to initiate leaf senescence before the end of the vegetative period, at a time de"ned by another parameter expressed as a fraction of the growth cycle.
Regarding evapotranspiration (ET), two new para-meters were added which allow for more crop water uptake than the calculated potential ET values and also for a reduction of crop water use without yield reduc-tions. These parameters are used to express the ability of crops such as sun#ower to use more without reducing yield as part of a process of drought adaptation.
2.2. Irrigation strategies
The EPIC-PHASE model was used in Alvalade do Sado (Southwest of Portugal, 373 5"N, 83 24"W) and in Auzeville (Southwest of France, 433 5"N, 13 25"E), from 1972 to 1994, to schedule irrigation and simulate the performance of two irrigation strategies under conditions of non-limiting water supply and applied on moderately deep soils.
On both sites, one standard irrigation strategy was realized according to simple decisions rules applied to moderately deep soils of each region. In Auzeville, 35 mm was applied weekly and, at Alvalade do Sado, 50 mm. The other irrigation strategy was a model strategy based on the daily development of soil water depletion and daily water stress intensity predicted by the model. Since crop-available water depends on the soil characteristics, the rooting depth, and the crop water extraction capacity (Maertens & Cabelguenne, 1971), similar levels of soil water depletion may generate di!erent stress intensities. Consequently, it is important to know both the soil water depletion and water stress intensity (Cabelguenne et al., 1997). The computed daily water stress intensity is the ratio between the o!er and the demand of water and range from 1 (no stress) to 0 (maximum stress). With this strategy, 35 mm was applied in Auzeville when the daily water stress intensity was less than 0)9, and 50 mm was applied in Alvalade do Sado when the daily water stress intensity was less than 0)95. These values of daily water stress intensity were "xed according to experimental work (Santos et al., 1999). The high value of the daily water stress intensity at Alvalade do Sado is due to the high climatic de"cit of this region.
The EPIC-PHASE model was used "rst to simulate under non-irrigated conditions to precise the water stress and yields variability during the 1972}1994 period.
3. Results
3.1. =ater stress and yield under non-irrigated conditions The simulations with EPIC-PHASE model show that irrigation is needed to grow maize in Alvalade do Sado (Table 1). The grain yield was zero for all the years
accounted for due to the lack of water in the soil pro"le during the months of June through October. For Auzeville, the yields were very variable, with a minimum of 4.7 t/ha in 1989 and a maximum of 11.7 t/ha in 1979. The simulated grain yield was strongly related to the climatic de"cit for each region.
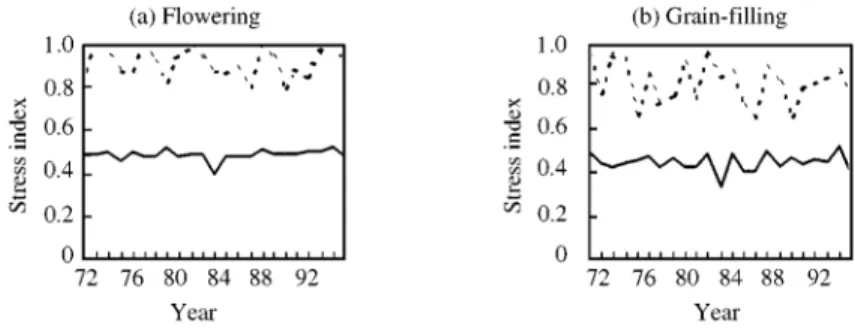
Figure 2 shows the consequences of non-irrigation on daily average water stress intensity at #owering and grain "lling crop stage. At Alvalade do Sado, the average daily water stress development was similar for all the years, being markedly in#uenced by the regularity of the climatic de"cit. At the #owering stage, the values of the average daily water stress were already extremely high (0)38}0)50) due to insu$cient precipitation received dur-ing the sprdur-ing season. They were very close to those simulated at the grain "lling stage as observed after-wards. At Auzeville, the average daily water stress devel-opment was extremely irregular, in accordance with the variability of the climatic de"cit (Fig. 2). At the #owering stage, the values of the average daily water stress were lower (0)8}1)0), indicating the e!ects of the precipitation received during May and June. During the grain-"lling stage, the average daily water stress was also high (0)65}0)90) due to the low level of water on the soil.
3.2. Comparison between the irrigation strategies 3.2.1. Alvalade do sado
The simulations with the EPIC-PHASE model show that, under the standard strategy, 550 mm of water was applied each year due to the regularity of the climatic de"cit and the simulated yield was 11)1 t/ha on average (Table 1). The proportion of the average soil water used before irrigation, that is, the ratio between the actual de"cit and the total water storage (water in the root zone between "eld capacity and the permanent wilting point), was low (21}35%) with a mean of 25% (Fig. 3). At harvest, this proportion was 42% on average (Fig. 3).
Table 1 shows that under the model strategy and for the same level of yield as obtained with the standard strategy, 450 mm was applied each year, representing an economy of 100 mm of water and the equivalent of two irrigations per year. The end of irrigation season in both strategies occurs at the beginning of September. This relatively late ending of irrigation is due to the poor level of water storage (proportion of water used was around 50%) and to low rainfall. So, the water savings with the model strategy are due to an increased use of soil water throughout the cycle. With regard to the propor-tion of the average soil water used, values between 31 and 54% before irrigation were simulated (Fig. 3). At harvest, this proportion was also higher (average of 54%) than the use with the standard strategy (Fig. 3).
Table 1
Simulated yield under non-irrigated and irrigated conditions, amount of water supplied according to the standard and the model strategies; climatic de5cit (May}September)
Water applied, mm
Yield under Yield under irrigation
non-irrigation, t/ha Alvalade Auzeville Climatic dexcit, mm Standard or Model, t/ha Year Alvalade Auzeville Standard Model Standard Model Alvalade Auzeville Alvalade Auzeville
1972 0 8)3 550 450 175 130 856 238 10)8 11)9 1973 0 9)1 550 450 245 125 831 438 11)9 11)6 1974 0 11)7 550 450 105 35 869 246 12)1 12)4 1975 0 8)4 550 450 210 140 817 377 10)6 12)1 1976 0 6)1 550 450 280 210 800 602 12)1 12)0 1977 0 10)4 550 450 140 65 832 !36 12)0 12)4 1978 0 6)9 550 450 210 145 798 428 10)7 12)6 1979 0 5)3 550 450 245 175 853 477 10)1 11)8 1980 0 9)8 550 450 175 105 644 321 11)2 12)1 1981 0 8)2 550 450 175 105 615 448 11)1 12)0 1982 0 8)6 550 450 210 105 729 678 11)2 10)8 1983 0 6)5 550 450 175 140 651 633 11)6 10)5 1984 0 8)7 550 450 210 105 670 480 10)5 11)8 1985 0 7)2 550 450 245 160 880 547 10)2 11)9 1986 0 4)8 550 450 280 210 863 607 10)7 11)7 1987 0 10)6 550 450 140 70 858 485 11)0 12)1 1988 0 9)5 550 450 210 105 709 543 10)8 11)8 1989 0 4)7 550 450 315 270 689 891 10)9 12)0 1990 0 6)3 550 450 210 140 842 765 10)9 10)3 1991 0 7)2 550 450 210 175 937 528 10)5 12)1 1992 0 8)8 550 450 175 105 754 495 10)5 11)4 1993 0 10)8 550 450 175 105 720 386 11)2 11)5 1994 0 6)9 550 450 245 180 975 317 12)0 11)2 Average 0 8)9 550 450 209 136 789 448 11)1 11)7
Fig. 2. Simulated average daily water stress intensities under non-irrigated conditions at (a) yowering and (b) grain-xlling stages: , Alvalade do Sado; , Auzeville
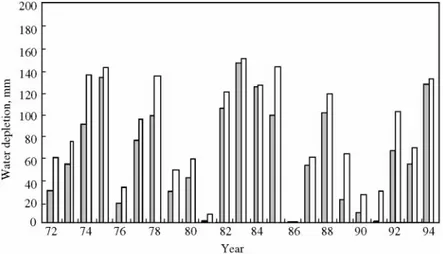
The model scheduling management allowed an increase of the level of water depletion at harvest (Fig. 4). In 1981 and 1991, the level of water depletion at harvest was almost null with the standard strategy due to an important rainfall at the end of September and beginning of October. With the model strategy these values were much high delaying the risk of deep percolation and nitrogen losses during the re"ll period.
3.2.2. Auzeville
Table 1 shows that under the standard strategy an average of 209 mm of water was applied, with a minimum of 105 mm (1974) and a maximum of 315 mm (1989). The simulated yield was 11)7 t/ha on average.Figure 5 shows that the proportion of the average soil water used before irrigation was low (15}35%) with a mean of 20%. At harvest, this proportion was also low, ranging between
Fig. 3. Proportion of the average soil water used (a) before irrigation and at (b) harvest at Alvalade do Sado: , standard strategy; , model strategy
Fig. 4. Comparison between the level of water depletion at harvest at Alvalade do Sado: , standard; , model
0 and 50% with an average of 25% and according to the precipitation received after the last irrigation (Fig. 5).
Under the model strategy, the results show, for the same level of yield as obtained with the standard strategy, a reduction of water applied with an average of 136 mm applied and a minimum of 35 mm and a maximum of 270 mm (Table 1). It was possible to save 73 mm of water, the equivalent of two irrigations per year. The end of irrigation with the standard strategy was at the end of August or beginning of September (physiological matur-ity phase) and in the middle (exceptionally at the end) of August (beginning of physiological maturity phase) or exceptionally at the end of August with the model strat-egy. The early end of irrigation is attributed to the high level of water storage (proportion of water used was around 30%), to the high probability of rain and to the low sensitivity of maize to water stress at this stage. The water savings with the model strategy are due to an increased use of soil water during the cycle and also to an earlier end of irrigation. Regarding the proportion of water used, values between 25 and 48% before irrigation
and an average of 50% at harvest were simulated (Fig. 5). The model scheduling management allowed an increase of the level of water depletion at harvest (Fig. 6 ). In 1984, the level of water depletion at harvest was almost nil with the standard strategy due to an important rainfall at the end of August and was about 100 mm with the model strategy. The risk of deep percolation and nitrogen losses during the re"ll period is then delayed with the model strategy.
4. Discussion
Although the results are from simulations, it is proved that the standard strategy is inadequate for the moder-ately deep soils of Lauragais/Auzeville and Alentejo/ Alvalade. The high level of soil water available in the soil pro"le is not used by the crop due to the imposed management. The model strategy is better adapted to schedule irrigation in both regions. It adjusts the irriga-tion frequency according to the crop water needs and the
Fig. 5. Proportion of the average soil water used (a) before irrigation and at (b) harvest at Auzeville: , standard strategy; , model strategy
Fig. 6. Comparison between the level of water depletion at harvest at Auzeville; , standard; , model
available soil water in the pro"le. In consequence, irriga-tion is better scheduled, being delayed while there is water available in the pro"le for crop use, and initiated on time. In the process, less irrigation is needed and water is saved. These results are in agreement with the ones of Maertens et al. (1966) and Maertens & Cabel-guenne (1971) that have established that the proportion of soil water used by the crop before irrigation should be between 30 and 40%. In fact, these values are more in agreement with that observed with the model strategy, instead of the 21}35% of soil water used before irri-gation at Alvalade do Sado and 15}33% at Auzeville with the standard strategy. With both strategies, no stress was created for the same level of yield (Table 1) but the proportion of water soil use was considerably di!erent.
Table 2 shows a comparison of irrigation scheduling simulated by EPIC-PHASE at Alvalade do Sado and at
Auzeville for the year 1990. At Alvalade do Sado, the beginning of irrigation occurs at the same date for both strategies because the rainfall was only 22 mm from sow-ing until 27 June. In July, there was less water applied (100 mm) with the model strategy compared to the stan-dard strategy due to the absence of simulated water stress. During August, the number of irrigations were the same in both strategies due to the high sensibility of maize to water stress at the #owering and grain-"lling phases. The end of irrigation with the model strategy occurred on the "rst of September and at that time with 48% of water had been used compared with the 30% used for standard strategy. At Auzeville, the scheduling of irrigations with the model delayed the "rst irrigation in response to rainfall that occurred in June and imposed also an early end to irrigation on 6 August instead of the predicted date of 16 August due to the rainfall that occurred in August.
Table 2
Comparison of the standard and the model strategies for 1990 at Alvalade and at Auzeville
Standard strategy Model strategy
Date Water Soil water Date Water Soil water
application, used, % application, used, %
mm mm Alvalade 27/6 50 30 27/6 50 35 4/7 50 20 10/7 50 47 11/7 50 28 16/7 50 41 18/7 50 28 26/7 50 45 24/7 50 24 3/8 50 47 31/7 50 30 10/8 50 46 7/8 50 31 19/8 50 45 14/8 50 30 25/8 50 48 21/8 50 30 1/9 50 48 28/8 50 30 4/9 50 30 Total 550 450 average 28 45 Auzeville 1/7 35 32 9/7 35 42 9/7 35 23 17/7 35 46 17/7 35 26 25/7 35 47 25/7 35 37 6/8 35 49 6/8 35 40 16/8 35 40 Total 210 140 average 33 46 5. Conclusions
The EPIC-PHASE model proved suitable for schedul-ing irrigation and de"nschedul-ing irrigation water applications better adapted to the crops, climatic changes and varia-bility of the Mediterranean regions. It proved to be a versatile management tool, accommodating a wide range of climatic and soil characteristics such as the ones tested for in France and Portugal. Being the model developed and tested for a long period of time in France, the results are more reliable for the Auzeville site. The results are, however, very encouraging for Alentejo where the calibration was done successfully.
References
Cabelguenne M; Debaeke P (1995). Manuel d'utilization du mode`le EWQTPR [EWQTPR: user's manual]. Publication interne Station d'Agronomie, INRA, Auzeville
Cabelguenne M; Debaeke P (1996). EPIC-PHASE temps reHel: un mode`le pour la conduite tactique de l'irrigation,
[EPIC-PHASE real time: a model for tactical irrigation manage-ment]. Comptes Rendus de l' AcadeHmie d'Agriculture de France, 82(4), 39}51
Cabelguenne M; Deumier J M (1996). EPIC-PHASE: un mode`le pour l'exploration de strateHgies d'irrigation, [EPIC-PHASE: a model to explore irrigation strategies]. Comptes Rendus de l' AcadeHmie d'Agriculture de France, 82(4), 59}71
Cabelguenne M; Puech J; Debaeke Ph; Bosc N (1997). Real time irrigation management using the EPIC-PHASE model and weather forecasts. Agricultural Water Management, 32, 227}238
Maertens C; Cabelguenne M (1971) In#uence de l'irrigation sur les modaliteHs d'utilisation de l'eau du sol par di!erentes cultures annuelles et pluriannuelles [The in#uence of irrigation on soil water use by di!erent crop species]. Comp-tes Rendues de l'AcadeHmie d'Agriculture de France, 56, 926}936
Maertens C; Fioramonti S; Courau M; Puech J (1966). Modal-iteHs d'utilisation de l'eau du sol par le mais. Examen de la notion de reHserve utilisable [The use of soil water by maize. Revision of the concept of water holding capacity]. Comptes Rendus de l'AcadeHmie d'Agriculture de France, 52, 1338}1348
Santos A M M; Cabelguenne M; Santos F L; Oliveira M R; Serralheiro RP; Bica M A (1998). EPIC-PHASE: a model to explore irrigation strategies. Proceedings of EurAgEng Con-gress, Oslo, Norway, 24}27 August, pp 866}867
Santos A M M; Cabelguenne M; Santos F L; Oliveira M R; Serralheiro R P; Bica M A (1999). Testing the real time EPIC-PHASE (EWQTPR) model in a sub-humid Mediterranean environment. Proceedings of the International Symposium,
&New Approaches in Irrigation, Drainage and Flood Control Management'. Bratislava, Slovak Republic, 12}14 May, p 71 Santos F L; Serralheiro R P; Santos A M; Bica M A (1996). Maize tactical irrigation management in the southwest of Portugal using real time EPIC model. AgEng 96 Congress, Madrid, Spain, 23}26 September
Williams J R; Jones C A; Kiniry J R; Spanel D A (1989). The EPIC crop growth model. Transactions of the ASAE, 32(2), 497}511