Universidade de Aveiro Ano 2019 Departamento de Biologia
SARA RIBEIRO DA
SILVA
Assessment of the toxicity and efficacy of innovative antifouling coatings
Avaliação da toxicidade e eficácia de revestimentos anti-incrustantes
DECLARAÇÃO
Declaro que este relatório é integralmente da minha autoria, estando devidamente referenciadas as fontes e obras consultadas, bem como identificadas de modo claro as citações dessas obras. Não contém, por isso, qualquer tipo de plágio quer de textos publicados, qualquer que seja o meio dessa publicação, incluindo meios eletrónicos, quer de trabalhos académicos.
Universidade de Aveiro Ano 2019 Departamento de Biologia
SARA RIBEIRO DA
SILVA
Assessment of the toxicity and efficacy of innovative antifouling coatings
Avaliação da toxicidade e eficácia de revestimentos anti-incrustantes
Dissertação apresentada à Universidade de Aveiro para cumprimento dos requisitos necessários à obtenção do grau de Mestre em Biologia Marinha, realizada sob a orientação científica do Doutor Roberto Carlos Domingues Martins, Investigador Auxiliar do Departamento de Biologia e Centro de Estudos do Ambiente e do Mar (CESAM) da Universidade de Aveiro e coorientação da Professora Doutora Susana Patrícia Mendes Loureiro, Professora Auxiliar com Agregação do Departamento de Biologia e do Centro de Estudos do Ambiente e do Mar (CESAM) da Universidade de Aveiro.
o júri
Presidente Professor Doutor Amadeu Mortágua Velho da Maia Soares
Professor Catedrático, Universidade de Aveiro
Arguente Professor Doutor Lucas Buruaem Moreira
Professor Visitante, Universidade Federal de São Paulo
Orientador Doutor Roberto Carlos Domingues Martins
Investigador Auxiliar, Cesam - Departamento de Biologia, Universidade de Aveiro
agradecimentos Ao Roberto Martins e Susana Loureiro, como orientadores e professores, por todos os conhecimentos transmitidos, apoio, ajuda e pela oportunidade de enorme aprendizagem que me proporcionaram durante todo o percurso e desenvolvimento deste trabalho. Aos meus pais, irmã e cunhado pela força, acompanhamento, incentivo, paciência e fulcral apoio ao longo de todo o percurso. Sem vocês não teria sido possível chegar até onde cheguei. Obrigada!
À Raquel, Diana e Marta pelo ombro e palavra amiga nos momentos de maior fragilidade, por sempre acreditarem em mim, nas minhas capacidades e me darem força, não esquecendo as longas horas de estudo juntas.
À Joana e à Lígia pela enorme ajuda em todas as horas de laboratório, idas ao campo, todo o apoio, risos, partilhas e momentos que guardarei com o maior carinho.
Aos colegas/ professores/ investigadores dos vários departamentos com os quais colaborei, pela transmissão de ensinamentos, ajuda e permitirem complementar este trabalho com recurso ao uso de equipamentos e materiais fornecidos.
À SmallMatek pelo fornecimento das placas pintadas e realização de análises de caracterização FTIR.
palavras-chave Tintas Anti vegetativas; Bio incrustação marinha; Biocidas nano estruturados; Eficácia; Toxicidade
resumo A bioincrustação marinha em estruturas metálicas marítimas construídas pelo Homem é ainda um problema socioeconómico a nível global. A proteção das estruturas tem sido convencionalmente realizada com recurso a tintas anti vegetativas contendo biocidas orgânicos e/ou metálicos (ex. cobre), cujos efeitos tóxicos em organismos não-alvo têm sido amplamente reportados na literatura. Por forma a contornar este problema ambiental e controlar a libertação dos químicos ao longo do tempo, alguns destes biocidas foram imobilizados/encapsulados em nanomateriais manufaturados. Recentemente foi demonstrado que, quando dispersos em água salgada artificial, os novos nanoaditivos apresentam uma redução apreciável da sua toxicidade e perigosidade para o ecossistema marinho. Desta forma, o presente estudo teve como objetivo avaliar a toxicidade e a eficácia anti vegetativa de 8 tintas modificadas com biocidas livres ou nano estruturados e 1 tinta comercialmente disponível, assim como relacionar estes dados com parâmetros físico-químicos e a libertação de elementos físico-químicos ao longo do tempo. Destas tintas, duas continham biocidas em estado livre (CuPT e DCOIT (nome comercial Sea-Nine), duas com os biocidas na forma “nano” (CuPT@Zn-Al LDH e Sea-Nine@SiNC), três com nano-estruturas “vazias” (Cu-Al LDH, Zn-Al LDH e SiNC), um controlo negativo (sem biocidas) e um controlo positivo (tinta comercial).
resumo (cont.) A eficácia anti-vegetativa das tintas foi avaliada ao longo de um ano, na marina da Gafanha da Encarnação (Aveiro, Portugal), tendo-se avaliado a evolução das comunidades bacterianas, microfitobentos e de macroorganismos incrustantes. No laboratório, as chapas revestidas foram caraterizadas e, posteriormente, colocadas em aquários para libertar os seus compostos químicos durante 3 meses. Periodicamente, aliquotas de água de cada aquário foram monitorizadas em termos dos efeitos tóxicos em microalgas (inibição de crescimento, Phaeodactylum tricornutum e Tetraselmis chuii) e crustáceos (letalidade Artemia salina), composição elementar (ICP-MS e ICP-OES), quantificação de DCOIT (nas tintas com este composto, via HPLC) e caraterização fisico-química. Globalmente, este estudo mostrou que as tintas com os biocidas em estado livre têm elevada eficácia anti-vegetativa, mas extrema toxicidade. Por sua vez, as tintas anti-vegetativas com nanoaditivos mostraram uma reducão significativa da sua toxicidade e mantiveram (CuPT@Zn-Al LDH) ou até melhoraram (Sea-Nine@SiNC) a eficácia anti-vegetativa contra macrorganismos incrustantes, sobretudo macroalgas, após um ano de imersão em condições reais. Portanto, o encapsulamento/imobilização destes biocidas para aplicação como aditivos anti-vegetativos de tintas parece ser um método bastante promissor em termos ambientais.
keywords Antifouling Coatings; Biofouling; Nanostructured biocides; Efficacy; Ecotoxicity
abstract Marine biofouling in man-made metallic immersed structures is still a global socio-economic problem. The protection of structures has been conventionally performed using antifouling paints containing toxic organic and/or metallic biocides (e.g. copper) towards non-target organisms. In order to circumvent this environmental problem and control the chemicals release over time, some of these biocides have been immobilized/encapsulated in engineered nanomaterials. When directly dispersed in artificial saltwater, novel nanoadditives show a noteworthy reduction in their toxicity and hazard to marine ecosystems. Thus, the present study aimed to test the toxicity and antifouling efficacy of 8 modified coatings with free or nanostructured biocides and 1 state-of-the-art coating and to establish a relationship with physicochemical parameters and the release rate of chemicals over time. The tested systems are the following: two coatings containing only free biocides (CuPT and DCOIT (commercially known as Sea-Nine), two with nano-structured biocides (CuPT @ Zn-Al LDH and Sea-Nine @ SiNC), three with unloaded/"empty" nanostructures (Cu-Al LDH, Zn-Al LDH and SiNC), blank reference without biocides and a commercial reference. The anti-fouling efficacy assessment was done at Gafanha da Encarnação marina (Aveiro, Portugal), for a complete year. Bacteria, microphytobenthos and macrofoulers communities were evaluated periodically.
abstract (cont.) In the laboratory, coated plates were properly characterized in terms of chemical composition and metallographic properties, and then, placed in aquaria and allowed to release their chemical compounds for 3 months. Water samples were taken from each aquarium and monitored for toxic effects on microalgae (growth inhibition, Phaeodactylum tricornutum and Tetraselmis chuii) and crustaceans (lethality, Artemia salina), elemental composition (MS and ICP-OES), DCOIT quantification (only in paints with this compound via HPLC) and physicochemical characterization. Overall, this study showed that coatings with free biocides showed high antifouling efficacy, but extreme toxicity. The encapsulation of these biocides significantly reduced the coatings toxicity and kept (CuPT @ Zn-Al LDH) or even increased (Sea-Nine @ SiNC) their anti-macrofouling efficacy over an entire year of immersion in the field, being a promising method with environmental benefits.
I
Index
1. Introduction ... 1
1.1 Biofouling and its impacts ... 1
1.2 Antifouling protection ... 4
1.3 Thesis goals ... 10
1.4 Null Hypotheses ... 10
2. Materials and Methods ... 11
2.1 Tested coatings ... 11
2.1.1 Coating preparation and application ... 11
2.1.2. Characterization of coated plates ... 13
2.2. Coating leachates characterization and toxicity ... 14
2.2.1. Characterization and behavior of leachates over time ... 14
2.2.1.1. Dynamic Light Scattering ... 14
2.2.2. Leachates ecotoxicity ... 17
2.2.2.1. Crustaceans acute toxicity ... 17
2.2.2.2. Microalgae growth inhibition effects ... 18
2.2.2.3 Statistical analysis ... 18
2.3. Field efficacy testing ... 19
2.3.2 Sampling ... 21
2.3.3 Characterization of the microbiological communities ... 22
2.3.4 Characterization of the microphytobenthos communities ... 24
2.3.5 Characterization of the macrofoulers communities ... 24
2.4. Multivariate data analysis ... 25
3. Results ... 26
3.1.2.1 Metallography ... 26
3.1.2.2 FTIR ... 28
III
3.2.1. Characterization and behavior of leachates over time ... 31
3.2.1.1 DLS ... 31
3.2.1.2 HPLC ... 33
3.2.1.3 ICP-MS ... 34
3.2.1.4 ICP-OES ... 37
3.2.2 Ecotoxicity of leachates ... 38
3.2.2.1 Crustacean acute toxicity ... 38
3.2.2.2. Microalgae growth inhibition effects ... 39
3.3 Field efficacy testing ... 41
3.3.1 Characterization of the microbiological communities ... 44
3.3.2. Characterization of the microphytobenthos communities ... 48
3.4 Multivariate data analysis ... 51
4. Discussion ... 52
5. Conclusions ... 55
V
Index of Figures
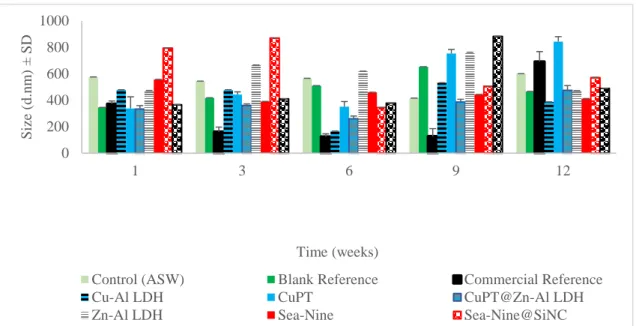
Figure 1: Schematic representation of the biofouling process (adapted from Hellio and Yebra, 2009; Martín-Rodríguez et al., 2015) ... 2 Figure 2: Scheme of fouling impacts on mobile structures and on the biota culminating in socio-economic losses ... 3 Figure 3: Scheme of antifouling materials/substances used in the past highlighting a simplified painting scheme of metallic surfaces... 5 Figure 4: Localization of the field experimental setup, marina of Gafanha da Encarnação, Aveiro, Portugal ... 19 Figure 5: A: Immersion of the system containing 7 out of 9 coatings (Commercial reference, CuPT, CuPT@Zn-Al LDH, Sea-Nine, Sea-Nine@SiNC, SiNC and Cu-Al LDH); B: Immersed Larger system; C: Dry smaller system (with the coatings Zn-Al LDH and Blank reference; D: Immersed smaller system ... 20 Figure 6: Auxiliary sheet to locate randomized areas for collecting both bacteria and microphytobenthos samples. ... 21 Figure 7: Top view of the coatings surface using a stereo microscope ... 26 Figure 8: Images of the cross section of each plate coated using stereo microscope (Nikon SMZ18) (magnification 13.5nm) ... 27 Figure 9: FTIR representation of the coatings topcoats and particles. A: FTIR spectra of Commercial reference and Blank reference; B: FTIR spectra of coating containing Cu-Al LDH-nitrate and Zn-Al LDH-nitrate; C: FTIR spectra of SiNC powder and SiNC topcoat; D: FTIR spectra of Sea-Nine powder and Sea-Nine@SiNC topcoat; E: FTIR spectra of SiNC top-coat, Sea-Nine@SiNC top-coat and Blank reference; F: FTIR spectra of CuPT topcoat and CuPT@Zn-Al LDH topcoat with Blank reference as reference. ... 30 Figure 10: Representation of leachates size (average) of each testing coating over time ... 32 Figure 11: Aluminum concentration over time in coating's leachates for 12 weeks of immersion in laboratorial conditions (no bar: samples below the detection limit of the equipment). ... 34 Figure 12: Copper concentration over time in coating's leachates for 12 weeks of immersion in laboratorial conditions (no bar: samples below the detection limit of the equipment). ... 35
VII
Figure 13: Iron concentration over time in coating's leachates for 12 weeks of immersion in laboratorial conditions (no bar: samples below the detection limit of the equipment). ... 35 Figure 14: Zinc concentration over time in coating's leachates for 12 weeks of immersion in laboratorial conditions (no bar: samples below the detection limit of the equipment). ... 36 Figure 15: Concentration of the elements present on each coating sample from time 6, obtained via ICP-OES (no bar: samples below the detection limit of the equipment). .. 37 Figure 16: Acute toxicity of the tested coatings leachates (up to 12 weeks of immersion) in Artemia salina. ... 38 Figure 17: Tetraselmis chuii growth inhibition caused by tested coatings leachates (up to 12 weeks of immersion). *: Blank reference vs treatments; #: Commercial reference vs treatments; a: Cu-Al LDH vs CuPT; b: Cu-Al LDH vs CuPT@Zn-Al LDH; c: CuPT vs CuPT@Zn-Al LDH ... 39 Figure 18: Phaeodactylum tricornutum growth inhibition caused by tested coatings leachates (up to 12 weeks of immersion). *: Blank reference vs treatments; #: Commercial reference vs treatments; a: Cu-Al LDH vs CuPT; c: CuPT vs CuPT@Zn-Al LDH; d: Sea-Nine vs Sea-Sea-Nine@SiNC. ... 40 Figure 19: Photographic record of biofouling in blank reference plates showing the presence of ascidians and bryozoans (whitish organisms) and macroalgae (green or brown). ... 42 Figure 20: Compilation of the percentage of the field parameters (Biofilm, Macroalgae and Invertebrates) over time. The Biofilm is represented by 0% transparency, macroalgae: 50% transparency and Invertebrates: 75% transparency. First 20 weeks of immersion. 43 Figure 21: Compilation of the percentage of the field parameters (Biofilm, Macroalgae and Invertebrates) over time. The Biofilm is represented by 0% transparency, macroalgae: 50% transparency and Invertebrates: 75% transparency. Continuation from Figure 25 until a year of immersion. ... 43 Figure 22: Dendrogram of PCR-DGGE comparing the samples from week 1 and week 3. Week 1 represented by the color red and week 3 represented by the color green... 45 Figure 23: Dendrogram of PCR-DGGE comparing the samples from week 3 and week 6. Week 3 represented by the color green and week 6 represented by the color yellow. ... 46 Figure 24: Dendrogram of PCR-DGGE comparing the samples from week 1 and week 6. Week 1 represented by the color red and week 6 represented by the color yellow... 47
IX
Figure 25: Abundance of microphytobenthos adhered to tested coatings during 12 weeks of immersion in the field *: Blank reference vs. treatments; #: Commercial reference vs. treatments. ... 48 Figure 26: Biomass of microphytobenthos adhered to tested coatings during 12 weeks of immersion in the field. *: Blank reference vs. treatments; #: (Commercial reference vs. treatments; a: Cu-Al LDH vs CuPT; d: Sea-Nine vs Sea-Nine@SiNC. ... 49 Figure 27: Photosynthetic yield of microphytobenthos adhered to tested coatings during 12 weeks of immersion in the field. *: Blank reference vs. treatments; #: Commercial reference vs. treatments; a: Cu-Al LDH vs CuPT; d: Sea-Nine vs Sea-Nine@SiNC ... 50 Figure 28: Ordination diagram (PCO) based on the leachates ecotoxicity and field AF efficacy of the tested coatings immersed for 3 months. Spearman (rho > 0.7) correlation vectors of environmental descriptors are provided as supplementary variables. ... 51
XI
Index of Tables
Table 1: List of antifouling biocides included in the EU category PT21 (27/07/2019) ... 6 Table 2: Characteristics of biocides-release based antifouling coatings of the biggest worldwide paint producers (Yebra et. al., 2004; Ameron, 2008; Takahashi, 2009) ... 9 Table 3: List of additives and percentages used in the modified topcoats ... 12 Table 4: Primers tested for 16S rRNA gene amplification (Chelius and Triplett, 2001) 23 Table 5: Resume of samples size (average of the sampling times) ... 31 Table 6: Concentration of Nine (µg/L) in artificial seawater and leachates of Sea-Nine@SiNC and Sea-Nine coatings between 0 and 12 weeks of immersion, detected by HPLC (n=3). “N/d” – Not detected. ... 33 Table 7: Physicochemical parameters measured in the marina’s seawater during the first three months of immersion. ... 41 Table 8: Biotic indices based on the microbiological communities settled in the tested coatings after 1 and 3 weeks of immersion: S(richness); J(evenness) and H’(diversity) 45 Table 9: Biotic indices based on the microbiological communities settled in the tested coatings after 3 and 6 weeks of immersion: S(richness); J(evenness) and H’(diversity) 46 Table 10: Biotic indices based on the microbiological communities settled in the tested coatings after 1 and 6 weeks of immersion: S(richness); J(evenness) and H’(diversity) 47
1
1. Introduction
Worldwide marine ecosystems encompass a huge biodiversity, provide several services and goods to humans and, in the last centuries, have been under a growing pressure, being their protection and appropriate management of major importance (Barbier et. al., 2011). Main threats to the marine biodiversity include contamination, recreational activities, resources overexploitation and climate changes, among others, which lead to the habitats perturbation or destruction (Mazaris et al., 2019).
Ecosystems contamination is determined by the presence of some substance(s) that would not occur normally there, or if occurs, is/are detected at concentrations above the natural levels. A place that is contaminated do not experience the negative effects of the detected substance(s), however, a polluted site is characterized by having chemical(s) in levels that may cause harmful effects on the living organisms and ultimately impairing the ecosystems functioning and dynamics.
Basically all pollutants are contaminants, but not all contaminants are pollutants (Chapman, 2007). The release of contaminants into the marine seawater are mainly due to domestic, agriculture and industrial runoff, and to off-shore/coastal activities (e.g. maritime transportation, aquaculture, oil spills, oil and gas exploration) which requires infrastructures free of corrosion and biofouling (Álvarez-Muñoz et al., 2016; Tornero et. al., 2016).
1.1 Biofouling and its impacts
Biofouling corresponds to a natural and progressive accumulation of marine organisms (flora and fauna) in static or mobile submerged surfaces (Avelelas et. al., 2017). Similarly, to other natural ecological successions, biofouling is characterized by different phases (five in this case) in which characteristic organisms colonize the available area, growth and then decline, being then replaced by organisms of the upcoming phase (Figure 1). In the first minutes of the structure’s immersion, proteins, polysaccharides, glycoproteins and other organic molecules present in the seawater adsorb to the surface. Bacteria and, at less extent, some unicellular algae, adhere to the surface after 24 hours. These organisms produce extracellular polymeric substances (i.e. biopolymers such as
2
oligosaccharides, proteins, glycoproteins and glycolipids; Flemming et. al., 2007). that quickly lead to the formation of a biofilm that affects the porosity, adsorption properties, mechanical stability and other factors of the coatings (Arai et. al., 2009; Almeida et. al., 2007). The biofilm will serve as a conditioning layer and food for the third phase organisms, which includes other microfoulers, like microalgae spores, diatoms or protozoans (Almeida et. al., 2007). The last phase is typically characterized by the macrofoulers, such as barnacles, mussels, macroalgae, tubeworms, bryozoans, hydrozoans, among others (Arai et. al., 2009).
Figure 1: Schematic representation of the biofouling process (adapted from Hellio and Yebra, 2009; Martín-Rodríguez et al., 2015)
In terms of ecological impacts, biofouling associated to the maritime transportation have been responsible by the cross-colonization of species around the world, where exotic fouler species are transported in the ballast waters or hulls surface, competing and, in some cases, leading to the exclusion of native species from the surrounding estuarine/coastal ecosystems to the harbors. This pressure may shift the ecosystems dynamic and stability, which may cause relevant biodiversity and socio-economic losses, particularly when associated to lower production of even exclusion of commercially-valuable species ((Schultz et. al., 2011); Figure 2).
In terms of environmental and economic impacts, biofouling promotes an increase of the surface’s roughness and water resistance in mobile structures, and a consequent decrease
3
of the navigation speed (-15%) and an increase of the fuel consumption (+40%) and greenhouse gases emissions (+90%) (Avelelas et. al., 2017; Yebra et. al., 2004; Figure 2). This process decreases the AF coatings efficacy and also promotes biocorrosion on metallic structures, a phenomena accelerated by metabolites-rich acidic fluids produced and excreted by biofoulers, which may affects the quality and quantity of oil and gas production and the infrastructures stability and, in worst cases, their failure (Li et. al., 2019). It is estimated that annually around 60,000 peoples deaths and a loss around 200€ billion is associated with the toxic emissions from the international maritime navigation, resulting from the effects referred above, as indirect consequences of biofouling (Loto et. al., 2019). Antifouling control and maintenance have also massive costs in the maritime industry worldwide. As an example, it is estimated that around 5-10% of the production costs of global aquaculture are attributed to this problem, roughly US$ 1.5 to 3 thousand million/year (Fitridge et. al., 2012).
Finally, AF protective coatings for maritime metallic infrastructures (e.g. vessels, bridges, aquaculture cages, oil and gas offshore platforms and pipelines) are one of the major sources of chemical contamination of the marine environment. Current AF coatings promote the constant release of chemical components (e.g. antifouling booster biocides) to the surrounding seawater, even in early phases, impacting the ecosystem in all its extension, from the water column to the sediments and their inhabiting organisms (Molnar et. al., 2008; Want et. al., 2018).
4
1.2 Antifouling protection
Human-made maritime infrastructures have been typically protected from biofouling with AF coatings ever since Romans, Greeks, Carthaginians, Phoenicians and later, during the Age of Discovery, Portuguese, Spanish and other Europeans protected vessel’s hulls with a wide-range of products, namely, grease, oils, tallow, waxes, resins, oil impregnated with Sulphur or arsenic and, more successfully, copper or lead-sheathing (Nurioglu et. al., 2015) (Figure 3). The technological advances were mostly shaped according to the needs, the type and complexity of the materials used in the structure and know-how of each civilization. Erstwhile, coatings varied between (Arai et. al., 2009; Loto et. al., 2019).
In the 19th century, copper began to be used in iron-based hulls (instead of wood) however, for a short period of time due to corrosion problems (Arai et. al., 2009; Loto et. al., 2019), being then replaced by mercury in the early 20th century. Despite its good efficacy, availability and price, Hg was also discarded due to its well-known health effects and safety issues (Loto et. al., 2019).
Around 1950s, tributyltin (TBT), an organotin compound, appeared and quickly became very popular on AF coatings. The success of TBT relied on the price and the very high and long-lasting AF efficacy which insured higher half-time of the TBT-based coatings and consecutively savings of time and money (less maintenance and less stops), particularly important for the maritime transportation industry. However, environmental concerns quickly raised when researchers demonstrated its slow degradation, contamination and high persistence on different environmental compartments, high bioaccumulation in organisms from different trophic levels and deleterious effects on non-target organisms even at ng level (e.g. bivalves shell thickening; imposex in gastropods; changes on community composition and structure; (Arai et. al., 2009; Price et. al., 2012); Karlsson et. al., 2010). This compound was banned in vessels with less than 25 m length, by the International Maritime Organization (IMO) during the 80s of the last century, and it was totally banned from use in 2008 (Antizar-Ladislao, 2008; Schultz et. al., 2011).
5
Figure 3: Scheme of antifouling materials/substances used in the past highlighting a simplified painting scheme of metallic surfaces
Currently, maritime metallic infrastructures, namely vessels and bridges, are protected from the aggressive saline conditions through a painting scheme composed by an anti-corrosion coating (primer), a tie-coat and one or more topcoat layers (Figure 3). Topcoats with antifouling characteristics such as tin-free self-polishing antifouling materials, with low surface energy, with silicate, capsaicin or with nano-based properties, and ultra-hydrophobic surfaces have been growing. However, the most common and effective AF topcoats to tackle biofouling are based on coatings containing biocides. AF biocides are chemical substances, naturally-available or synthetically-produced, that control the adhesion and growth of fouler organisms on surfaces of human-made infrastructures (Faÿ et. al., 2010).
6
Table 1 lists the biocides approved (or under approval) to be used on antifouling coatings in the Europe Union in compliance the Directive 98/8/EC and the Regulation No 528/2012 of the European Parliament. These authorized biocides are supposedly readily degraded, no/low bioavailable and low toxic to non-target organisms (Jacobson et. al., 2000), however, concerns regarding the environmental fate and toxicity of some of the so-called booster biocides on non-target marine organisms have been highlighted by several studies (e.g. DCOIT by Figueiredo et. al., (2019); Irgarol by Karlsson et. al., (2010)). Copper oxide is by far the most used biocide in state-of-art biocide-release based AF coatings (Table 1). These coatings correspond to the major anthropogenic source of Cu, other metals and organic compounds in seawater and marine sediments, particularly in harbors and marinas (e.g. Eklund et. al., (2014)), and, therefore, environmental concerns have been raised lately (Srinivasan et. al., 2007).
Table 1: List of antifouling biocides included in the EU category PT21 (27/07/2019)
Substance Name EC Number
CAS
Number Legal Act
Date of Approval Expiry Date Evaluating Competent Authority Approval Status 4,5-Dicloro-2-octylisothiazol-3(2H)-one (4,5-Dicloro-2-octyl-2H-isothaizol-3-one (DCOIT) 264-843-8 64359-81-5 Regulation (EU) 437/2014 01/01/2016 01/01/2026 NO Approved Bis(1-hydroxy-1H-pyridine-2-thionato-O,S)copper (Copper pyrithione) 238-984-0 14915-37-8 Regulation 2015/984 01/10/2016 01/01/2026 SE Approved Copper 231-159-6 7440-50-8 Regulation (EU) 2016/1088 01/01/2018 01/01/2026 FR Approved Copper thiocyanate 214-183-1 1111-67-7 Regulation (EU) 2016/1090 01/01/2018 01/01/2026 FR Approved Dichloro-N- [(dimethylamino)sulphonyl]fluoro-N-(ptolyl)methanesulphenamide (Tolylfluanid) 211-986-9 731-27-1 Regulation (EU) 2015/419 01/07/2016 01/01/2026 FI Approved Dicopper oxide 215-270-7 1317-39-1 Regulation (EU) 2016/1089 01/01/2018 01/01/2026 FR Approved Medetomidine 86347-14-0 Regulation (EU) 2015/1731 01/01/2016 01/01/2023 GB Approved
7 N-(Diclorofluoromethylthio-N’,N’-dimethyl-N-Phenylsulfamide (Dichlorofluanid) 214-118-7 1085-98-9 Regulation (EU) 2017/796 01/11/2018 01/01/2026 GB Approved N’-tert-butyl-N-cycloropropyl-6-(methylthio)-1,3,5-triazine-2,4-diamine (Cybutryne) 248-872-3 28159-98-0 Regulation /EU) 2016/107 NL Not Approved
Tyrithione zinc (Zinc pyrithione) 236-671-3 13463-41-7 SE Under review Tralopyril 122454-29-9 Regulation (EU) 1091/2014 01/04/2015 01/04/2025 GB Approved Zineb 235-180-1 12122-67-7 Regulation (EU) 92/2014 01/01/2016 01/01/2026 IE Approved
Copper pyrithione (CuPT) is a bactericidal and fungicidal compound with a high efficacy against the biofilm community and mild efficacy against macrofoulers (e.g. (Gutner-hoch et. al., 2018). It is considered neutral and non-persistent in the environment due to its rapid photolysis and its transformation/ degradation into less toxic compounds via interaction with others free metal ions present naturally in seawater (Maraldo et. al., 2004). This biocide is extremely toxic (EC50<0.1 mg/L) towards non-target organisms,
such as diatoms (Avelelas et. al., 2017) or early development stages of echinoderms (Gutner-hoch et. al., 2019); it also causes acute effects on corals, crustaceans and fish (Mochida, 2006; Bao et. al., 2014; Gutner-hoch et. al., 2019).
Sea-Nine 211™, the trademark of the fungicide DCOIT, is another widely-used booster biocide with high AF efficacy, especially against soft-foulers (Jacobson et. al., 2000). It can be found in Hempel or Sigma coatings (Table 2). In seawater, the half-life of Sea-Nine 211™ is reported to be less than 24 hours (Jacobson et. al., 2000), however a recent study demonstrated that it does not degrade at least for 168 h, in artificial saltwater (Figueiredo et. al., 2019). This biocide is also extremely toxic (EC50<0.1 mg/L) for
bacteria, microalgae, diatoms, macroalgae or early development stages of echinoderms (e.g. Fernández-alba et. al., 2002; Devilla et. al., 2005; Bellas, 2006; Ida et. al., 2013; Figueiredo et. al., 2019); it also causes acute effects on rotifers, bivalves, crustaceans and fish at low concentrations (< 1 mg/L) (e.g. (Mochida et. al., 2006; Yamada, 2007; Tsunemasa et. al., 2011; Figueiredo et. al., 2019).
8
Low degradation and high contamination (at µg/L levels) of European coastal waters and sediments by cybutryne (commercially known as Irgarol 1051) and diuron have been extensively reported (e.g. Readman et. al., 1993; Taylor et. al., 2010)). Both biocides exert acute and/or chronic effects on micro- and macroalgae, several groups of invertebrates and fish at very low doses (e.g. Perina, 2009; Bao et. al., 2011), posing a high environmental risk. As a consequence, cybutryne was already banned from the European market (Table 1) and Diuron was forbidden in some EU countries (Price et. al., 2012).
In order to decrease the toxicity and the early release of booster biocides, researchers from the University of Aveiro and the Portuguese company Smallmatek, proposed their encapsulation or immobilization in engineered nanomaterials1, such as nanoclays (layered double hydroxides) and silica mesoporous nanocapsules (DCOIT: Maia et. al., 2015; DCOIT and Ag: Figueiredo et. al., 2019; CuPT and ZnPT: Avelelas et. al., 2017). The toxicity of the booster biocides in its free and nano-forms was compared in several marine representative species and, globally, it was shown a toxicity reduction, up to 3 orders of magnitude (Avelelas et. al., 2017; Gutner-Hoch et. al., 2018, 2019; Figueiredo et. al., 2019). Although the toxicity, fate and behavior of these novel AF additives were already assessed in seawater, few information exist in terms of AF efficacy (Gutner-hoch et. al., 2018 for CuPT and ZnPT forms) and no data is available regarding their field performance in paints (because they were not yet commercially available).
There is in the market multiple references of biocide-release based AF coatings composed by a combination of authorized biocides, usually Cu2O plus a booster biocide (also called
co-biocide), which performance varies between 3 and 7.5 years (Table 2). The coating “Sea Quantum Ultra S” from Jotun (Table 2), a chemically hydrolyzing silyl acrylate AF coating containing 785 g/L of Cu2O and 66 g/L (3.7% w/w) of CuPT, is widely used in
streaming vessels (Takahashi, 2009; Road et. al., 2019) and it was selected as the commercial reference, i.e. a state-of-the-art coating with recognized efficacy, in the context of the present study. Published studies regarding the ecotoxicity of this type of paints are surprisingly scarce, taking into account the high number of commercial biocides-release AF coatings available in the market (Table 2) together with the high
1 Nanomaterial definition: “natural, incidental or manufactured material containing particles, in an unbound
state or as an aggregate or as an agglomerate and where, for 50 % or more of the particles in the number size distribution, one or more external dimensions is in the size range 1 nm - 100 nm.” (EU Recommendation on the definition of a nanomaterial (2011/696/EU)).
9
toxicity of the booster biocides (as previously highlighted). Karlsson et. al., (2004) showed that a total of five (out of six) tested paints were toxic to macroalgae and/or crustaceans even after two weeks of leakage. Karlsson et. al., (2006) demonstrated that those tested coatings were much more toxic than commercial biocide-free AF paints (polishing paints, Teflon paints, polymer waxes and paints with pepper extract). Later, (Karlsson et.al., 2010) demonstrated that globally ship paints were more toxic than leisure boat paints to bacteria, macroalgae and crustaceans. These authors also showed that one of the tested biocide-free paints was the most toxic from the entire set of tested paints concluding that compounds other than the main active ingredient(s) may be responsible by the observed toxicity (Karlsson et. al., 2010).
Therefore, a remarkable knowledge gap on conventional biocides-release AF paints ecotoxicity and efficacy can be stressed. In order to contribute with new knowledge in this scientific topic, the present thesis will address a holistic assessment of the field AF efficacy, toxicity and release rate of state-of-art and novel nano-based biocides-release AF paints which were formulated for this study.
Table 2: Characteristics of biocides-release based antifouling coatings of the biggest worldwide paint producers (Yebra et. al., 2004; Ameron, 2008; Takahashi, 2009)
Company Product Biocide Performance Remark
Jotun
Sea Quantum
Plus Cu2O/ CuPT 5 years Deep-sea vessel Sea Quantum
Ultra S Cu2O/ CuPT 7.5 years
Steaming vessels Ameron ABC-1-2-3 and
-4 Ziram/ Cu2O 3-5 years Hempel’s MP Globic 8190081950 Sea-Nine 211™/ Cu2O 7.5 years
Globic NCT Cu2O/CuPT 5 years Deep-sea vessel
International MC Intersmooth Ecoloflex SPC ZnPT 5-7.5 years Deep-sea vessel/ Coastal vessel Interswift 655 Cu2O/ CuPT 3 years Coastal vessel
Sigma Coatings Alphagen 10-20-50
Cu2O/ Sea-Nine
10
1.3 Thesis goals
• Assess the antifouling efficacy of conventional and new modified AF coatings in the field over time;
• Evaluate the toxicity of the coating’s leachates on microalgae and crustaceans; • Characterize the physiochemical properties and chemical composition of the
coating’s leachates.
1.4 Null Hypotheses
• The efficacy of the coatings is similar to the commercial reference over time; • The toxicity of the leachates of modified coatings is similar to the blank reference
over time;
• The physicochemical composition of the leachates of modified coatings is similar to the blank reference over time.
In order to accomplish these goals and validate these hypotheses, field and laboratorial studies were carried out in plates coated with modified and state-of-the-art coatings. The thesis is organized in three main sections: coatings characterization, coatings’ leachates ecotoxicity and chemistry (ecotoxicity and chemistry) and field antifouling efficacy, followed by a holistic data analysis, interpretation and discussion of the collected data.
11
2. Materials and Methods
2.1 Tested coatings
2.1.1 Coating preparation and application
The mild steel plates were prepared and painted on September 2018. A hole was drilled next to each corner to fix the plate and then, edges and surfaces were sanded. Plates were then individually cleaned with HCl and aminas (1:1), for 1 minute, washed with deionized water, degreased using ethanol 96% and dried with compressed air. The primer Safeguard Universal ES from Jotun, which is an epoxy vinyl-base coating, was applied to prevent corrosion, followed by the application of the tie-coat Safeguard Universal from Jotun, in order to promote a good adhesion between the primer and the topcoat. Then, the topcoat was applied above the other layers. A non-commercial top-coat, provided by Jotun, without biocides, was used to prepare a total of eight antifouling systems, by adding free booster biocides (DCOIT as Sea-Nine; Cu pyrithione (CuPT)), nanostructured biocides (Sea-Nine@SiNC; CuPT@Zn-Al LDH) or unloaded nanomaterials (SiNC; Zn-Al LDH; Cu-Al LDH, this one was selected due to the potential antifouling properties associated to the presence of Cu in the structure). Table 3 shows the list of 10 topcoats tested in the framework of this study (8 customized coatings, 1 blank and 1 commercial for benchmarking purposes) and the dry weight percentage of the additive added to the raw coating to prepare the customized formulations.
12
Table 3: List of additives and percentages used in the modified topcoats
Topcoat tested Additive Chemical dry weight %
SiNC Engineered nanomaterial: unloaded
mesoporous silica nanocapsules 3
Sea-Nine
Free booster biocide 4,5-Dichloro-2-octyl-4-isothiazolin-3-one (DCOIT), commercially
known as Sea-Nine 211™ (hereinafter abbreviated as Sea-Nine)
10 (3% DCOIT)
Sea-Nine@SiNC
Nanostructured Sea-Nine: spherical mesoporous silica nanocapsules loaded with
Sea-Nine
10 (3% DCOIT)
Cu-Al LDH Engineered nanomaterial: unloaded
copper-aluminum layered double hydroxides 10 Zn-Al LDH Engineered nanomaterial: unloaded
zinc-aluminum layered double hydroxides 10 CuPT Free booster biocide copper pyrithione
(CuPT) 4
CuPT@Zn-Al LDH
Nanostructured CuPT: zinc-aluminum
layered double hydroxides loaded with CuPT 4 (as CuPT) Blank reference Topcoat not commercially available (without
biocides) 0
Commercial reference
Commercial reference Sea Quantum Ultra S (Jotun) containing already two biocides (CuPT
and Cu2O)
13
2.1.2. Characterization of coated plates
2.1.2.1 Metallography
The characterization of the surface roughness (bottom view) and the coatings thickness (transversal view) of the painted plates was made using a stereo microscope (Nikon SMZ18), which combines macro- and micro-imaging. Roughness was randomly assessed all over the plate at different magnifications (7.5 to 40x). Thickness was monitored in squares of ≈ 2cm x 2 cm of each plate that were previously fix on resin mold. Resin was prepared by mixing 100 g of EpoKwick™ FC Epoxy Resin 20-3453-128 (BUEHLER®) and 25 g of EpoKwick™ FC Epoxy Hardener 20-3453-032 (BUEHLER®). The mold was smeared with a release agent, to facilitate the removal of the dry resin, and a total of roughly 15 mL of the resin mixture was added to the mold which already had the plate. The dried casts were polished using the METASERV 2000 Grinder/Polisher, sandpaper with appropriate granulometry (220, 280, 360, 500 and 600) and MicroPolish™ Alumina 1.0 and 0.3 µm (BUEHLER®) to obtain a smooth surface and a clearer view in the stereomicroscope. Photography and thickness measurement of different sections of all plates were made using the software Nikon SMZ18.
2.1.2.2 Fourier-Transform Infrared Spectroscopy
Fourier-Transform Infrared Spectroscopy (FTIR) analysis consists in the characterization of the chemical properties of the coating via absorption of infrared radiation. This analysis was performed by detaching a small piece of the topcoat with the aid of a scalpel and, whenever possible, individual particles of the topcoat were also analyzed. Spectra were collected in a Perkin Elmer spectrometer Spectrum Two with a UATR TWO unit (Diamond), 64 scans, 4 cm-1 resolution, in the region wavelength of 400 ~ 4000 cm-1. The comparation of the plates was made between the Blank reference vs Commercial reference, Cu-Al LDH vs Zn-Al LDH, SiNC vs Sea-Nine@SiNC and CuPT vs CuPT@Zn-Al LDH.
14
2.2. Coating leachates characterization and toxicity
2.2.1. Characterization and behavior of leachates over time
The release of chemicals (biocides, nanostructures or other chemicals present in the formulations) from the tested coatings and the leachates toxicity were assessed during 3 months by placing each plate (area of 216 cm2; n=1) in a tank containing 16 L of artificial
seawater (Ytreberg et. al., 2010), constantly recirculated with a pump EheimTM Compact
On (output of 300 L/h). The experimental design included also an aquarium with only artificial saltwater (no coated plates) to be used as a control of the bio-physico-chemical conditions along the entire period. Aquaria were previously decontaminated (acid wash (HNO3 5%) and basic wash 5% during 5h each) and washed with distilled water for 24h
and then tap water. Artificial saltwater (ASW; salinity 35) was prepared, in the day before, using Tropic Marin® Pro-Reef pharmaceutical grade sea salt (purchased from Tropic Marin®). Every week the following physicochemical parameters were measured: temperature, salinity, pH dissolved oxygen, nitrites and nitrates. From each aquarium, samples of 160 mL of water were taken for chemical analysis (3 x 50 mL for DCOIT and 10 mL for elements), 5 mL for dynamic light scattering measurements, and 24 mL for ecotoxicity tests (pls. see full description in the last section), on time 0, 1, 3, 6, 9 and 12 weeks of immersion. The volume of ASW in the aquaria were adjusted weekly considering the sampling and evaporation.
2.2.1.1. Dynamic Light Scattering
The size (diameter) of the particles/aggregates/agglomerates in suspension over time was assessed by dynamic light scattering (DLS) in order to assess their behavior in a high strength media (ASW). A Zetasizer Nano-ZS (Malvern Instruments, UK) was used for the DLS measurements on sub-samples of 1 mL (in triplicate). Aliquots were sonicated for 10 minutes in an ultrasonic bath (Selecta; 40 kHz), immediately before each reading to avoid the particles settling. This procedure was conducted at CICECO, UA.
15
2.2.1.2. High Performance Liquid Chromatography
The content of released DCOIT to ASW from aquaria containing the plates coated with Sea-Nine and Sea-Nine@SiNC-based formulations as well as from the aquarium with only ASW was quantified by High Performance Liquid Chromatography (HPLC). DCOIT was extracted and salts removed following a solid-phase extraction procedure. Cartridges (Finisterre C18 by Teknokroma™ 500 mg/6 mL) were first conditioned with 5 mL of methanol (in duplicate) and then with 5 mL of Milli-Q® ultra-pure (UP) water (in duplicate). Samples with a total volume of 50 mL were then loaded with a flow of 10 mL/min; then, the falcon was washed with 5 mL of 5% of methanol in UP water and loaded with the same flux the to ensure that all DCOIT was retained in the cartridges. After drying the cartridges, DCOIT was eluted with 5 mL of methanol, with a flow of 1 mL/min, in quadruplicate, and then, cartridges were dried again with nitrogen to force the elution of the analyte. The final volume (20 mL) was corrected with methanol whenever needed. Then, DCOIT concentration was determined in triplicate using a Shimadzu chromatograph, equipped with a SPD-M20A photodiode array UV-VIS detector, and a C18 reversed-phase Teknokroma™ column (TRACER EXCEL 120.5 µm x 25 cm x 0.46 cm) as the stationary phase and acetonitrile/ultra-pure water (90:10, v/v) as the mobile phase (flow rate: 1mL/min; temperature: 35ºC; injection volume: 50 µL). The peak was detected at retention time 6.7 min at 283nm. The calibration curve was performed in every time point using 6 DCOIT standards, dissolved in methanol; the correlation coefficient was higher than 0.999. All samples were filtered using a syringe with 0.22 µm PTFE filter to avoid contamination of the column. The column was washed with deionized water after the injection of each sample. This procedure was conducted at CICECO, UA.
16
2.2.1.3. Inductively Coupled Plasma Mass Spectrometry
The content of aluminum (Al), iron (Fe), copper (Cu) and zinc (Zn) was monitored by Inductively Coupled Plasma Mass Spectrometry (ICP-MS) in all leachates samples collected over time aiming at understanding if these elements were released from the coatings and there intrinsic constituents or added chemicals. A sample of 10 mL of leachate were collected in triplicate with a syringe filtered with a 0.22 µm cellulose acetate membrane. A total of 40 µL nitric acid (65%) was added to each sample and stored at 4ºC until analysis. Then, samples were diluted with ultra-pure water (1:20) and processed in the LCA, University of Aveiro using a Thermo, model X series.
2.2.1.4. Inductively Coupled Plasma – Optical Emission Spectrometry
Inductively Coupled Plasma – Optical Emission Spectrometry (ICP-OES) technique was also applied on samples from the week 6 to a have an overview of their elemental analysis, namel, alkali metals (lithium (Li), rubidium (Rb), celsium (Cs)), alkaline earth metals (beryllium (Be), strontium (Sr), barium (Ba)), metalloids: boron (B), arsenic (As), antimony (Sb)), nonmetals (phosphorus (P)), transition metals (vanadium (V), chromium (Cr), cobalt (Co), iron (Fe), manganese (Mn) nickel (Ni), copper (Cu), zinc (Zn), cadmium (Cd), post-transition metals (tin (Sn), lead (Pb), aluminum (Al)) and lanthanides (neodymium (Nd), samarium (Sm), europium (Eu), gadolinium (Gd), terbium (Tb), dysprosium (Dy), holmium (Ho), erbium (Er), thulium (Tm), lutetium (Lu), lanthanum (La), cerium (Ce), ytterbium (Yb)). Samples were collected similarly as the ICP-MS. They were also processed in the LCA, University of Aveiro using a Horiba Jobin Yvon, model Activa M. without any dilution.
17
2.2.2. Leachates ecotoxicity
Using three species chosen based on some features such as ecological relevance, laboratorial maintenance, short life cycles and contaminant sensitivity. A target species: Phaeodactylum tricornutum (a diatom) and two non- target species Tetraselmis chuii (a green microalgae the crustacean Artemia salina were performed acute toxicity tests. The preparation of each pre-culture of the microalgae was performed 4 days before the beginning of each test, using artificial saltwater (ASW) with reverse osmosis water and added artificial salt Tropic Marin® Pro-Reef, to salinity 35, then filtered (0.45 µm) and autoclaved at 120ºC for 20 minutes. The medium to the pre-culture was made by adding 2mL/L of Optimedium to the ASW prepared and 2 mL of each microalgae, in Erlenmeyer’s (250 mL) with 150 mL of medium, to enable gas exchange. The microalgae were maintained in laboratory at room temperature (19±1ºC) and photoperiod of 16:8h (light: dark) and agitated daily.
In 24 well plates were added 1 mL of medium (water from the aquarium) and 1 mL of microalgae. Each plate had a negative control (not contaminated ASW; n=8) and two testing coatings (n=8 each), for the microalgae and for the crustacean n=6. On each day (0h, 24h, 48h and 72h) the cell density of the microalgae test was measured via spectrophotometry at 700 nm. To ensure a homogenized measurement, each well was resuspended with the help of a Pasteur pipette immediately before each reading.
2.2.2.1. Crustaceans acute toxicity
The Artemia salina dry cysts hydration lasted 30 minutes in 300mL of reverse osmosis water, aeration and lighting. To check the full hydration was collected a sample and under a binocular lens, and then added 700mL of ASW (salinity 35), to the final salinity of 25. The organisms hatched after 16-24 hours. After 24h, the stage 2nd/3rd is archived and those
organisms in that stage are used after washed in new ASW. The mortality was observed after 24 and 48h (end of the test) and confirmed under a magnifying glass observation if the immobilization was superior to 10 seconds.
18
2.2.2.2. Microalgae growth inhibition effects
The tests were performed by following the guideline ISO 10253.2016. The growth inhibition of each species was calculated at 72 hours was, following the equation: % Ir =(μc− μT)
μc 𝑥100
% Ir: percent inhibition in average specific growth rate;
• μC: mean value for average specific growth rate (μ) in the control group; • μT: average specific growth rate for the treatment replicate):
2.2.2.3 Statistical analysis
Data normality and homoscedasticity were tested with the Shapiro-Wilks tests. If these assumptions were verified, a one-way analysis of variance (one-way ANOVA) test was performed using the software SigmaPlot v.12.5 to evaluate significant differences among treatments and both commercial reference and the coating without biocides (p<0.05). Additionally, leachates toxicity was also compared between coatings modified with biocides in its free and nano-forms (Sea-Nine vs Sea-Nine@SiNC; CuPT vs CuPT@Zn-Al LDH; CuPT vs Cu-CuPT@Zn-Al LDH and CuPT@Zn-CuPT@Zn-Al LDH vs Cu-CuPT@Zn-Al LDH). In the presence of differences, a Tukey test followed the ANOVA. If data failed the normality and/or the homoscedastic assumptions data was transformed (i.e., square, Ln, Log10, reciprocal,
exponential and square root). If these transformations did not comply with the aim for normality and homoscedasticity, a one-way ANOVA on Ranks was run, followed by a Dunn’s test.
19
2.3. Field efficacy testing
2.3.1 Experimental set-up
The antifouling efficacy of tested paints was evaluated by placing an experimental set up in the marina of Gafanha da Encarnação (40.628320, -8.735606) (Figure 4), on October 2018, containing the 9 coatings (1 reference without AF biocides, 1 state-of-the-art coating and 7 test AF formulations with different additives; pls. cf. Table 3), in triplicate, in a total of 27 panels. The place was chosen based on parameters, such as water renovation (close to the “mouth” of the marina and the entrance of the Ria de Aveiro lagoon), solar orientation (south), water depth, constant salinity, in fully agreement with the guideline ISO 15181-1:2007. The depth below the surface of the water was variable according to the tides, without records of emersion periods. The set-up was not protected with cages to mimic predation as in real conditions. The marina is a private area with controlled access ensuring the security of tested system over the entire immersion time.
20
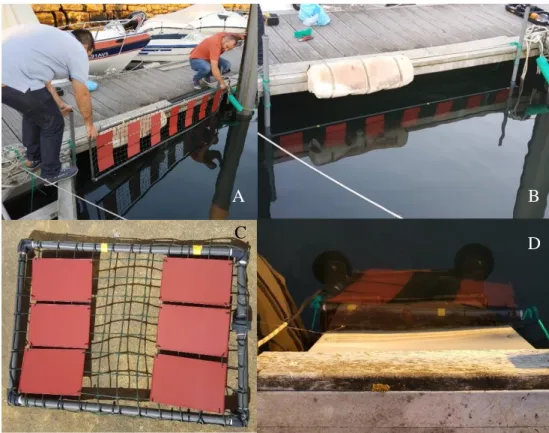
Figure 5: A: Immersion of the system containing 7 out of 9 coatings (Commercial reference, CuPT, CuPT@Zn-Al LDH, Sea-Nine, Sea-Nine@SiNC, SiNC and Cu-Al LDH); B: Immersed Larger system; C: Dry smaller system (with
the coatings Zn-Al LDH and Blank reference; D: Immersed smaller system
The 12 x18 cm plates were tied in a plastic net with 21 cm between each coating and 1 cm between each replicate (n=3), positioned vertically and perpendicularly to the bottom (Figure 5). Unlike other similar studies (Cassé et. al., 2006), the experimental set-up was permanently immersed following the abovementioned ISO guideline, and suspended at approximately 25 cm above the sediment. The largest system, containing the Commercial reference, CuPT, CuPT@Zn-Al LDH, Sea-Nine, Sea-Nine@SiNC, SiNC and Cu-Al LDH coated plates, was fixed between two PVC pipes, pendant in hooks to the platform with the objective of allowing the plates to go up and down consonant the amplitude of the tides. The smaller system, containing the unloaded Zn-Al LDH (a low-toxic nanomaterial without biocides; ex. Avelelas et. al., 2017) and Blank reference coated plates, was immersed five meters forward of the other, in the same conditions of the other (one-meter depth, southern-dominant solar exposure). A separation of the coatings in two different systems was chosen to avoid the effects of the biocides leaching from the coatings without any biocides. Each column (with three similar plates) is composed by the same coating, to avoid cross contamination of the leachates.
A B
C
21
2.3.2 Sampling
Biological sampling included microbiological and microphytobenthos (diatoms). Microfouling was sampled periodically, according to the expected settlement of foulers: first (11/10/2018), third (25/10/2018), sixth (15/11/2018), ninth (06/12/2018) and twelfth (27/12/2019) week of immersion. Then, plates were photographed once a month to evaluate the presence of fouling, particularly macrofouling.
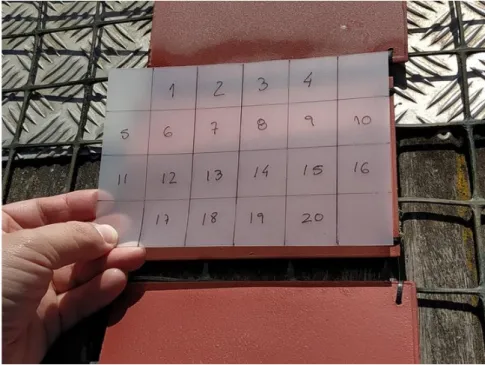
In each period, a sample of 3 x 3 cm (9cm2) was taken for bacteria (1, 3 and 6 weeks of immersion) and microphytobenthos (1, 3, 6, 9 and 12 weeks of immersion), collected by gentle scraping without damaging the paint surface. The sampling area was randomly using the software Research Randomizer. Every sampling was made in a different area each week, as the numbers never repeated itself in the same plate, for the same biological endpoint (Figure 6).
Figure 6: Auxiliary sheet to locate randomized areas for collecting both bacteria and microphytobenthos samples.
The sampling area was previously watered with 1 mL of 0.22 µm filtered natural seawater collected in the marine for both bacteria and diatoms. Water was filtered in order to remove particles and microorganisms present in water. In the case of the samples for microphytobenthos, the sampling area was gently scraped with the tip of a Pasteur pipette
22
(without damaging the coating); then, the sample was collected with the pipette to a microtube and the final volume adjusted to 1.5 mL. Bacteria were collected by swabbing the surface with a sterilized swab, which was then cut to a length of 2.5 cm and placed on a sterilized 2 mL microtube. The material was carefully sterilized among samples to avoid crosscontamination. Samples were preserved in liquid nitrogen and then stored in a -80ºC ultra-freezer until the DNA extraction.
Relevant seawater physico-chemical parameters were measured weekly. To measure the salinity was used a refractometer (V2 refractometer). The dissolved oxygen and temperature were obtained by an oximeter (WTW Oxi 330 Oxygen meter with CellOx 325 sensor). The pH was measured using a Hanna HALO pH probe (with Bluetooth® Smart technology-Hanna Instruments).
2.3.3 Characterization of the microbiological communities
In order to characterize the bacterial communities in the first six weeks of immersion, sample pools (n=1 per coating system) were submitted to a step of DNA extraction and a Polymerase Chain Reaction (PCR) followed by a Denaturing Gradient Gel-Electrophoresis (DGGE).
The total genomic DNA extraction and respective PCR were performed during November 2018, following the protocol provided by PureLink™ Microbiome DNA Purification Kit Used Guide (Rectal or Environmental Swab Samples). The extracted DNA was kept in the refrigerator at 4 ºC. Before each use, they were slowly thawed with ice to avoid thermal shock and DNA damage. The PCR, a critical step to confirm the correct amplification of the samples and markers, was accomplished using a C1000Touch™ Thermal Cycler. The PCR was performed using a reaction mixture (25 µL) containing 12.50 µL NZYTaq 2 x Green Master Mix (2.5 mM MgCl2; 200 µM dNTPs; 0.2 U µL-1
DNA polymerase, NZYtech, Portugal), 10.00 µL of ultrapure water and primers, namely 0.75 µL of 799F_GC (forward primer) and 0.75µL of / 1115R (reverse primer) (cf. Table 4). The program for PCR reaction included the following heating steps: 95ºC for 7 min, 35 cycles of 95ºC for 30 (denaturing), 53ºC for 1 min (annealing), 72ºC for 1 min (extension), and 72ºC for 30 min. The PCR products were then charged in 1.5% agarose gel to perform the electrophoresis, a technique which creates many copies of a particular DNA region in vitro by amplifying the 16S rDNA region (Muyzer, De Wall and
23
Uitterlinden, 1993). The DGGE followed the protocol of Bio-Rad DCODE gel electrophoresis gel system. This was performed on a D-Code Universal Mutation Detection System (Bio-Rad) with in 1xTAE buffer (Sigma-Aldrich, Germany) at 60ºC, 90V, for 1 h. The DNA molecular weight marker Methylobacterium sp. N355 (GeneRuler™ DNA ladder Mix – Thermo Fisher Scientific, USA) was used as a reference standard. In each gel, a combination of sample pools was made, as follows: week 1 vs. week 3, week 1 vs. week 6 and week 3 vs. week 6 (note: samples can be compared within each gel, however gels should not be compared due to methodological constraints). In the end of this step, the gel was stained in a solution of 0.5 µg mL-1 ethidium bromide (Sigma,USA) for 20 min., and then washed in distilled water. An UV light with the imaging Molecular Imager® Gel Doc™ XR+ System (Bio-Rad, USA) was used to capture the gel images.
Table 4: Primers tested for 16S rRNA gene amplification (Chelius and Triplett, 2001)
Forward primer name Reverse primer name Forward primer sequence (5’-3’) Reverse primer sequence (5’-3’) Annealing T(ºC) 799F_GC 1115R AACMGGATTA GATACCCKG AGGGTTGCGCTCG TTG 53
For DGGE analysis, banding patterns similarity was analyzed with the Bionumerics Software (Applied Maths, Belgium). A classification analysis (i.e. dendrogram) was run using the Pearson coefficient based on the densiometric curve values. Bacterial diversity was estimated by the richness index (S), Shannon index of diversity (H’) (Shannon and Weaver, 1949) and Pielou’s evenness index (J), calculated using PRIMER v6 software (Primer-E Ltd, Plymouth, UK).
24
2.3.4 Characterization of the microphytobenthos communities
Fluorescence measuring techniques are often used to analyze the levels of chlorophyll a present in photosynthetic organisms, and also to assess the microalgal biomass, via pulse amplitude modulated (PAM) fluorometry (Herlory, Richard and Blanchard, 2007). Thus, in the present study, microphytobenthos communities of the biofouling early stages were characterized in terms of biomass, photosynthetic yield and abundance. Samples collected in the field were rapidly analyzed in the laboratory in terms of fluorescence. Then, samples were fixed in lugol (1%). Fluorescence measurements were performed in a Multiple Excitation Wavelength Chlorophyll Fluorescence Analyzer MULTI-COLOR-PAM, which is a very sensitive instrument to photosynthesis parameters, in suspended solutions of algae, cyanobacteria and other photosynthetic forms. Records had a dark and light phase, which included a modulated measuring light (ML) at wavelength of 440 nm and actinic light (AL) white color (the most adequate for this kind of samples). To assess these parameters was used the software PamWin-3 (Walz, Germany). It measures in the darkness: the minimum fluorescence (F0), as proxy for biomass values, maximum
fluorescence (Fm), variable fluorescence (Fv), the maximum light utilization efficiency of
photosystem II (PS II) (Fv/Fm) (𝐹𝑣
𝐹𝑚 = 𝐹𝑚− 0
𝐹𝑚 ) and Y(II), the effective photochemical
quantum yield of PS II (Taylor et al., 2005). The F0, Fm, and Y(II) were measured to
obtain the yield and biomass of the samples.
The diatoms abundance was also determined by direct counting using the Neubauer chamber, in triplicate.
2.3.5 Characterization of the macrofoulers communities
In the field, photo sampling was performed, first by following the sampling times of mentioned above and then began to take place monthly up until one year of immersion. The software ImageJ was used to estimate the area covered by each major fouling components: biofilm, macroalgae and macroinvertebrates over time.
25
2.4. Multivariate data analysis
Multivariate analysis was used to discriminate groups of coatings in terms of efficacy and toxicity over the first 3 months of immersion.
The efficacy (coverage of biofilm, macroalgae and macrofoulers; yield, biomass and abundance of microphytobenthos) and toxicity (diatom and microalgae growth inhibition; crustacean acute toxicity) data matrix per coating in each sampling period was normalized transformed and the Euclidean distance matrix calculated between variables. The dissimilarity matrix was analyzed using ordination analysis, with principal coordinates (PCO). Most correlated physicochemical variables (Spearman rho>0.7) were superimposed as blue vectors. This statistical analysis was performed using the software PRIMER & PERMANOVA v.6.
26
3. Results
3.1.2.1 Metallography
The images obtained via a stereo microscope (Nikon SMZ18) of the surface of each painted plate are represented with letters in Figure 7. The images revealed that the roughness of the surface was higher in the coatings containing nanomaterials (C, D, E, H and I). Coatings with free booster biocides have a smooth surface, as well as the controls (Commercial and Blank reference).
Figure 7: Top view of the coatings surface using a stereo microscope A: Commercial reference B: Blank reference C: Cu-Al LDH
D: Zn-Al LDH E: CuPT@Zn-Al LDH F: CuPT
27
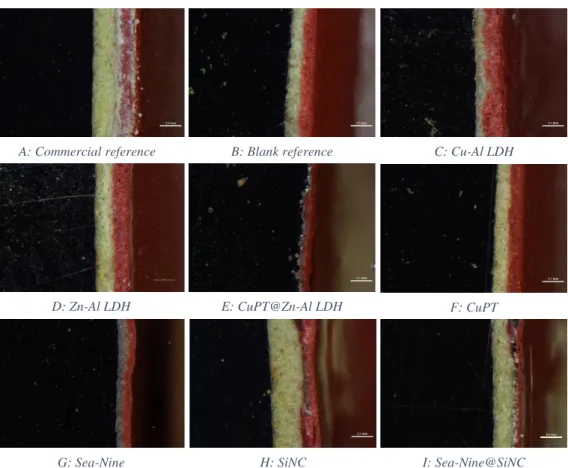
The images obtained via a stereo microscope (Nikon SMZ18) of the cross section of each painted plate are represented with letters in Figure 8. In the images is possible to distinguish clearly the plate (black), the primer (beige) and the topcoat (red). The images revealed that the thickness varies between the different coatings.
The Blank reference (B), Zn-Al LDH (D) and CuPT (F) demonstrate a clear and homogeneous separation between the primer and the top-coat. The CuPT@Zn-Al LDH (E) seems to reveal absence of the primer layer and the topcoat which is not clearly seen in CuPT@Zn-Al LDH coating (E).
Coatings with silica nanocapsules (H and I) were not homogenously attached to the primer, possibly due to the presence of air in the moment of application or big aggregates of additives. However, this was not a relevant factor for the efficacy of the coating.
Figure 8: Images of the cross section of each plate coated using stereo microscope (Nikon SMZ18) (magnification 13.5nm)
A: Commercial reference B: Blank reference C: Cu-Al LDH
D: Zn-Al LDH E: CuPT@Zn-Al LDH F: CuPT
28
3.1.2.2 FTIR
a) Comparison between the Blank reference (no biocides) and the Commercial reference (Sea Quantum Ultra S)
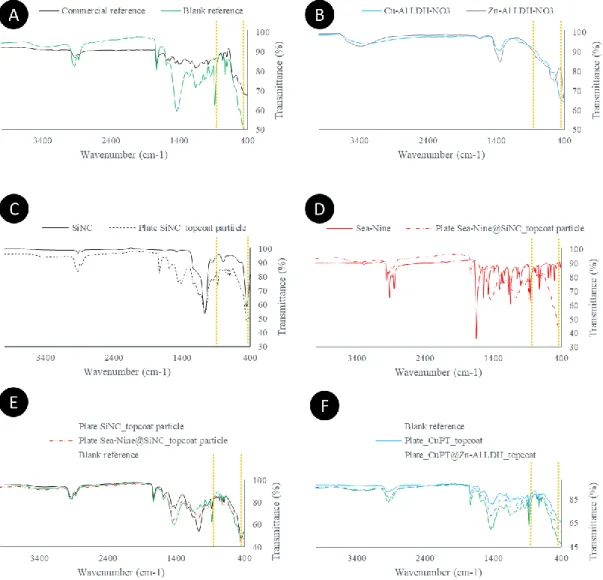
Broadness in the region between 700-400 cm-1 is indicative of the presence of inorganic fillers, namely metallic oxides (Figure 9A). Also, a sharp peak around 878 cm-1 reveals the presence of other filler, inorganic carbonate, in the blank reference spectrum. The presence of organic aliphatic components of solvents and binders is demonstrated by C-H asymmetric and symmetric stretching (2860-2950 cm-1) and bending vibrations
(1350-1480 cm-1) (Figure 9A). Peaks around 1730 and 1155 cm-1 may refer to C=O and C-O
stretching vibrations of ester groups and broad peaks at 3300 cm-1 are characteristic of O-H group vibrations (Figure 9A). The spectrum of the commercial reference is weaker in terms of peak intensity, biocides are not traceable, and, as expected, no main chemical differences are noticeable (Figure 9A) since the blank reference is the raw formulation (without active ingredients) that Jotun uses to produce the Sea Quantum Ultra S (commercial reference).
b) Comparison between the coating with Cu-Al LDH-nitrate and Zn-Al LDH-nitrate Differences between spectra of the topcoat with copper- or zinc-based LDH are not perceptible (Figure 9B). The presence of LDH material is not traceable when compared to the blank reference (spectra not shown; cf. Figure 9A).
c) Comparison between the coating containing SiNC and the biocide (Sea-Nine) encapsulated in nanocapsules mesoporous of silica (Sea-Nine@SiNC)
Figure 9C shows the spectra of the coating containing empty silica nanocapsules and the respective powder of this nanomaterial, while Figure 9D shows the FTIR spectra of the encapsulated form of the biocide Sea-Nine, as well as the powder form of the free biocide respectively. Figure 9E shows the spectra of the SiNC topcoat, the loaded form of the silica nanocapsules (Sea-Nine@SiNC) and the blank reference. The presence of SiO2
capsules is confirmed by the characteristic Si–O stretching and rocking bands, located at 1066 and 444 cm-1, respectively, in the SiNC_particle and Sea-Nine@SiNC spectrum.
29
On the other hand, the presence of Sea-Nine in the coating is not confirmed although some peaks are coincident.
d) Comparison of coatings containing the biocide CuPT and the biocide (CuPT) immobilized in LDH (CuPT@Zn-Al LDH)
Figure 9F represents the spectra of the blank reference, as well as the free biocide CuPT topcoat and the biocide immobilized (CuPT@Zn-Al LDH). The presence of copper pyrithione biocide was detected in both coatings containing free and intercalated CuPT (in Zn-Al LDH). This could be confirmed by the presence of aromatic C-H stretching around 3020-3098 cm-1 and C=C stretching at 1544 cm-1, and C-N stretching at 1195 cm
30
Figure 9: FTIR representation of the coatings topcoats and particles. A: FTIR spectra of Commercial reference and Blank reference; B: FTIR spectra of coating containing Cu-Al LDH-nitrate and Zn-Al LDH-nitrate; C: FTIR spectra
of SiNC powder and SiNC topcoat; D: FTIR spectra of Sea-Nine powder and Sea-Nine@SiNC topcoat; E: FTIR spectra of SiNC top-coat, Sea-Nine@SiNC top-coat and Blank reference; F: FTIR spectra of CuPT topcoat and
31
3.2. Coating leachates
3.2.1. Characterization and behavior of leachates over time
3.2.1.1 DLS
Table 5 resumes the average diameter of the suspended particles in each aquaria considering all sampling times. Figure 10 represents the average diameter of the particles in suspension over time in the different aquaria. In some samples, large aggregates/agglomerates (sub-micron sized) were detected in the leachates over time, indifferently of the main additive of the tested coatings. The sample control (ASW) does not have any plate, only artificial salt water.
Table 5: Resume of samples size (average of the sampling times)
Sample Size (average) (nm)
Control (ASW) 539.6 Blank reference 478.1 Commercial reference 294.8 Cu-Al LDH 408.1 CuPT 545.9 CuPT@Zn-Al LDH 362.5 Zn-Al LDH 598.0 Sea-Nine 452.4 Sea-Nine@SiNC 617.2 SiNC 505.1