MANAGEMENTOF QUALITY RELATED COSTS. THE CASE OF PORTUGUESE COMPANIES
António Ramos Pires, Coordinator Professor, PolytechnicInstituteof Setúbal, [email protected], Campus do IPS, Estefanilha, 2910-761 Setúbal, Portugal
AlionaCociorva, Invited Assistant, Polytechnic Instituteof
Leiria,[email protected],Santuário de Nossa Senhora dos Remédios, 2520–641 Peniche, Portugal
Margarida Saraiva, Assistant Professor,University of Évora, [email protected], Largo dos Colegiais n.º 2, 7000-803 Évora, Portugal
Jorge Casas Novas, Assistant Professor, University of Évora, [email protected], Largo dos Colegiais n.º 2, 7000-803 Évora, Portugal
Álvaro Rosa, Assistant Professor, ISCTE Business School - IUL, [email protected], Av. das Forças Armadas, 1649-026 Lisboa, Portugal
Abstract
The traditional viewof quality related costs (QRC) tries tojustify investment in preventionasa way to reduce the costs offailure. Butthisstatic viewmust countera moredynamic vision that fosterscontinuous improvementand assessesthe costs andbenefits of implementingtechniques and methods ofquality management, such ascertification ofISO 9001systems.
However, it is unknown whether such companies are also engaged in the management of QRC, arising from activities undertaken, either at the level of monitoring, or coming from failures, and if such organizations verify (or not) the recovery of investments in quality. In this sense, the present article aims to provide insight into the procedures adopted by Portuguese companies in managing QRC, and to assess the extent to which management reports allow the analysis of quality costs and contribute to the related planning and control activities.
The results of this study showed that there is hardly any assent to the implementation of formal mechanisms for planning and control of QRC, and to the explicit identification and segregation of those costs in management reports.
Key Words: Costs, Quality, Management, System Categorize: Research Paper
1. Measuring and Evaluating the Quality Related Costs
Lopes and Capricho (2007)warn that the costs of poor quality are barely visible in companies,which do not give them much importance, insofar as they are derived from the sum of large amounts of small deviations, which become a real iceberg of hidden costswherethe visible portion may be the least important.
Gross margin and operating income grow whenever the quality system eliminates the costs of poor quality, to a greater extent than the total costs required for such a system to
On the other hand, Robles Jr. (2003) argues that, by reducing waste, the company can generate resources to leverage its quality improvement system and consequently the return on investment in quality would be obtained primarily by reducing waste.
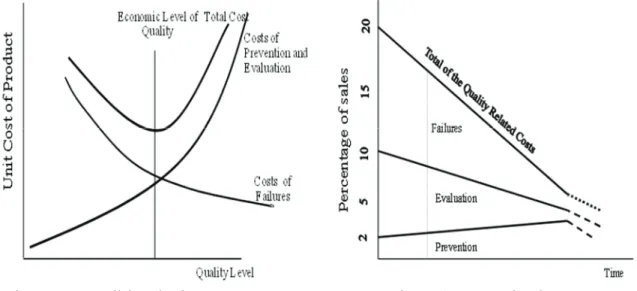
The traditional view of QRC tries to justify investment in prevention as a way to reduce the costs of failure (Figure 1). But this static view must counter a more dynamic vision that fosters continuous improvement and assesses the costs and benefits of implementing techniques and methods of quality management, such as the certification of ISO 9001systems (Figure 2).
Figure 1 – Traditional View Figure 2–Dynamic view(Pires, 2007)
Referring to theimportanceof QRC, Pereira e Ganhão (1992:91) state that “the cost of quality is theresulting costof makingpoor procedures”. It isatype of measurementthat turnsmistakesinto monetary unitsand this hasahuge impactin organizations, especially in management. Forthese authors, the managementof QRCmakes it possible to determinethe benefitsof remedial and improvement actions(AECA, 2003; ASQC, 1986; Sellés and Carbonell, 2002).
TableIpresents the modelfor determining theTotal CostofQuality, according to Bank(1998), whereQuality Costs+NonQualityCosts=Total CostofQuality.
Table I–Total Costs of Quality
Total Costs of Quality =
Quality Costs
+
Non Quality Costs
Costs of the product characteristics Costs of defects and their resolution Costs of excessive client demands Internal failure costs
Prevention Costs External Failure costs Evaluation Costs Missed opportunity costs
Source: Adapted fromBank(1998)
In this sense, prevention costsare thecosts of theaction taken to preventthe occurrence of faults/errors/non-conformities andevaluation costsare thecosts ofdetermining the levelof quality achievedby the product/ service(Pereira and Ganhão, 1992; Ganhão, 2001; Camaleño, 2006; Calderón and Novas, 2009).On the otherhand,costsresulting from failure are costsrelated to the occurrenceofdefective units/ components,identifiedwithin the organization oroutside italready. Failurescan be divided intointernal andexternal faults (Villar and López,
2007). Internal failure costsare the resultof the inabilityof a product orservice to meet thequality requirementsbefore its supply;externalfailure costsare those resultingfrom the inabilityof a productor serviceto meet the quality requirements,afterits supply, that isthey reflectthe expensesarising fromissues identifiedoutside the company(Shank and Govindarajan, 1997; Silva, 1999; Wernke and Bornia, 2000; Carvalhoand Paladini, 2006) (see Figure 1).
In this regard, António andTeixeira(2007)report that theunderlying principle is that investmentin suitablequality planningandprevention activitiescanlead toasubstantial reductionin the cost ofinternal and external failureand evenevaluation costs.Theseauthorsalso point out thatincreased spendingon preventionis intendedto diminishor evennegate theother typesof quality costs (see Figure 2).
Carvalhoand Paladini(2006)statethat the quantificationof QRCallowsthe organization to identifynot onlylosses arising fromproblems, but also to quantifythat investmentsin preventionhave achievedthe expected result.It also indicates that thesystematic collection and analysisof quality costsenablesthe organizationtoverify the behaviorof these costsover time.
From this perspective, to Robles Jr. (1996, 2003), the quantification of quality through QRC, is seen by administrators as a way to achieve several objectives, among these are:
The evaluation of quality programs through monetary and non monetary quantification;
The possibility of setting targets for quality programs, assigning priorities, through the Pareto method, to those who may obtain better results for the company immediately; To accurately understand, how much the company is losing due to lack of quality,
raising the commitmentof management to meet the challenge of improving quality; To understand the distribution of costs among different categories of QRC, which
allows direct investments in accordance to quality improvement projects;
To promote quality as a strategic aim for the company, involving top management througheffectively quantifying monetary and non monetary (physical), and ensuring their commitment to quality;
To improve quality to obtain increased profit without price increases and significant additional investments in facilities, equipment and human resources;
To increase productivity through quality;
Assess the suitability of the maintenance program, as delays in the maintenance schedule can affect the level of quality of processes and products;
To systematize the knowledge and influence of the different consequences of lack of quality in the company, such as sales returns, cancelled orders, changed, and especially nonplaced orders, and other billing errors;
To really understand, how much the company has been investing in the different categories of quality costs;
To therefore infer how much the company should invest in the different categories of quality costs;
Set objectives and resources for staff training;
To facilitate the assessment of the effect of quality on cost and value of products and services;
Among others.
According toCrosby(1979),the purpose for calculatingQRCis: to identify the price ofnon-compliance;to provide abasis to verifyquality improvement.
However, according toRoblesJr.(2003), information about QRCalone will notleadto improvements inquality.Nevertheless, suchinformationshould be reviewedbytop management, in order toconsequentlydetermine actionsto improvequality.For these reasons, the author stresses that thecontrol departmentmustensure the"quality" ofinformation aboutQRCascapital costscan beomitted intheirreports, while others may be includedimproperly (Jordan et al., 2002; Neves, 2004; Oliveira, 2006).
Sakurai(1997), cited by Souza andCollaziol(2006), while defending theusefulness ofabudget plan forQRC, emphasizesthat when the companywants to establishaneffectivetargetto control the activityof management,the costs ofprevention and evaluationare good indicatorsfor assessingperformance.
2. Methodology
Problemand objectivestudy
The main objectiveof this researchis based on empirical analysisofbusiness practicerelating toplanning and controlof QRC, in Portuguese firmscertifiedISO 9001.
Selection and characterizationof the sample
The sample wasselected fromanaccessible populationconsisting of4512companies, working in Portugal(Motaetal, 2008).In order to obtainthe best representationwe usedthe method ofstratified and systematic random samplingfor selectingthe sample.Of the total questionnaires (1131) 154answers were obtained,which corresponds toa rate of13.6%.Thisstudy lookedprimarily atsevenvariables, grouped intofourgroups(classification, budgeting, measurement, analysis and management reportingof quality costs).Data collectiontook place betweenJune andJuly2009and was developedthrough a survey, based on studies ofCrosby(1994), Feigenbaum(1994), TatikondaandTatikonda(1996) and Souza andCollaziol(2006).
Variables in study
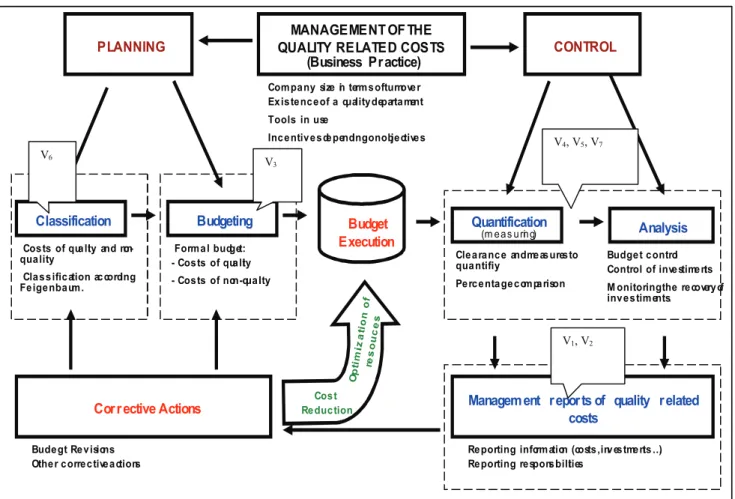
This investigation concerns the planning and control of quality costs, and addressed Portuguese companies certified by one of the ISO reference, covered7 variables essentially grouped into four groups (classification, budgeting, measurement, analysis and management reporting of quality costs) (see Figure 3):
V1-Identification of quality costs in management reports; V2-Specific Reporting of quality costs;
V3-Preparation of budget plans of quality costs;
V4-Analysis of the actual performance of quality costs; V5-Investment control in quality;
V6-Analysis of quality costs by category; V7-Using indicators of poor quality.
Instrument anddata analysis
Data collectiontook place betweenJune andJuly2009and was developedthrough a survey, embodied in aquestionnaire comprisingmainlyclosed questions, sent by posttoselected companies, addressed to the person responsiblefor managing thequality system. Methodologically, the questionnaire was prepared in accordancewith the study objectives. Before itsfinal implementation, and according toLakatos andMarconi(1991), the
questionnaire was subject toapre-test, applied to six respondentswith the desired profilefor the research, whose companieswere not part of thesample usedin the study.
Regarding content, and considering the objectives of the survey, the questionnaire was based on studies of Crosby (1994), Feigenbaum (1994), Tatikonda and Tatikonda (1996) and Souza and Collaziol (2006).
To describe and summarize the data characteristics that belong to the whole sample, we used techniques of descriptive statistics, with the use of SPSS software (version 16.0): The quantification of absolute and relative frequencies; An intersection of variables; tests of independence (Pearson Chi-Square) between the variables studied. In addition to this quantitative analysis, data was subjected to further analysis of a qualitative nature
Figure 3 – Variables of the Quality Related Costs
3. Findings
The vast majority (45.5%) ofparticipantsin this study weremainlysmall and mediummanufacturing industry, according to the Portuguese industrial structure, IAPMEI (2008),which certainly influencedthe responsesregarding theplanning and controlof quality costs. The legal form of companies studied, were mostly limited companies (59,7%). The respondentswere fairlybalancedbetweenfemales(80 -52.3%) andmales(73 to 47.7%) and mostlylicensedindividuals(107 -69.5%).
MANAGEMENT OF THE QUALITY RELATED COSTS
(Business Pr actice)
CONTROL
Classification Budgeting Quantification
(m e a s u rin g) Analysis
PLANNING
Budget Execution Com pa ny size in term s of turnove r Ex is te nc e of a quality departa ment Tools in use
Inc e ntiv e s de pending on obje ctive s
Cos ts of qua lity and non-qua lity
Cla s s ific ation ac cording Fe ige nba um .
Form a l budget: - Cos ts of qua lity - Cos ts of non-qua lity
Cle a ra nc e andme as ures to qua ntifiy
Pe rc e nta ge c om pa rison
Budge t c ontrol Control of inve stime nts M onitoring the re covery of inv e s tim ents.
Managem ent r epor ts of quality r elated costs
Re porting inform ation (costs , inv es tme nts …) Re porting re spons ibilities
Cor r ective Actions Bude gt Re v isions
Othe r c orre c tive a ctions
Cos t Re duc tion V6 V 3 V4, V5, V7 V1, V2
The quantitative analysisshowed there waslittle sensitivity tothe impactof quality costsin total costs,asmost companiesinthe study:
Did not havea departmentresponsible for issuingreportsand analysisof quality costs because they found noadvantagein, eitherthe creationof that structure, or because theywere unaware of thebenefits;
Did notcarry outclassificationof quality costsaccording to their nature;
Norclassify quality costsby categoryand did not identifythe QRC with missed opportunities;
Did notshowthe costs of qualityin management reportsanddid not identify thequality costsin the P&L statement;
Did notpreparebudget plansfor quality costs; Did notcarry outperformance analysis ofQRC;
Did notestablishrelationshipsbetween QRC and otherqualityindicators; Did notcontrolthe investment inquality.
From theprior analysisof dataand results,ten pairs ofvariableswere considered, and possiblerelationships of dependence were sought.Initially, wecrossed pairs of variables, all nominalandwith twocategories(Yes and No), socorrespondingto dichotomous variables. Thefirstpair ofvariables considersthe possible relationship between the explicit and isolated identificationofQRC in management reports and the existence ofspecificQRC reports.
From theresultsobtained,ofthe145 companiesconsidered in the analysis, 77 (53.1%) producedspecific QRC reports. However, only49.1% of these carryout theexplicit and isolated identificationof QRCin management reports. Though, only4.4% of companies did not reportspecific QRCand carried out theexplicit identificationandisolationof thesein management reports-that is to saythat 95.6% of companies did not reportspecificQRC, did not proceedalso tomake them explicitin management reports-and, on theother hand, 92.7% of companies that explicitly andseparatelyidentifyQRCin management reports, also preparespecific reportsof QRC.
Secondly,thepossible relationshipbetween thepreparation of specificQRC reportsand the preparation ofbudget plans forQRC was studied. The data obtained, inthis casefocusedon148companies, showed that52.7% of companies prepared specificQRC, and of these,44.9%alsopreparebudget plans. On the other hand, 81.4% of companies preparebudget plansfor QRC, alsopreparespecific reportsof QRC. Finally, 88.6% of the 70companies thatdid not prepare specificQRC reports, did not preparebudget plansalso. Thus, it ispermissible to considerthe existence ofa relationship betweenboth variables.
The relationship betweenthe preparation ofbudget plansfor quality costsand theexplicit identificationandisolationof QRCin management reports was also analysed. The resultsshowed that the majority(52.7%) ofcompanies preparingbudget plansfor the QRCdid not identify these types of costs in management reports. On the other hand, 51.2% of companies that explicitlyidentifiedand isolatedQRCin management reports, did not prepare budget plans for those costs. Finally, alarge percentage ofcompanieswhich did not preparebudget plansforQRC, alsodid not identifyQRC explicitlyand in isolationin management reports. 56.3%of total companies were intheseconditions, accounting for percentagesnear80%in the respective categories.
We thenproceededto the intersection ofvariablesrelating to thepreparation of specificQRCand theexplicit and isolated identificationof QRC in management reportswith the variablerelating
to theanalysis ofactual performanceof QRC. A first analysisof the datashowed alarge number of companiesthat did notanalyze theactual performanceof QRC, regardless of specificreportingon QRC. 100 companies were in thesecircumstances, representing 69% of the145companies considered in theanalysis.On the other hand, 53.1% of companies had specific QRC reports, regardless of carrying out analysis ofactual performanceof this type of costs. The processconcludedalso that51.9% of companies considered in the analysisreported on a specificQRC, andsimultaneouslycarried out analysisof the actual performanceof this type of costs. On the other hand, 92.6% of companies that did not preparespecific QRC reports,did not analyzetheactual performanceof quality related costs.
In regards tothe relationship between theexplicit identificationandisolationof QRC in management reportsand the analysisof the actual performanceof QRC, the results show that 15.7% of the 140 companiesconsidered in the analysisperformedboth actions, while57.1% did not do any.Among thecompanies thatexplicitlyidentifiedand isolatedQWRC in management reports, 56.4% also carried outthe analysisof the actual performanceon these costs, while among thosewho performed thistype of analysis, 51, 2% also engaged inthe explicit identificationandisolationof QRC in management reports.
Next, we sought to investigate possiblerelationshipsbetween thecontrol of investments in qualityandpreparation ofbudget plansfor QRC. Specifically, we analyzed whether the fact thatcompaniesseparately controlled(or not) investmentsin qualityissomehow related(ornot) with thepreparation ofbudget plans for QRC. The intersection of thevariablesdetermined that65.8% of the companies that controlledseparately theinvestmentin qualityalsopreparedbudget plans for QRC, and that84.5% of companies did not controlseparately theinvestment inquality andalso did not preparebudget plans,in this case62.8% of 148 companiesin the analysis.
Considering theintersectionof the variables related to the preparation ofbudget plansfor QRC andtheactual performanceof this type of costs, 18.6% of companies in the analysis(145)appliedboth methodssimultaneously, while 58,6% did not applyany methodologies. Among thefirms that producebudget plans for QRC, 64.3% also carried outanalysisof the actual performanceof QRC, while within the group ofcompaniescarrying out analysisof the actual performanceof QRC, 60% also preparedbudget plans.
Anotherrelationship consideredwas the identificationof QRCby categoryand the preparation of the respective budget plans of QRC. The identificationof QRCby category consideredthe classificationintoprevention costs, appraisal, internal andexternal failure, as well as their aggregationincontrol costs(costs of quality)andcosts in control failures(costs of non quality). However,theanalysis considered only companiesthat carried outthe identification(or not) of thequalitycosts category, not distinguishing between them.The results showedthat 45.9% of firms identifyingQRCby categoryalso carried out preparation ofbudget plans. Otherwise, 81% of companies preparingplansfor QRC, also proceededto identify QRCby category. In linewith previous results, there are a large numberof companies thatdid not prepareQRC budget plans, amounting in this caseto 72% of companies considered in the analysis(150), of which, 63% did not identify QRC by category. Of relevancealsowas the percentage ofcompaniesthat identified QRCby category, although budget plans were not prepared(26.7% of total).
Finally, we proceeded to theintersectionof informationconcerning the analysisof the actual performanceof QRCand the use ofindicatorsof poor quality. From the dataobtained was
inferredthe existence ofroutinesin the useof indicatorsof poor qualityby the companiessurveyed(64.8% of total), althoughonly 39.4% of thesecarry out analysis ofreal
performance of QRC.However, avery large percentage(84.1%) of
companiesconductinganalysisof the actual performanceof WQRC, also used indicatorsof poor quality, which leaves openthe possibility ofimportant complementarities betweenboth approaches.However, in onlya quarter ofthe companies´ overall,the analysisof the actual performanceof QRC in additionto the useof indicatorsof poor quality was identified, while in about 30% of companies neither methodologies were identified.About 40% of companies usedindicatorsof poor quality, although did not performanalysisof the actual performanceof QRC.
Assuming an = 0.05, an analysis of the relationship of independence / dependence between variables, was performed using the chi-square Pearson, considering the following assumptions:
H0: The variables are independent, ie, there is no relationship between variables. H1: The variables are not independent, ie, there is a relationship between variables.
Table II summarizesthe results ofthe chi-square, as well as decisionstaken in accordancewith them.
Accordingto the Pearson test of chi-square, the hypothesisof independence wasrejected.This analysis was, however, complemented withaset ofmeasuresof association (PHI coefficient, contingencycoefficient,CPearsoncoefficientandCramer's V), which, in general, indicated the existenceof associationbetween the pairs ofthe consideredvariables, withrelatively high valuesof statistical significance.
Table II – Summary of the relationship of independence / dependence between variables, (Chi-Square Test; =0,05)
Relationshipofindependence/dependence Result Decision
Identification of quality costs in management reportsvspreparation of specific reports of quality costs
2
(1)=35,958
Sig. = 0,000 Reject H0 Preparation of budget plans of quality costsvs preparation of specific reports of
quality costs
2
(1)=20,018
Sig. = 0,000 Reject H0 Preparation of budget plans of quality costsvs Identification of quality costs in
management reports
2
(1)=10,674
Sig. = 0,001 Reject H0 Preparation of specific reports of quality costs vs Analysis of actual
performance of quality costs
2
(1)=33,553
Sig. = 0,000 Reject H0 Identification of quality costs in management reports vsAnalysis of actual
performance of quality costs
2
(1)=16,773
Sig. = 0,000 Reject H0 Separate control of quality investmentsvs Preparation of budget plans for quality
costs
2
(1)=35,206
Sig. = 0,000 Reject H0 Separate control of quality investments vsAnalysis of actual performance of
quality costs
2
(1)=6,877
Sig. = 0,009 Reject H0 Preparation of budget plans of quality costsvsAnalysis of actual performance of
quality costs
2
(1)=30,544
Sig. = 0,000 Reject H0 Analysis of quality cost by category vsPreparation of budget plans of quality
costs
2
(1)=23,332
Sig. = 0,000 Reject H0 Analysis of actual performance of quality costs vs Use of indicators for lack of
quality
2
(1)=10,280
Sig. = 0,001 Reject H0
Themajority ofPortuguese companieswith ISO certifiedsystems do notexplicitly andseparately identify QRC,in management reports. Thus, they areunable tomanageimprovement, which confirmsthe findings ofSouza andCollaziol(2006).
Also, it can be seenthat companiesfailing toidentify theirQRCin management reports, did not embracethe recommendationsofauthorssupporters ofmanagementof these type of costs, as Feigenbaum(1994) andJuranandGryna(1991), inorderto reporttheirQRC, showing the deviations from thetargets, as advocated by RoblesJr.(2003).
On the importance ofreportingof QRC, RoblesJr.(2003) statesthat theinformation related to these costsalone will notleadtoquality improvements.However, suchinformationshould be reviewedbytop management, so that, consequently, to determine actionsto improvequalityin the wake ofFeigenbaum(1994) andJuran andGryna(1991). In thisparticular aspect, the results showedagreater adherenceof therespondent companiestobest practiceswhen comparedwith the host toprevious items. Alsopositively, we highlight thefact thatasignificantpart of the companiessubmittheir reportsinnon-monetary information, more appropriate for measuringthe quality aspectsmore difficult to quantify, such ascomplaints, suggestions, accidents, among others (AECA, 2003).
As forbudgeting, most respondents did notbudgetthe QRC, breaking Juran(1979) andSakurai(1997)arguments about the usefulnessof the budgetfor managementof quality related costs,as a tool forplanning and control.
The analysis of theperformancein the QRC, here again, the majorityof the participating companiesdid not followthe recommendationsof authorssupporters ofmanaging this type of costs (egJuran andGryna, 1991; Feigenbaum, 1994;Sakurai, 1997;RoblesJr.,2003;Antonio andTeixeira, 2007; Pires, 2007; Lopes andCaprice, 2007)because they did notperform thisevaluation.It is emphasizedthat companiesmeasuring theperformancein QRCare limited, only toperform comparisonswith previous periods.
With regardtoparametersrepresentativenessof the QRC with regardto other variables,the most significant partof the companiesresponded that they did notuse them.In thecompanies that usedthese parameters, the measurementwascarried out, preferablyin relationto turnoverandtotal costs.This is alsoa sectionwhere companiesdid not followthe doctrineexpendedbyexpertsin quality management(egGrynaandJuran, 1991;RoblesJr., 2003;Feigenbaum, 1994). These authorsaffirm the need toknow therepresentativenessof QRC, according to management needs, and recommend the use ofat leastthreetypes ofinteractions betweenquality costsand othermanagement indicators, taking into considerationthe productsand type of production.It is emphasized thatasignificant part of thecompaniessaid they did notcompare the QRC with othervariables. When askedthe reasons for, they referredno advantageor they were unaware ofthe benefitsor did not respond, which showed lack of sensitivity tothe impactof QRCon business competitiveness.
Theinvestmentin qualitycontrolwas not done bymost companiesparticipatingin this study. In companiesthat makesuch control, the cost / benefit ratioto quantify thereturn on theseinvestmentsis the mostused, followed bythenet present valueandpaybackperiod. Here too, the theoretical developmentsof variousauthorswere not followed. ForPaladiniandCarvalho(2006), the improvement projectsshould result inprocess improvementand economic viability. Thequalityactivitiescost money, so the existenceof the organization forquality shouldbenefit thecompany, whatwe will never knowif there is
nocontrol. In this regard, Pires(2007)states that theeconomics of qualitywillbecome increasingly importantin the future.Of the companies thatdid not control theinvestments in quality,asignificant partof itdid not seeany advantageor did not knowthe benefitsor did not respond, which indicates a significantdetachmentof the viewsofexpertsin quality management.
Consideringthis information, and the similar conclusionsof Souza and Collaziol(2006), we can concludethat mostparticipating companieswere closer to theunderstanding
ofDeming(1990)thanother authorswho have studiedthis subject.According
toDeming,companies have noneed toquantify and controlthe QRC, which contradicts theadvocated, for example, by Juran andGryna(1991), Crosby(1994) andFeigenbaum(1994).
On thecontrary, accordingtothetheories referred byJuran and Gryna(1991) andFeigenbaum(1994), it is important that the Portuguese companies with certified systems, not yetquantifyingtheirquality related costs percategory,they will make it, so they cancheckthe importance, distribution and temporal evolution of thedifferent sources ofcosts(SellésandCarbonell, 2002). Throughdetailed analysisof QRC, companies can obtain a set ofinformationthat allow them toundertake andintensify actionsto improvetheiroverall productivity, as indicated in theNP4239:1994(IPQ, 1994). And, therefore, adoptformal systemsof planning and controlof QRC in order toevaluate the performanceof management,as emphasized bySakurai(1997).
When companiesdid not preparebudget plans forthe QRC, they did notanalyze the respective performance, because there were nogoals to achieve.As stated byJordanat al. (2002), from themedium-term policies, the budgetingphasebeginsby settingshort term goals. According to these authors, the budget is amanagement toolto support theadministration,in the process ofachievingthe objectives of the company, ieatool fordecision and action.
Typically, the Portuguesecompanies with certified systems did not userelationships between quality costswith other indicators. The fewwho use suchrelationshipswere limited toquantify theQRCin relationto turnoverand in relation tototal costs.Inparticular,note thatthe companies
were notsupportersof the practicesrecommended byGrynaandJuran(1991)
andFeigenbaum(1994). The latter, that isstrongly oriented towardsthe financial aspectsof QRC(Antonio and Teixeira, 2007), emphasizes that, even withoutaperfectbase for comparison, each firm mustchoose themost appropriate to theirspecificities. In choosing thebasis of comparisonofthe QRCwith othercompany data, it should considerthe option, among other factors, the sensitivityto variations inproduction,the possible changescausedby mechanizationand resulting lowerlabor costs,the consistencyin the face offluctuationsin sales
andsensitivityto changes inpricesof raw materials(Feigenbaum, 1994,
apudSellésandCarbonell, 2002).
The low levelof control overthe investmentsonqualitylimits the analysisof theachieved
improvements, even thoughsimpletechniquessuch astrend analysisof the
variouscomponentsof costs(historical cost evolution in the company), comparison betweenbudgeted amountsand carried out,andcost-benefit analysis(AECA, 2003;RoblesJr., 2003, Carvalhoetal. 2006). This circumstance also goesagainst theconclusionsofSouza and Collaziol(2006).
Finally,it is stated thatthe majorityofPortuguese companies withcertified systemsdid not identifyexplicitly andseparatelythe QRCin management reports, being unable tomeasure the
qualityof their costsand respondmore efficientlyto variousobjectives, such as:to identifythe company's lossesrelated tothe costs ofpoor quality, facilitate thebudgetingof QRCand increase productivitythroughquality,among other benefits(Robles Jr., 2003).
Through thissurveywe sought toidentify the proceduresadopted in theplanning and controlof QRCin thePortuguese companies withcertified systems, as well as verify ifthese organizationspreparemanagement reportsto measure thefinancial returnfrom investment inquality.However, this is just atest,and neither the organizational culture, noranyresistance to thistransformationcan berevealedfullythrough asimple questionnaire.Moreover,the method of investigationby questionnairedoes not allowadditionalquestionsto confirm theanswers andto mitigatepossiblemisinterpretationof the questionsby respondents(Fowler, 1993;Marsh, 1982). In this sense, one cannot expectfrom this studytheidentification of anyproblems /benefits ofthe introduction ofa culture ofquality based oncosts,since inmost cases, this can only be made afterthe implementation oftheseprocedures and, for some of them, only afterasignificant period ofelapsedtime.
It is alsoimportant to notethat these resultscannot, when they demonstrate behavior that is contrarytothatadvocated bydifferentauthorshave studiedthe subject, be interpretedas a lack ofquality.The theories ofDeming, Crosby, Feigenbaumand Juranare the basis forquality improvementin an institution, whatever the level ofinitial quality, so that any divergencein relation tothese authors, can onlybe regarded asagreater difficulty inachievingthis improvement.
However, it wasuseful andinteresting to identifyaspects ofnormal functioning ofacompanyregarding the implementationof formal systems ofplanning and controlof QRCand theexplicit identificationandisolationof thecosts of qualityin management reports. On the one hand, this exercisenot only allowedfor agreater awarenessof howthese aspectssometimesoverlookedor ignored, hinderingthe improvement ofquality, butalso contributed toabetter understandingof the theories ofsome authors, related to the theme(egASQC, 1986; Deming,1990;Juran andGryna, 1991;Crosby, 1994;Feigenbaum, 1994;RoblesJr., 1996; Shank andGovindarajan, 1997;Silva, 1999; WernkeandBornia, 2000; Ganhão, 2001; Neves, 2004;Cameleño, 2006; Villarand Lopez, 2007; Calderonand New, 2009).
References
AECA, (2003),Gestión Estratégica de Costes, Documento 23, AECA, Madrid.
ANTÓNIO, N. S. and TEIXEIRA, A., (2007),Gestão da Qualidade – de Deming ao modelo
de excelência da EFQM, Edições Sílabo, Lisboa.
ASQC, (1986), “Principles of Quality Cost”.American Society for Quality Control, Milwaukee, pp. 18-20.
BANK, J. C., (1998),The Essence of Total Quality Management, EdiçõesCetop, Men Martins.
CALDERÓN, E. P. and NOVAS, J. L. C., (2009),“Costes de calidad y de no calidad: delimitación de conceptos y reflexiones en cuanto al papel de la contabilidad de gestión”. IN SARAIVA, M. and TEIXEIRA, A. (Ed.) TMQ - Qualidade: Gestão da Qualidade numa
perspectiva multi e interdisciplinar, Vol. 0, Edições Sílabo, Lisboa, pp.147-166.
CAMALEÑO, M. C., (2006), “Los costes de calidad y de no calidad”.Compras y Existencias, 145, Julio-Agosto, pp.14-24.
CARVALHO, M. M. andPALADINI, E. P. (coord.), (2006), Gestão da qualidade: teoria e
casos, Elsevier Editora, Rio de Janeiro.
CROSBY, P. B., (1979),Quality is free: the art of making quality certain, McGraw-Hill, New York.
CROSBY, P. B., (1994),Qualidade é investimento, 6ª ed., José Olimpo, Rio de Janeiro. DEMING, W. E., (1990),Qualidade: A Revolução da Administração, Ed. Marques Saraiva, Rio de Janeiro.
FEIGENBAUM, A. V. (1994) Controlo da Qualidade Total,MakronBooks, São Paulo. FOWLER, F. J., (1993), Survey Research Methods, Thousand Oaks, Sage Publicacions, CA. GANHÃO, F., (2001),Custos da Qualidade, IPQ, Caparica.
IAPMEI - Instituto de Apoio às Pequenas e Médias Empresas e à Inovação, (2008),Sobre as
PME em Portugal, IAPMEI, Lisboa.
IPQ – Instituto Português da Qualidade, (1994),NP 4239:1994 - Bases para a quantificação
dos custos da qualidade, IPQ, Lisboa.
JORDAN, H.; NEVES, J. and RODRIGUES, J., (2002), O Controlo de Gestão ao Serviço da
Estratégia e dos Gestores, Áreas Editora, Lisboa.
JURAN, J. M. (ed.), (1979), Juran´sQualityControlHandbook, 3ªedição, McGraw-Hill, Nova Iorque.
JURAN, J. M. and GRYNA, F. M., (1991),Controlo da qualidade - Handbook –Conceitos,
políticas e filosofia da qualidade, McGraw-Hill, São Paulo.
LAKATOS, E. and MARCONI, M. A., (1991),Fundamentos de metodologia científica, Atlas, São Paulo.
LOPES, A. and CAPRICHO, L., (2007),Manual de Gestão da Qualidade, Editora RH, Lisboa.
MARSH, C., (1982), The Survey Method: The contribution of surveys to sociological
explanation, St Leonards, Allen &Unwin, NSW.
MOTA, A., NOVO, A., INFANTE, B., FERREIRA, P. and ANDRADE, R. (2008) Anuário
Certificação & Qualidade 2008, Publicações Directas, Porto.
NEVES, J. F., (2004), “Gestão dos Custos”. Revista TOC, n.º 48, Março.
OLIVEIRA, O. J. (org), (2006), Gestão da Qualidade: Tópicos Avançados, Pioneira ThomsonLearnig, São Paulo.
PEREIRA, A. and GANHÃO, F., (1992),A gestão da qualidade – Como implementá-la na
empresa, Editorial Presença, Lisboa.
PIRES, A. R., (2007), Qualidade - sistemas de gestão da qualidade, 3.ª Edição – 2ª Reimpessão, Edições Sílabo, Lisboa.
ROBLES Jr., A., (1996),Custos da qualidade: uma estratégia para a competição global. Atlas, São Paulo.
ROBLES Jr., A., (2003),Custos da Qualidade: aspectos económicos da gestão da qualidade
e da gestão ambiental, Atlas, São Paulo.
SELLÉS, M. E. S. and CARBONELL, J. F. G., (2002),“La implantación de sistemas de costestotales de la calidad: Una propuesta metodológica”. Partida Doble, n.º 133, Mayo, pp. 68-79.
SAKURAI, M., (1997),Gerenciamento integrado de custos, Atlas, São Paulo.
SHANK, J. K. and GOVINDARAJAN, V., (1997),A revolução dos custos, Ed. Campus, Rio de Janeiro.
SILVA, C., (1999),“Gestão Estratégica de Custos: O Custo Meta na Cadeia de Valor”.Revista
FAE, 2(2), pp.17-26.
SOUZA, M. A. and COLLAZIOL, E., (2006),“Planejamento e Controlo dos Custos da Qualidade: Uma investigação da prática empresarial”. Revista Contabilidade& Finanças -
TATIKONDA, L. U. and TATIKONDA, R. J., (1996),“Top tem reasonsyour TQM effortisfailing to improve profit”. ProductionandInventory Management Journal, 37, pp.5-9. VILLAR, S. and LÓPEZ, L., (2007), “Modelo PEF de costes de la calidad como herramienta de gestiónen empresas constructoras: una visión actual”. Revista Ingeniería de Construcción, Vol. 22, nº 1, Abril,pp. 43-56. Available in: http://www.scielo.cl/pdf/ric/v22n1/art05.pdf WERNKE, R. and BORNIA, A. C., (2000),“Considerações acerca dos conceitos e visões sobre os custos da qualidade”. Revista FAEBusiness, 3(2), Maio/Agosto, pp.77-88.