Inês Amorim do Vale Leitão
EVOLUÇÃO DOS SERVIÇOS DOS
ECOSSISTEMAS NUMA BACIA
HIDROGRÁFICA EM URBANIZAÇÃO
Relatório de Estágio Profissionalizante
apresentado como requisito parcial para
obtenção do grau de Mestre em Gestão
Ambiental
EVOLUTION OF ECOSYSTEM SERVICES
IN AN URBANIZING CATCHMENT
Instituto Politécnico de
Coimbra
Escola Superior Agrária
de Coimbra
IPC/ESAC
Inês Amorim do Vale Leitão
EVOLUÇÃO DOS SERVIÇOS DOS
ECOSSISTEMAS NUMA BACIA
HIDROGRÁFICA EM URBANIZAÇÃO
EVOLUTION OF ECOSYSTEM SERVICES
IN AN URBANIZING CATCHMENT
ii
Agradecimentos
Este trabalho vem expressar-se como resultado de um empenho não só individual, mas de um esforço conjunto.
Venho deste modo agradecer ao meu orientador, Dr. António Dinis Ferreira, pela sábia orientação, pelas visões partilhadas, e ainda pelo acolhimento, confiança e todos os desafios profissionais proporcionados.
Agradecer à minha coorientadora, Dra. Carla Ferreira, pela ajuda e disponibilidade demonstrada ao longo deste trabalho, pelas sugestões apresentadas bem como pela disponibilização de todos os meios necessários à pesquisa científica que tornaram possível a execução deste trabalho.
Agradecer à minha família pelo apoio incondicional, pelo incentivo e pela transmissão de confiança no melhor de mim.
Agradecer à equipa CERNAS pela receção, pela ajuda e pelos conselhos.
Agradecer ao projeto UrbanGaia (BiodivERsA3-2015-143 (URBANGAIA)), no qual participo, que serviu de base à elaboração deste trabalho.
iii
Resumo
A sociedade depende dos serviços que os ecossistemas fornecem, cujo valor é baseado nos efeitos que cada serviço tem no nível de bem-estar da sociedade. Devido às mudanças e substituições dos sistemas naturais, a urbanização tende a diminuir a capacidade de fornecer serviços do ecossistema. Em busca de uma sociedade mais eficiente, resiliente e sustentável, esta dissertação pretende estudar os serviços ambientais prestados pelos ecossistemas de acordo com a evolução do uso do solo entre 1958-2012, e com um maior nível de detalhe nos dias de hoje, numa bacia hidrográfica periurbana mediterrânea: Ribeira dos Covões. Este estudo foi feito através da quantificação dos serviços do ecossistema utilizando uma matriz, e do seu mapeamento usando SIG (Sistemas de Informação Geográfica) para análise e tratamento de dados. Com esta dissertação, concluiu-se que as variações no uso do solo são um processo relevante na mudança do fornecimento de serviços do ecossistema, e podem influenciar este fornecimento de forma negativa. O potencial fornecimento de serviços dos ecossistemas na área de estudo tem vindo a decrescer, mas não muito. Sendo uma área ainda não completamente urbanizada, este trabalho ajuda a pensar qual a melhor forma de desenvolver e organizar a área de estudo de uma forma sustentável, de modo a preservar os ecossistemas e os serviços por eles prestados.
Palavras-chave: Serviços dos Ecossistemas. Bem-estar. Evolução. Quantificação.
iv
Abstract
Society depends on the services that ecosystems provide to it, whose value is based on the effects that each service has on the level of society well-being. Due to the changes and substitutions of natural systems, urbanization tends to decrease the capacity to provide Ecosystem Services. In pursuit of a more efficient, resilient and sustainable society, this dissertation intends to study the environmental services provided by ecosystems in accordance with the evolution of land use between 1958-2012, with a greater level of detail nowadays, in a Mediterranean peri-urban catchment: Ribeira dos Covões Catchment. This study was made through the quantification of Ecosystem Services using a matrix, and its mapping using GIS (Geographic Information Systems) for data analysis and treatment.With this dissertation, it was concluded that variations in land use are a relevant process in the change of Ecosystem Services supply, and they can influence this supply negatively. The potential supply of Ecosystem Services in the study area has been declining, but not much. Being an area not completely urbanized, this work helps to think about which the best way to develop and manage the study area, in a sustainable way, in order to preserve the ecosystems and the services they provide.
Keywords: Ecosystem Services. Well-being. Evolution. Quantification. Mapping. Land
v
Table of contents
1 Introduction 1
2 Literature review 3
2.1 Concepts 3
2.2 Classification of Ecosystem Services 5
2.3. Ecosystem Services quantification and mapping 6
3 Study site 8
3.1 Geographic placement 8
3.2 Characterization 9
3.3 Land use evolution 10
4 Methodology 11
4.1 Spatio-temporal changes on potential Ecosystem Services 12
4.2 Improved methodology to quantify potential ES in 2012 14
4.3 Current Flood Regulation service 16
5 Results 18
5.1 Spatio-temporal changes in potential Ecosystem Services 18
5.2 Potential Ecosystem Services in 2012, based on improved methodology 21
5.3 Flood regulation service in 2012 24
6 Discussion 25
7 Conclusion 29
8 References 30
Annex 1 - Land Use Evolution between (1958 – 2012) in Ribeira dos Covões Catchment
vi Annex 2 - Ecosystem Services contemplated on MA (MA, 2005) and on (Burkhard et al., 2014)
Annex 3 - Ecosystem Services studied and its description Annex 4 – Questionnaire
vii
List of Figures
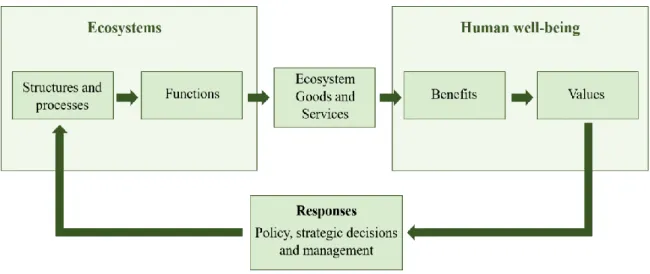
Fig. 1 - Conceptual linkage between ecosystems and human well-being and integrated evaluation of ecosystem functions, goods and services (adapted from de Groot et
al., 2002; Haines-Young and Potschin, 2010). 3
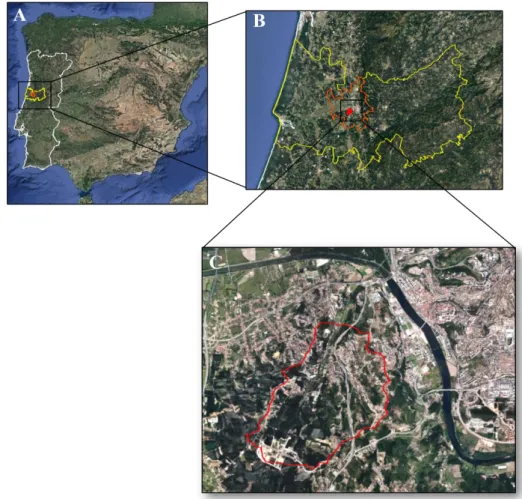
Fig. 2 - Location of the study site. A: Ribeira dos Covões catchment in Iberian Peninsula. B Ribeira dos Covões catchment in Coimbra district and county. C: Ribeira dos Covões catchment in Coimbra city (adapted from Google Earth, 2012).
8
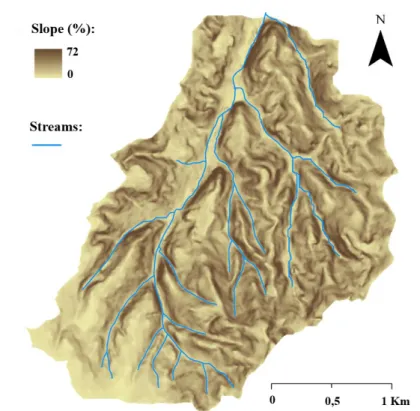
Fig. 3 - Slope representation of Ribeira dos Covões Catchment. 9
Fig. 4 – Lithologic representation of Ribeira dos Covões Catchment. 10
Fig. 5 – Framework for methodology used at current research. 12
Fig. 6 - Land Use with more detailed classes of Ribeira dos Covões catchment in 2012
(adapted from Ferreira, 2015; Ferreira et al., 2016a). 15
Fig. 7 – Mapping of ES potential evolution, between 1958-2012, using (Burkhard et al.,
2014) matrix. 19
Fig. 8 - Mapping of ES potential of Ribeira dos Covões catchment in 2012, based on
expert matrix. 23
viii
List of Tables
Table 1 - Description of ES classes (adapted from MA, 2005). 6
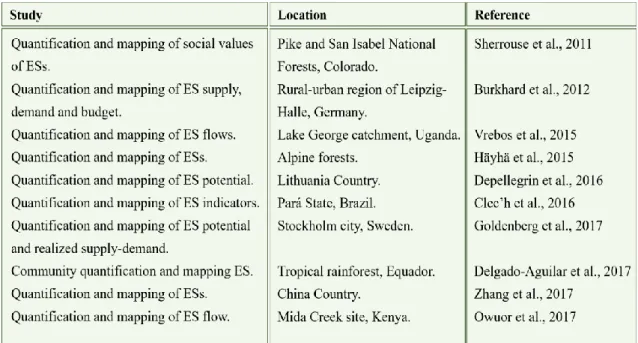
Table 2 – International studies focusing on ES quantification and mapping. 7
Table 3 - Exemplary ecosystem service potential matrix. Scale from 0 = no relevant potential; 1 = low relevant potential; 2 = relevant potential; 3 = medium relevant potential; 4 = high relevant potential; and 5 = very high (maximum) relevant
potential (adapted from Burkhard et al., 2014). 13
Table 4 - Supplementary matrix to quantify the potential supply of the service of flood regulation, depending on water lines land use, topographic slope and local soil type, respectively. Scale from 0 = no relevant potential; 1 = low relevant potential; 2 =
high relevant potential. 17
Table 5 - Ecosystem service potential matrix developed through a questionnaire made by experts. Scale from -2 = highly affected potential; -1 = lowly affected potential; 0 = no relevant potential; 1 = low relevant potential; 2 = high relevant potential. 22
ix
List of Graphics
Graphic 1 – Percentual land uses changes (adapted from Kalantari et al., 2017). 11
Graphic 2 – Percentage of contribution of each land use to the regulation services supply (A), provision services supply (B), cultural services supply (C) and total ES supply (D), between 1958-2012, using (Burkhard et al., 2014) matrix. 21
Graphic 3 - Percentage of contribution of each land use to the ES supply, in most recent
x
List of Acronyms
ATEM – Advanced Terrestrial Ecosystem Analysis and Modelling project
CICES – Common International Classification of Ecosystem Services DGT – Direção Geral do Território (General-Direction of Territory) ES – Ecosystem Service
INE – Instututo Nacional de Estatística (National Institute of Statistics) MA – Millennium Ecosystem Assessment
SIG – Geographic Information Systems
1
1 Introduction
Ecosystem are defined as a set of abiotic factors and biotic communities that inhabit and interact with other species in a certain region (Odum and Barret, 2010). Ecosystems are essential not only to human life and welfare, due to the several services provided, but also to sustain biodiversity, its evolution and self-sustaining, in distinct scenarios of global changes (Maes et al., 2013; Ferreira et al, 2013). Humans are part of the ecosystems (MA, 2005), thus interact and explore the environment to survive, leading to changes in the ecossystems which affect their own welbeing (Müller, 2005).
Ecosystem services (ESs) are commonly defined as the benefits, (e.g. goods and services), derived from natural and managed ecosystems (MA, 2005). This concept has become fundamental to understand how humans interact with the natural environment (Thorsen et al. 2014). The concept has been used as a tool in the fields of biodiversity conservation, natural resource management, development policies, environmental accounting and business in several international initiatives (Cowling et al., 2008; ATEAM 2004, MA 2005, TEEB 2010, CICES 2013).
In the last 50 years humans modified ecosystems more rapidly and extensively than in any other period of human history, there has been an accelerated loss of biodiversity and ESs, which may eventually pose a significant risk to human activity (MA, 2005). In this context, it is essential to study ESs so that concrete problems and possible solutions can be specified. Likewise, following the Millennium Ecosystem Assessment (MA), several countries established national ecosystem assessments based on the ESs concept. The MA for Portugal shows a progressive decrease of natural ecosystems, with consequences for biodiversity decline, increased pollution (water, soil and air) and for ESs provision in general. It has been identified a set of key drivers of ecosystem changes, whether natural or human-induced, affecting the provision of its services. One of them is the change in land use, linked to afforestation and agriculture intensification, (generally associated with extensive monoculture), field abandonment and urbanization (Pereira et al., 2009). Land use changes driven by human activities influence the dynamic of ESs, and should be quantified to understand how much service changed through human activities on spatial and temporal scales (Tolessa et al., 2017). Unfortunately, there is a clear lack of relevant information regarding to ESs provisioning for local decision making (Turner and Daily, 2008). Therefore, explicit quantification and mapping of ESs should be performed to support environmental management and decision making processes as a powerful tool
2
to support landscape sustainability assessments (Daily and Matson, 2008; Swetnam et al., 2010; Maes et al., 2013). Generally, ESs are economically, environmentally and/or socially quantified, based on land uses (de Groot et al, 2002).
This work uses ESs assessment at a local scale, the Ribeira dos Covões catchment, located in the periphery of Coimbra city, central Portugal (Fig. 2). This is a peri-urban catchment, overlaying a rural-urban interface and subject to rapid land use changes (Tavares et al., 2012). The study aims to investigate the consequences of land use changes since 1958 on ESs, assessing their temporal variations. The quantification of temporal changes on ESs in Ribeira dos Covões was performed based on current methodology (Burkhard et al., 2012). This methodology is usually applied at larger scales (e.g. national and/or regional) (Burkhard et al., 2012; Depellegrin et al., 2016). Thus, given the relatively small area of the study site, this work also intends to improve the current methodology for municipal/local scales, based on experts perception. The proposed methodology focus on all ESs, but also in the study of a concrete ecosystem service: Flood Regulation. This ecosystem service stands out in the study area, considering past flood episodes, even when the urban area was considerably less extensive than nowadays (Ferreira et al., 2015). Several studies have been performed in Ribeira dos Covões catchment to assess land use changes (Pato et al., 2011) and to understand hydrological processes at different scales ( Ferreira et al., 2015; Ferreira et al., 2016a; Ferreira et al., 2016b; Kalantari et al., 2017). These studies highlight the increasing risk of flooding over the last years and this trend is expected to continue with future urbanization (Kalantari et al., 2017). Understanding how the ESs can mitigate natural hazards (e.g. floods) and to promote human health and sustainability is also an objective of this work.
This work follows the structure of a scientific article, in which the information is synthesized, in order to improve the current manuscript and submit it for publication in a international scientific journal. Since this manuscript corresponds to a master internship report, it is extensiver than the typical scientific articles. Current manuscript comprises a literature review of several ESs concepts and approaches, a description of the study area, including land use changes over the last 50 years. Then the methodology used is presented, with particular enphasis on the ESs maps, performed in through the Geographic Information System tool (GIS), based on matrices that quantify distinct ESs for different land uses. Methodology comprises three stages: (1) use of current published matrices to quantify ESs evolution; (2) development of a new matrix, developed by local experts, familiar with the study area; and (3) use couplethe new matrix with other phisical
3
properties to better asses the "Flood Regulation" ES. Then the results are shown and discussed. Finally, the conclusions of this research are provided.
2 Literature review
2.1 Concepts
The concept of ESs continues to evolve and there are several definitions in the literature. ESs are the direct and indirect contributions of ecosystems to human wellbeing (Fisher and Turner 2008; TEEB, 2010; Muller and Burkhard, 2012), namelly linked to maintenance, and benefits to the environment. Often ESs contribute to the conservation and maintenance of the environment, and they only reach the human indirectly (de Groot et al., 2002). ESs involve many interconnected concepts: ecosystem structure and processes, functions, goods and services, benefits, values (Fig. 1).
Fig. 1 - Conceptual linkage between ecosystems and human well-being and integrated evaluation of ecosystem functions, goods and services (adapted from de Groot et al., 2002; Haines-Young and Potschin, 2010).
Structures and processes are the most complex ecosystem properties, as biophysical interactions between ecosystem componentes that create the basis for functioning of the ecosystem and to the production of its final services (Boyd and Banzhaf, 2007; Muller and Burkhard, 2012; Mononen et al., 2016).
4
The first step towards a comprehensive assessment of ecosystem goods and services involves the translation of this ecological complexity into a more limited subset of ecosystem functions, such as regulation, support, provisioning and cultural (see section 2.2), which are the capacity of the ecosystem to provide services (Haines-Young and Potschin, 2010). Although it is difficult to distinguish the concepts of ecosystem goods and services, some authors rather separate them as tangible and intangible contributions from ecosystems, respectively (Daily et al., 1997).
It is the presence of humans as valuing agents that enables the translation of basic ecological structures and processes into value-laden entities, through benefits that they obtain from ecosystem (de Groot et al, 2002). This benefits are the change in human well being (Bateman et al, 2011), whose constituents are the security, basic material for good life, health and good social relations (Haines-Young and Potschin, 2010). They can be valued not strictly on economic terms, but also ecological sustainability and/or socio-cultural (de Groot et al, 2002),. Thus, this valuation combines information on the social and biophysical system component in order to understand how society attributes value to ESs (Cowling et al. 2008). It could serve as a launching point for future collaboration and research strategies in the field of ESs valuation and it would be an important tool for more integrated cost-benefit analysis and greatly enhance more balanced decision-making regarding the sustainable use and conservation of natural ecosystems and their many goods and services (de Groot et al., 2002). These strategic decisions and management will bring consequences for ecosystem structures and processes, whether good or bad.
ESs valuation and quantification can be performed from several points of view: ESs demand or supply, as well as actual or potential flow. Supply of ESs refers to the capacity of a particular area to provide a specific bundle of ecosystem goods and services within a given time period (Burkhard et al. 2012). This capacity may refers to the generation of the actually used set of natural resources and services (actual flow), or to the potential supply of ESs in a certain ecosystem (potential flow), which would be the hypothetical maximum yield of selected optimized services (Burkhard et al. 2012). So, ecosystems provide a certain potential to supply services based on their functioning, however the demand for these potential services from society converts them into real ESs, taking into account their use by humans (Schröter et al. 2012). Demand for ESs is the sum of all ecosystem goods and services currently consumed or used in a particular area over a given time period, not considering where ESs actually are provided (Burkhard et al. 2012).
5
2.2 Classification of Ecosystem Services
Categorising and describing ESs is the basis of any attempt to measure, map or value them (Burkhard et al, 2017), but it represents a technical challenging task, since there is no single definition of the term that is totally accurate and accepted, capable of containing all the variety of existing ESs (de Groot et al. 2010). ESs classification is made according to the ecosystem functions that a set of ESs perform, being assigned the name of a certain function.
Many different ecosystem service classification systems have been developed during the last decades and are under discussion for application in decision-making processes (Villamagna et al. 2013). Some authors assume three groups of ESs, classified as regulation, provisioning, and cultural services (Burkhard et al., 2014; Tamni et al., 2016; Depellegrin et al., 2016).MA (2005) added a fourth classe called “supporting services” to the previous three ESs (Table 1). In the TEEB classification (2010) the idea of “supporting services” was not further developed, but instead a new “habitat services” group was introduced. Similar to the TEEB classification, CICES (2013) does not include the MA (2005) “supporting services”, but merges the TEEB (2010) “habitat services” with regulating services, in a category called “regulating and maintenance services”. The MA (2005), TEEB (2010) and CICES (2013) are the most commonly used classifications (e.g. Burkhard et al., 2012; Crossman et al., 2013; Brown and Fagerholm, 2015).
In this work is used the MA classification (2005), considering the importance of “supporting services” for the conservation of the environment and for the existence of other ESs, rather than just for human well-being. Table 1 shows the ESs classes used in this work, describes the ESs included in each one and presents some examples.
6
Table 1 - Description of ES classes (adapted from MA, 2005).
2.3. Ecosystem Services quantification and mapping
The studies that address ESs have recorded a very significant increase since 2005, with the publication of MA (2005). The increasing interest in ESs has motivated researchers and stakeholders to explain them through quantification and mapping, in order to use it in land use planning (Maes, 2013; Crossman et al., 2012). The ESs quantification is usually made by assigning a value to each ES, according to its supply at a certain site or land use. This information can be transposed to a map, which shows the quantification of ESs in space (Burkhard et al., 2012).
In Portugal, few studies have focused on the valuation of ESs, asthe integration of the marine ecosystems conservation and the ESs economic evaluation in governance (Ferreira et al., 2017b), as well as their inclusion in spatial planning, as the integration of participatory selection of ESs for spatial planning (Mascarenhas et al., 2016) and the influence of structural and socioeconomic variables on the ESs proficiency in the urban fabric (Graça et al., 2017). Other studies map specific ESs, such as carbon stock in the
7
Portuguese montado agro-forest (Rosário et al., 2015), and biomass production by annual plants in evergreen woodlands (Pinho et al., 2015).
Some examples of internacional studies focusing on ESs quantification and mapping are given in Table 2.
Table 2 – International studies focusing on ES quantification and mapping.
ESs quantification emerges as a way of valuing them, in which is given a value relative to the potential supply, real supply, or demand for these services (Burkhard and Maes, 2017). It is thus possible to better understand the benefit the human can obtain from ecosystems, since it may be converted into monetary values, cultural perceptions values or ecological sustainability values (de Groot et al., 2002).
In this quantification process, it is crucial the process of ESs mapping, since it allows visualizing the distribution of ESs in a particular area. In order to be able to map ESs, it is fundamental to develop robust indicators, such as land use, that allow the modeling of ESs (Egoh et al., 2012). Mapping tools can help land managers and conservationists visualize spatial and temporal patterns and changes in ESs, and estimate the potential impact of future scenarios regarding, for exemple, to land use and/or climate changes on the provision of these services. Thus, ESs maps can help to uncover risks for ecosystem health, unsustainable use of ESs, harmful impacts on a landscape, as well as impaired spatial flows of ESs (Maes et al., 2013; Burkhard et al., 2016).
8
3 Study site
3.1 Geographic placement
The study was performed in a small catchment (6,2 km2) located in the pheripheri of Coimbra city, in central region of Portugal,. It is situated on the left-hand bank of the Mondego river, on the opposite side of the city centre (Fig. 2).
In 2011, the population reached 26,700 inhabitants (INE, 2012), with contrasting urban cores, associated with a population density ranging from < 25 to > 9900 inhabitants/km2 (Pato et al., 2016).
Fig. 2 - Location of the study site. A: Ribeira dos Covões catchment in Iberian Peninsula. B Ribeira dos Covões catchment in Coimbra district and county. C: Ribeira dos Covões catchment in Coimbra city (adapted from Google Earth, 2012).
The case study area is a small catchment located in the central region of Portugal, in the district and municipality of Coimbra (Ferreira et al., 2013). It is situated on the left-hand
9
bank of the Mondego river, on the opposite side of the city main centre, with about 6,2 km2 (Fig. 2). It has approximately 26,700 inhabitants, according to a proportion made
through 2011 Census (INE, 2011), with a contrasting local population density ranging from < 25 to > 9900 inhabitants/km2 (Pato et al., 2016).
3.2 Characterization
Ribeira dos Covões catchment has a moist Mediterranean climate (Tavares et al., 2012). It is a catchment with S-N orientation. The area comprises a sharply widening valley with altimetry ranging from 32 m to 207 m, with avarage slopes ranging from 10% to 30% (Tavares et al., 2012), but reaching 72% (Fig. 3). The catchment drains northwards into the large floodplain of the Mondego River. The main watercourse has a perennial flow, supplied by several springs, and several ephemeral and intermitente tributaries (Ferreira et al., 2015).
The lithology of the catchment comprises sandstone in the west part, including Cretaceous and tertiary sandstones, gravel conglomerates and mudstones; limestone in the east, including Jurassic dolomitic and marly limestone; and some alluvial deposits in the main valleys (Fig. 4; Ferreira et al., 2016a).
10
Fig. 4 – Lithologic representation of Ribeira dos Covões Catchment.
3.3 Land use evolution
In the last half century the catchment underwent profound changes in the land use and occupation, associated mainly to the urbanization and conversion of native forest into pine and eucalypt woodlands, used for timber production (Ferreira et al., 2016b). Over this period, the catchment went through three main land-use periods: Predominantly rural until 1972, discontinuous urbanization in 1973-1993, and urban consolidation after 1993 (Tavares et al., 2012). Graphic 1 shows the percentage changes in land use, namely in the urban area, agricultural area, woodland and semi-natural areas and open spaces with little or no vegetation.
Initially it was a rural natural area, mostly agricultural consisting of some olive plantations, cattle pasture areas and small family farms with vegetables (Ferreira et al., 2016b), being in practice divided into anual and permanent crops, temporary irrigated crops, and pastures, these latter practically nonexistent. At this time, few dispersed urban areas or buildings were presente along the main roads (Tavares et al., 2012).
11
Graphic 1 – Percentual land uses changes (adapted from Kalantari et al., 2017).
Between 1958 and 1979 the agricultural area suffered a decrease, due to conversion into forest. Between 1979 and 1990 the forest changed its nature from cork oaks and mixed forests to large commercial plantations of pine and eucalyptus trees (Tavares et al., 2012), which are still the main woodlands. The forest area suffered a big wildfire in 1995, which affected 15% of the catchment area,. Due to its proximity to Coimbra city centre, urban areas in Ribeira dos Covões increased substantially over the years. Between 1958 and 2012, the urban area increased from 6% to 40%, due to na accentuated decrease in agricultural land from 40% to 4%, andleading to forest fragmentation (Ferreira et al., 2016b), which area ranged from 44% to 55% (Graphic 1). After 2012, with the economic crisis, land use stabilized (Ferreira et al., 2016a), but recent urban areas combine higher population density, due to the more recent apartment blocks (Ferreira et al., 2015). Currently, the forest area consists mainly of eucalyptus (15%) and oak (1%), with some mixed eucalyptus and pine stakes (29%) (Ferreira et al., 2016b).
Annex 1 provides detailed information on spatial and temporal land use changes in Ribeira dos Covões catchment, between 1958 and 2012.
4 Methodology
The present study performs the quantification of ESs in Ribeira dos Covões catchment, based on matrix values for individual land uses, and maps its spatioal variation. The study was developed in three stages: (1) quantification of ESs changes for the period 1958 –
12
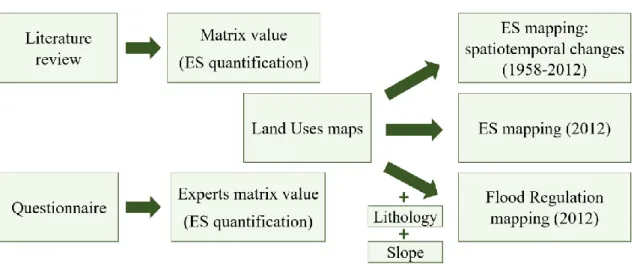
2012, based on currently adopted methodology (referência?); (2) quantification of the ESs in 2012, based in a improved matrix, developed by local experts through questionnaires; and (3) quantification of the flood regulation service, based on a proposed methodology which includes local experts evaluation and physical catchment properties (Fig. 5). Detailed information on the selection of ESs and these stages are provided in the following sub-sections.
Fig. 5 – Framework for methodology used at current research.
4.1 Spatio-temporal changes on potential Ecosystem Services
Spatiotemporal changes in ESs in Ribeira dos Covões catchment for the period 1958-2012 was assessed following Burkhard et al. (2014) methodology. It is based on a matrix value which attribute a value to the distinct ESs potential for distinct land uses. The matrix comprises 11 services for the regulation services, 14 for provisioning and 6 to describe cultural services (Table 3; Annex 2). The matrix attibutes ESs values for all land cover types identified by Corine (CLC, 2007). Nevertheless, from Burkhard et al. (2014) matrix, this study did not include the ESs values for the land cover type “water courses”, since it is assumed a minor contribution to the ESs due to the small dimention of the stream network, and the ephemeral and intermittent regimes of the tributaries.
13
Table 3 - Exemplary ecosystem service potential matrix. Scale from 0 = no relevant potential; 1 = low relevant potential; 2 = relevant potential; 3 = medium relevant potential; 4 = high relevant potential; and 5 = very high (maximum) relevant potential (adapted from Burkhard et al., 2014)
Corine land cover type
R eg u la ti n g ES G lo b al c li m at e Lo ca l cl ima te A ir q u al it y W at er p u ri fi ca ti o n W at er fl o w r eg u la ti o n Er o si o n r eg u la ti o n P est a n d d is ea se c o n tr o l R eg u la ti o n o f w ast e N u tr ie n t cy cl e P o ll in at io n P ro v isi o n in g E S C ro p s W il d f o o d s an d r eso u rc es Li v est o ck ( d o mes ti c) F o d d er Ti m b er F re sh w at er B io mass f o r en er g y B io ch em ic al s & M ed ic in e C u lt u ra l E S R ec re at io n & to u ri sm La n d sc ap e ae st h et ic s & i n sp ir at io n K n o w le d g e sy st ems R el ig io u s & s p ir it u al e x p er ie n ce C u lt u ra l h er it ag e & d iv er si ty N at u ra l h er it ag e & d iv er si ty T OTA L E S PO T E N T IA L
Continuos Urban Fabric 3
0 0 0 0 0 2 1 0 0 0 0 0 0 0 0 0 0 0 0 10 3 2 2 2 1 0 13
Discontinuos Urban Fabric 3
0 0 0 0 0 1 1 0 0 1 1 1 0 0 0 0 0 0 0 9 2 1 2 2 2 0 13
Industrial or commercial units 3
0 0 0 0 0 2 1 0 0 0 0 0 0 0 0 0 0 0 0 2 0 0 0 0 2 0 5
Annual and permanent crops 13 1 2 1 0 1 2 2 2 1 1 12 4 1 1 4 0 0 2 0 5 1 1 1 0 2 0 30
Permanently irrigated land 12 1 3 1 0 1 0 2 2 1 1 12 5 1 0 2 0 0 1 3 7 1 1 2 0 3 0 31
Pastures 11 2 1 0 0 1 1 2 4 0 0 13 0 2 5 5 0 0 1 0 9 2 2 2 0 2 1 33 Broad-leaved forest 45 5 5 5 5 3 5 4 4 5 4 13 0 5 0 1 5 0 1 1 20 4 4 4 2 2 4 78 Coniferous forest 45 5 5 5 5 3 5 4 4 5 4 13 0 5 0 1 5 0 1 1 19 4 4 4 2 2 3 77 Mixed forest 57 5 5 5 5 3 5 5 5 5 4 13 0 5 0 1 5 0 1 1 20 4 4 4 2 2 4 77
Transitional woodland shrub 17 2 2 1 1 1 1 2 3 2 2 6 0 1 1 1 1 0 1 1 12 2 3 4 1 1 1 35
Sparsely vegetated areas 7
0 1 0 1 1 1 1 1 1 0 2 0 1 1 0 0 0 0 0 5 1 1 2 0 0 1 14 Burnt areas 2 0 1 0 0 0 0 0 1 0 0 0 0 0 0 0 0 0 0 0 3 0 0 3 0 0 0 5 E co sy st em S er v ic es
14
Burkhard et al. (2014) matrix ESs quantification was performed based on typical central European landscapes in summer. Matrix values range from 0, meaning no relevant supply, to 5 for maximum relevant supply. This scale allow the comparison between ESs values measured and assessed by various indicators and units. Once the values are assigned to each service of the different ecossystem functions, the sum is made to obtain a total value of ESs potential.
The spatiotemporal changes of ESs in Ribeira dos Covões was performed by applying the
Burkhard et al. (2014) matrix into eight land use maps availabe for the years 1958, 1973, 1979, 1990, 1995, 2002, 2007 and 2012 (Ferreira, 2015; Annex 1). This was performed in ArcGIS 10.3.1 software, using ArcMap "reclassify" tool.
The total ESs potential of Ribeira dos Covões for each one of the eight years, was estimated according with the following steps: (1) calculating the area occupied by each land use and turn it into percentage; (2) multiply the total potential ESs provided by each land use, by the percentage of occupation in the catchment; (3) sum up all the values obtained for each year. In this way, it is possible to compare the potential supply of ESs over the study period.
4.2 Improved methodology to quantify potential ES in 2012
Since Burkhard et al. (2014) matrix was developed based on central European countries, and given the absence of matrix values for Mediterranean regions, it was considered relevant to improve the methodoly by using a matrix better reflecting the catchment properties and local experts perception about the ESs. The improved quantification of potential ESs was performed only for current land uses, based on 2012 map.
The idea was to develop and use a new matrix, made by a group of experts familiar with the study site, which also contemplates relevant aspects not included in Burkhard et al. (2014) matrix. Thus, “soil formation” and “primary production” services were added to the supporting ESs, following MA (2005). ESs used in each of the methodologies are shown in Annex 2.Although, some changes were made, considering the risk of double counting of services and the characteristics of the study area. For example “fibre”, “aquaculture”, “fishing” and “mineral resources” are not considered because they don’t exist in the study area. “Water flow regulation” was split into “flood regulation” and “groundwater recharge”, used in (Burkhard et al., 2012), because the high significance of
15
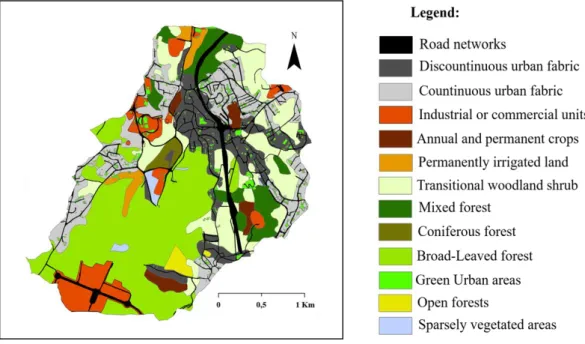
both to the region. “Abiotic energy sources” and “wood fuel” are included on “biomass for energy”, so they were eliminated, in addition to were considered to be less important / relevant to study area. “Natural hazard regulation”, “genetic resources” and “sence of place” are very general and could be included in many other services and have therefore also been eliminated. Thus, the ESs studied are shown and described on Annex 3. Furthermore, considering the small scale of the study site, to better represent the local situation, more detailed classes of land use types were included in the new matrix:road networks green urban areas, open forests (resulting from tree clear-cutting), annual crops (e.g. horticulture), and permanent crops (e.g. olive trees, orchads). The 2012 map with all these land use classes is provided in Fig. 6.
As regards to the scale used for this new matrix, the ESs values were assumed to range between -2 and 2, in order to translate the potential negative and positive impacts of each land use. The zero value indicated that no ES is provided by a specific land use.
Fig. 6 - Land Use with more detailed classes of Ribeira dos Covões catchment in 2012 (adapted from Ferreira, 2015; Ferreira et al., 2016a).
After establishing the desired properties/criteria for the new matrix, a questionnaire was prepared. It comprised 30 tables, each one regarding to an ES presented in Annex 3, in order to assess contributions from each land use to several ESs. Although the questionnaire was developed to assess potential ESs in Ribeira dos Covões catchment, the tables included a larger number of land use types than present in the study site, for
16
possible future assessments in Coimbra municipality. Thus, from the 30 land use classes included in the questionnaire, only 13 were present in the study site, in 2012. Furthermore, from the 30 ESs considered in the questionnaire, only 27 were applicable to the study site. Fishing and production of mineral resources services were excluded because they do not exist in the study area. The biodiversity service was also excluded, because it is not part of the set of ESs included at current research, as a matter of uniformity.
To the respondents, it was asked to fill in each table of the questionnaire according to the influence individual land uses have on a particular potential ES based on a qualitative evaluation. Tthe evaluation classes considered were strong adverse potential, week adverse potential, no relevant, low positive potential and strong positive potential. This classification was then converted into quantitative values (-2; -1; 0; 1; 2, respectively), to be used in the matrix. The table used in the questionnaire are shown in Annex 4. The questionnaires were filled in by local experts, with higher education in the environmental area or similar, who are familiar with the study area. A total of 33 questionnaires were filled, but only 31 were considered in this study, those that were more than 85% completed. After transforming the qualitative responses into quantitative values for all valid questionnaires, the final matrix was obtained by assuming the modal value of all the responses for each land use and ES (Shaw et al., 2010). In case of equal number of answers in two different classes (land use / ES), the two questionnaires not considered were used as a tie-breaker. The final matrix, comprises values ranging from -2 (strong adverse potential) to 2 (strong relevant potential), was used to map the spatial potential ESs for Ribeira dos Covões, in 2012, according with ArcGIS procedure similar to theone explained in section 4.1.
4.3 Current Flood Regulation service
Considering local flood hazard and the current research focus on hydrological processes in Ribeira dos Covões catchment, particular attention was attributed to the flood regulation service. Although it is possible to visualize in previous matrices (sections 4.1 and 4.2) the contribution of this service to the total ESs potential, the objective was to better assess this particular ES, based in additional physical catchment properties influencing the hydrological processes. For this study the flood regulation service provided by distinct land uses were derived from the matrix prepared from experts knowledge (section 4.2). Nevertheless, in this land use matrix, the “water courses” land
17
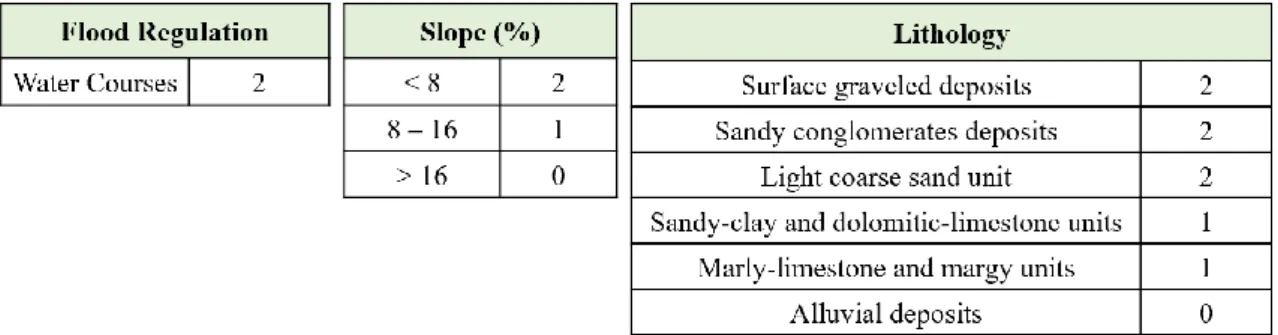
cover type was included (Table 4), given the relevance for the ES investigated. The value for the flood regulation service provided by water courses was derived from the questionnaires and considered for map preparation. Although the hydrolocial processes are strongly linked to several parameters, such as geology, slope, soil propertiesh, or weather conditions. This study only included slope and lithology for the quantification of flood regulation service. The lithology was included due to its influence on infiltration rates (Goldenberg et al., 2017), with direct influence on surface runoff processes. Slope was included it determines flow velocity and trajectories (Goldenberg et al., 2017). For example, a site with a higher slope does leads to quicker flows, providing less time for water to infiltrate, thus favouring quicker flow responses and enhanced flood hazard. Similar to the matrix developed for the land use, additional matrices were prepared for both slope and lithology (Table 4). These ES values were derived from Goldenberg et al. (2017), being adapted to the range of values used in the new quantification matrix (Table 5), and were traduced in maps, through the “reclassify” tool in ArcMap.
Table 4 - Supplementary matrix to quantify the potential supply of the service of flood regulation, depending on water lines land use, topographic slope and local soil type, respectively. Scale from 0 = no relevant potential; 1 = low relevant potential; 2 = high relevant potential.
The final potential flood regulation service was derived from the values included in the land use map, slope map and lithology map. Considering that each one of these properties have different importance for the hydrological processes and the flood regulation services, distinct weighting was assumed to integrate the information from the three maps. Furthermore, land use may change quickly over time, whereas slope and lithodology are relatively stable. Assuming the land use has a higly relevant variable influencing rainfall-runoff processes in small urban catchments, it was considered to contribute 60% to the final flood regulation service map. Slope and lithology were assumed to have a similar contribution of 20% to the final ES map. Thus, the final flood regulation service map was
18
prepared from the "weighted overlay" tool of ArcMap. The result will be a map with spatial information of sites with greater or lesser ability to flood regulation, and showing places where the supply is impaired, taking into account relevant biophysical properties of the catchment.
5 Results
5.1 Spatio-temporal changes in potential Ecosystem Services
The application of Burkhard et al. (2014) matrix (Table 3) in Ribeira dos Covões catchment, results in the maps presented in Fig. 7. This matrix provides a clear pattern of high ES potentials in the land cover types with less human impacts. Forests and transitional woodland shrub received especially high ranks. The more anthropogenically influenced land cover types have considerably lower ESs potentials, except for some cultural ESs available in urban areas. Many agricultural land cover types show high potentials for food-related ESs supply, but not so high for regulating services.
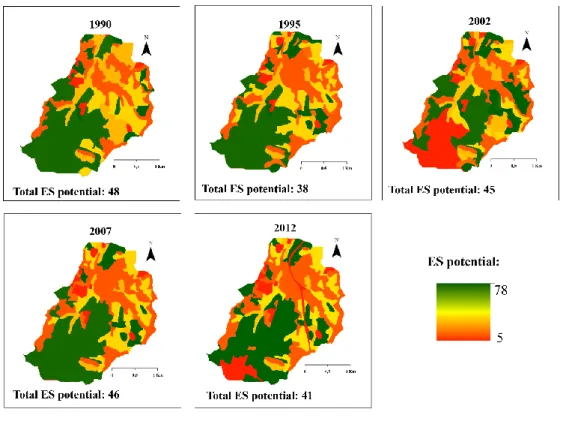
In the first study year, 1958, total ESs supply potential is an intermediate value, considering the extensiver areas of agriculture fields in the study area (45%). In 1979 the potential ESs supplied increases (52) due to the enlargment of mixed forest area (10%). Since 1979, ESs potential supply decreased, mainly due to urban expansion, which led to a slight decrease in forest area, and also due to the conversion of mixed forest into broad-leaved forest, consisting mainly of eucalyptus (monoculture of an exotic specie). The lowest ESs potential supply (38) was recorded in 1995, due to the wildfire which affected 17% of the catchment and about 30% of the forest areas. In 2012 the ESs potential supply was the same estimated for 1958, with a urban expansion from 10% to 40%.
19
Fig. 7 – Mapping of ES potential evolution, between 1958-2012, using (Burkhard et al., 2014) matrix.
Graphic 2 shows the contribution of each land use for the three ESs functions used in Burkhard et al., (2017) matrix, and for the total ESs potential, over the study period. The provisioning services (Graphic 2 B) are promoted mainly by forest and agricultural areas. The urban area did not contribute at all to the provision of these services, however, it has a good contribution to cultural services (Graphic 2C). The burned area also contributes more to cultural services than to the others, taking into account the interest in their study. The contribution of each land use to the regulation services (Graphic 2 A) is very similar to its contribution to the total ESs (Graphic 2D). In general (Graphic 2 D) green areas such as forests or transitional woodland shrub are the ones that most contribute to the potential supply of ESs, although these latter have less influence. As already mentioned, agricultural areas also make a good contribution to the supply of some ESs, especially annual and permanent crops, although they have been declining over the years. The urban area contributes very little to the provision of ESs, although it has its influence on cultural ESs. The sparsely vegetated areas, industrial or commercial units and pastures have a very low contribution to the supply of ESs, since, in addition to being quantified with a low value in the matrix (Burkhard et al., 2014), they occupy a small portion of the study area.
21
Graphic 2 – Percentage of contribution of each land use to the regulation services supply (A), provision services supply (B), cultural services supply (C) and total ES supply (D), between 1958-2012, using (Burkhard et al., 2014) matrix.
5.2 Potential Ecosystem Services in 2012, based on improved methodology
The ESs matrix developed from the local stakholders knowledge is shown in Table 5. It shows that land uses with greatest human influence are generally qualified as adverse to ESs potential, traduced by the negative values. In general, the industrial or commercial land uses and the road networks are identified as providing a strong negative impact on ESs (value -42), followed by continuous (value -41) and discountinuous (value -39) urban areas, considered to provide some negative potential. Agricultural areas and open spaces with little or no vegetation present a low value of potential supply of ESs. Areas of vegetation are quantified with a high value of ESs potential, with forests having the highest value, namely mixed forests.
22
Table 5 - Ecosystem service potential matrix developed through a questionnaire made by experts. Scale from -2 = highly affected potential; -1 = lowly affected potential; 0 = no relevant potential; 1 = low relevant potential; 2 = high relevant potential.
Corine land cover type Reg
u la ti n g E S G lo b al c li m at e Lo ca l cl ima te A ir q u al it y W at er p u ri fi ca ti o n Er o si o n r eg u la ti o n F lo o d R eg u la ti o n G ro u n d w at er r ec h ar g e P est a n d d is ea se c o n tr o l R eg u la ti o n o f w ast e P o ll in at io n S u p p o rt in g E S N u tr ie n t cy cl e S o il f o rm at io n P ri mary p ro d u ct io n Pr o v isi o n in g E S C ro p s W il d f o o d s an d r eso u rc es Li v est o ck ( d o mes ti c) F o d d er Ti m b er B io mass f o r en er g y B io ch em ic al s & M ed ic in e F re sh w at er C u lt u ra l E S R ec re at io n & to u ri sm La n d sc ap e ae st h et ic s & in sp ir at io n K n o w le d g e sy st ems R el ig io u s & s p ir it u al ex p er ie n ce C u lt u ra l h er it ag e & d iv er si ty N at u ra l h er it ag e & d iv er si ty T OTA L E S PO T E N T IA L
Continuos Urban Fabric -20 -2 -2 -2 -2 -2 -2 -2 -2 -2 -2 -6 -2 -2 -2 -14 -2 -2 -2 -2 -2 -2 0 -2 -1 2 -2 0 0 1 -2 -41
Discontinuos Urban Fabric -17
-1 -1 -1 -2 -2 -2 -2 -2 -2 -2 -6 -2 -2 -2 -14 -2 -2 -2 -2 -2 -2 0 -2 -2 1 -2 0 0 1 -2 -39 Industrial or commercial units -20 -2 -2 -2 -2 -2 -2 -2 -2 -2 -2 -6 -2 -2 -2 -14 -2 -2 -2 -2 -2 -2 0 -2 -2 2 -2 0 0 0 -2 -42
Road networks -20 -2 -2 -2 -2 -2 -2 -2 -2 -2 -2 -6 -2 -2 -2 -14 -2 -2 -2 -2 -2 -2 0 -2 -2 2 -2 0 2 0 -2 -42
Green urban areas 14 2 2 2 2 1 1 1 1 1 1 3 1 1 1 1 0 0 0 0 0 1 0 0 8 2 2 2 0 1 1 26
Olive Groves 8
1 1 1 1 1 1 0 -1 1 2 4 1 1 2 4 2 1 1 1 0 0 0 -1 6 1 1 1 0 2 1 22
Permanently irrigated land 3 -1 1 1 -1 0 1 1 -1 1 1 3 1 1 1 3 2 0 0 1 0 0 1 -1 2 0 1 1 0 0 0 11
Broad-leaved forest 19 2 2 2 2 2 2 2 2 1 2 6 2 2 2 8 0 2 0 0 2 2 1 1 7 1 2 2 0 1 1 40 Coniferous forest 19 2 2 2 2 2 2 2 2 1 2 6 2 2 2 8 0 2 0 0 2 2 1 1 7 1 2 2 0 1 1 40 Mixed forest 20 2 2 2 2 2 2 2 2 2 2 6 2 2 2 9 0 2 0 0 2 2 1 2 8 1 2 2 0 1 2 43
Transitional woodland shrub 16 1 2 2 2 1 2 2 1 1 2
6 2 2 2 8 0 2 1 1 0 2 1 1 7 1 2 2 0 0 2 37
Sparsely vegetated areas 9 1 1 1 0 1 1 1 0 1 2 3 1 1 1 6 0 1 1 1 0 1 1 1 3 0 1 1 0 0 1 21
Open forests 9 -1 1 1 1 1 2 1 0 1 2 4 2 1 1 7 0 1 2 1 0 1 1 1 3 0 1 1 0 0 1 23 E co sy st em S er v ic es
23
Regarding the spatial variability of ESs, it can be observed that areas with high ESs potential are mostly dispersed spots, crossed by harmful areas to ESs potential, such as urban areas and road networks. However, there is still a continuous forest area, which occupies about 25% of the study area. The areas without influence on ESs potential are quite dispersed and occupy only 7%, being represented by agricultural areas. Areas with negative influence on ESs potential are dispersed in the weastern part of the study area, but on the eastern side of the study area they approach. There are still small areas with positive influence on ESs potential scattered over areas with negative potential, represented by green urban areas.It is also possible to realize that sometimes, the same type of land use can have different influences on ESs. For example the high potential provision of ESs in the green urban areas, and the low potential in other urban areas, as well as it is portrayed in the distinction of high potential in the broad green areas and low potential in those interspersed by road networks (Fig. 8).
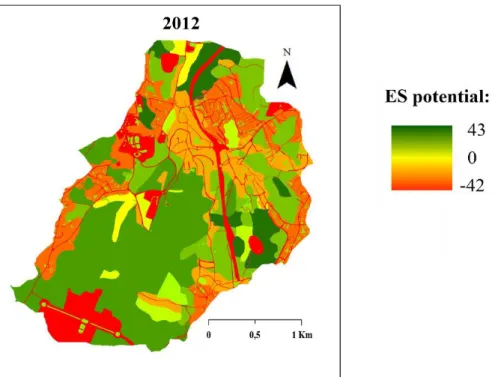
Fig. 8 - Mapping of ES potential of Ribeira dos Covões catchment in 2012, based on expert matrix.
Overall, the total ESs potential in the study area is positive (indicar valor), with about 40% of its area hampering the provision of ESs, and 60% of it contributing for ESs supply. The land uses with a major contribution to the provision of ESs in the 2012 are those with a higher value, be it positive or negative, and those that occupy a greater percentage of the total area.
24
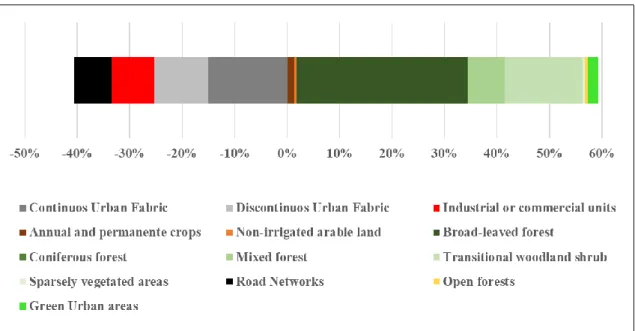
According to Graphic 3, the land uses with greater positive contribution to the total ESs potential (35%) are the broad-leaved forest wich cover 30% of the catchment area, followed by the transitional woodland shrub (cover 15% of the área and provides 15% of the total ESs). Despite the small area occupied, the green urban areas (3%) contribute 3% to the total ESs potential, more than the agricultural areas, which cover 4% of the area and provides 2% of the total ESs. The continuous urban fabric is the land use with a greater negative contribution on the total ES potential (-15%), although all urban areas contribute negatively to the ESs supply.
Graphic 3 - Percentage of contribution of each land use to the ES supply, in most recent study year, 2012, using experts matrix.
5.3 Flood regulation service in 2012
The flood regulation is provided by catchment properties wich favour water infiltration and retention, mitigating surfasse runoff generation and flood hazard (Burkhard et al., 2012). The mapping of flood regulation potential is based on land use, slope and lithology maps traducing matrices values. These maps are shown in Fig. 9.
25
Fig. 9 - Mapping of flood regulation potential in 2012, using experts matrix.
Given the strongest influence of land use on flood regulation potential (60%), comparing with slope (20%) and lithology (20%), there are similar spatial distribution of this ES between both maps (Fig. 9). However, it is possible to see some differences in the flood regulation potential final map (Fig. 9), derived from slope and lithology, especially when areas with different flood regulation potential influences are crossed.Lithology has lower contribution to flood regulation potential in the eastern part of the study area, where limestone is dominant. In the western part of the study area, lithology increased flood regulation potential, along with the slope, mainly in urban areas. When the land use presents a negative value, the slope provides some increase in the flood regulation service, as observed in SW part of the catchment.
6 Discussion
Land use changes since 1958 led to spatial diferences in the potential supply of ESs in Ribeira dos Covões catchment (Fig. 7). However, the total potential supply of ESs in 1958
26
and 2012, following Burkhard et al. (2014) methodology, remains the same (41), although the value has changed in intermediam years, ranging from 38 in 1995, when a wildfire affected part of the forest area, and 52 in 1979, when forest areas were extensive (60%) and urban cover was rather limited (15%). Although urban areas reach 40% in 2012, the forest area (50%), mainly covered by broad-leaved forest, provides high potential ESs supply (Fig. 7). Although the agricultural area was considerably reduced (from 50% in 1958 to 3% in 2012), it did not provide a significant reduction in the total ESs supply (Graphic 2), maily due to relatively low cultural and regulating services provided (Table 3).
These results show that adverse effects provided by urbanization on ESs may be compensated through adequate land use planning, based on the establishement of other land uses with high ESs supply, such as green areas, although influenced by enhanced supply of other ES type. For example, the 40% decrease on agricultural areas over the study period, lead to a reduction of provisioning ESs, which was partially compensated by increase in regulating ESs provided by forest enlargement. Furthermore, transitional woodland shrub provides less than half of the potential ESs provided by mixed forests (Table 3). In 2012, forest areas are mainly dominated by broad-leaved forest (Annex 1), which provides the highest ESs potential supply (Table 3). However, it important to take into account that the broad-leaved forests in the study area mainly comprises eucalyptus, which provides lower ESs than native broad-leaved forst, such as oak, which encompasses larger number of species and provides diversified hatitat for fauna. Furthermore, eucalyptus is a species of high water consumption, high potential for soil degradation, low potential for biodiversity, and more difficult to control wildfires (Ping and Xie, 2009).
In order to better quantify the ESs in Ribeira dos Covões catchment, a new ESs matrix was developed, based on local experts’ knowledge, instead of central European countries, used in the Buckhard et al (2014) methodology. Furthermore, the new matrix also included more detailed land use types, in order to better describe ESs in such a small catchment.
In 2012, the impact of land use pattern on the ESs supply is very visible in the patchy ESs suplly (Fig. 8). Experts have identified a negative influence of all urban areas, including roads and industrial areas, on the potential ESs supply. This helps to realize that these areas are harming / hampering the provision of ESs in these areas. This means that instead of providing ES, these land uses are actually requiring ESs. However, the inclusion of
27
green urban areas in this matrix has helped to realize that these areas, although urban, are quantified with a high potential for ESs (Table 5), which demonstrates its importance in urban land uses (Graphic 3). Land uses with great ESs potential however, may be also interrupted by smaller areas with negative ESs potential. In a few cases, roads cut the high ESs potential supply of the green areas, since they are mostly used as a link in urban areas (Fig. 6).
Despite the improvement of the methodology, which is more adapted to the study area, it still has limitations. The forest species type is not include in the matrix (Table 5). For example, although the broad leaved forests in the study area be essentially eucalyptus, and the experts know the study area, it was not asked in the questionnaires to quantify the eucalyptus forest. Thus, if this land use were quantified as being a eucalypt area, it would probably have a lower ESs potential value, which would influence the total ESs potential obtained in the study area, mainly since the replacement of the mixed forests by the borad-leaved forests, in 1990.
This study also provides particular attention to the quantification of flood regulation service, based in a new methodology including biophysical catchment properties. Although, the study of flood regulation evolution in Ribeira dos Covões catchment has also been done, but using Burkhard et al (2014) matrix (Ferreira et al., 2017a).
In 2012, Ribeira dos Covões catchment comprises 40% of the area with negative potential and 60% with positive potential supply for food regulation. Negative values may be indicative of higher flood hazard, considering land use, slope and lithology characteristics. These negative flood regulation potential are mostly associated with urban land uses (Fig. 6 and Fig. 9). The urban areas, where population is concentrated, have limited water infiltration and water retention capacity. Opposing, vegetated areas provide potential food regulation supply, due to high water retention capacity, mainly in forest areas and areas with natural vegetation. Nevertheless, urban areas located in areas with lower slope have higher flood regulation potential than urban areas in steeper slopes, mainly noticed in the southwest part of the catchment (Fig. 9). Furthermore, the west side of the catchment has a greater potential to provide flood regulation than the east side, due to higher permeability of the sandstone than limestone soils (Ferreira et al., 2015). This methodology, which maps the spatial variation of flood regulation service should be used for the stakeholders to discuss and decide about flood mitigation measures.
The Ribeira dos Covões study site represents several Portuguese peri-urban catchments, where native forests were converted into woodland monocultures (e.g. eucalyptus forest),
28
for industrial timber production; urban expansion; and even the susceptibility to forest fires, as recorded in 1995 (DGT, 2014). These land use changes have implications for potential ES supply. Nevertheless, at national level (Portugal), the productivity gains obtained from ESs have brought important benefits to the well-being of the majority of the human population. However, to achieve these gains, biodiversity is lost and ecosystem support and regulation services are degraded (such as climate regulation and water quality regulation), undermining the medium-term sustainability of the gains (Pereira et al., 2009).In the study area this is not the present reality; on the contrary, the agricultural area has been decreasing.
Although urban areas cover 40% of the Ribeira dos Covões areas, it is expected that urbanization trend will continue. While development is a positive process for any country, city or region, it must be done in a "sustainable way", assuring not only the protection of the environment and biodiversity, but also the human well-being. In order to achieve sustainable development and resilient cities, it is important that the landscape is managed and planned in order to maximize the ESs potential supply. All land uses have the ability to provide ESs, even if they provide distinct services such as food or "tourism". Proper landscape management can enhance the conservation of natural ecosystems, or at least maintain the services they provide, maximizing their benefits for the society. It is important that urban planning integrates forest areas and other green areas, in order to maximize ESs and, namely, minimize flood hazard. This kind of methodology can support nature based solutions. These solutions based on ESs have already proved their efficiency (Keesstra et al., 2018). For example, the concept of "sponge cities" as alternatives to transform urban infrastructures into green infrastructures, so they could capture, control and reuse precipitation in a useful, ecologically sound way (Li et al., 2017), or the urban agriculture, as productive features from community farms and rooftop gardens to promote edible landscaping (Lin et al., 2016). This would create, within urban land uses, areas with high potential to provide ESs, which would greatly improve the overall state of ESs in peri-urban and urban catchments.
Considering the quantification of the forest types in the new methodology used (Table 5), the broad-leaved and coniferous forests presents a lower value of ESs potential than the mixed forest. Then, would be a good option a right planning of the forest area, as for example the use of several types of forests brands (Pereira et al., 2008), in order to promote the conservation of natural ecosystems and to achieve a greater ESs supply.
29
7 Conclusion
Natural and semi-natural ecosystems play a key role in regulating and maintaining ecological processes and life support systems on earth. They provide numerous resources, ranging from oxygen, water, food, medicinal and genetic resources to energy sources and materials for clothing and construction (de Groot et al., 2002). However, they are modified by man, to respond to the rapid growth of demand for food, water, wood, and fuel, induced by demographic and economic growth (Pereira et al., 2009).
The Ribeira dos Covões catchment underwent changes in land uses, which resulted essentially in a decrease in the potential supply of ESs. Continuing urbanization and changing types of forests are the main factors behind those changes. ESs such as air quality, climatic comfort associated with conditions such as wind and temperature, freshwater, flood regulation and even food production (which is pratically nonexistent in the study area) are being significantely afected. ESs are important for human well-being, but its supply has gradually decreased. However, this decrease has not yet been noticed. In fact, the study area maintains its peri-urban character, mingling urban areas with forested and agricultural land uses. ESs assessment made possible to pinpoint the relevant role of urban green areas in increasing ESs potential supply in the urban area, which in turn is quantified as unfavorable to this supply. Road networks provide an example of how their intersection with vegetation, decrease their potential to provide ESs. However, these areas serve mainly as a link between urban areas, at the Ribeira dos Covões study area. It was also possible to conclude that the same land uses affect both ESs in general and the flood regulation service, in a more significant way. However, soil characteristics, slope angle and lithology type also influence the provision of flood regulation. We could identify visually the areas with greater protection against flood, by opposition to those with little or no protection. These are located in an area that damages the provision of flood regulation. This helped to realize that the lack of flood regulation provision can be ascribed to identified areas, that in this case in particular may enhance flooding risk. The mapping and quantification of the different ESs allows to identify the locations of maximum supply of ESs, and those that produce a negatively supply, identifying a set of ESs that can be supplied in a certain area. This type of analysis is important to anticipate future trends and to develop practices that promote the sustainable development of
30
societies, thus appearing as a very useful tool to define management actions aimed at the sustainable management of ecosystems and the services they provide.
According to the MA for Portugal (Pereira et al., 2008), the main environmental problems forthe next decades will only be minimized if there is a proactive attitude of society. This also applies to the study area . In the most favorable scenario, economic development will be based on scientific and technological investment and on the valuation and creation of markets for a wide range of ESs. In the most unfavorable scenario, we will see an increasing gap of Portuguese economic development levels when compared with the European Union average, the aggravation of agricultural intensification problems and the maintenance of forest fires (Pereira et al., 2008).
The following step should focous on preventing and solving existing problems in the study area, namely the implementation of solutions to optimize ecosystems’ functions and the services they provide. To this end, a spatial valuation of ESs must be integrate into regional planning and development (Tammi et al., 2017). The MA evaluation for Portugal (Pereira et al., 2008), provides some feasible solutions to respond to this type of ecosystem problems, (also appliable to the Ribeira dos Covões catchment): the conversion of part of the monoculture forest areas in forest areas with higher biodiversity, composed of native species, capable of providing a diverse range of ESs; the maintenance of traditional farming systems and practices;and integrating ESs based concerns in forest and agricultural production processes. In this context, certification processes may play an important role. Of utmost relevance are the implementations of solutions leading to the renaturation of urban areas, increasing the area and number of green areas in the urban area, with the purpose of providing a greater number of ESs, and especially in this specific case, to help increase flood regulation service in urban areas.
As a conclusion, we should not spare the services of the ecosystems, we must promote their supply and develop know how to increase their efficient use.
8 References
ATEAM: Advanced Terrestrial Ecosystem Analysis and Modelling project. 2004. Potsdam Institute for Climate Impact Research, Germany.