Sustainability 2020, 12, 4995; doi:10.3390/su12124995 www.mdpi.com/journal/sustainability Article
Exploratory Data Analysis and Data Envelopment
Analysis of Construction and Demolition Waste
Management in the European Economic Area
Guillermo L. Taboada 1,*, Isabel Seruca 2,3, Cristina Sousa 2,4 and Ángeles Pereira 51 Computer Architecture Group, CITIC, Universidade da Coruña, Campus de Elviña,
15071 A Coruña, Spain
2 Research on Economics, Management and Information Technologies (REMIT), Universidade Portucalense,
Rua Dr. António Bernardino Almeida, 541 4200-072 Porto, Portugal; [email protected] (I.S.); [email protected] (C.S.)
3 ISTTOS, Centro Algoritmi, University of Minho, Campus Azurém, 4800-058 Guimarães, Portugal 4 Iscte-Instituto Universitário de Lisboa, Dinâmia’CET, 1649-026 Lisboa, Portugal
5 Department of Applied Economics, Universidade de Santiago de Compostela,
15705 Santiago de Compostela, A Coruña, Spain; [email protected]
* Correspondence: [email protected]
Received: 16 May 2020; Accepted: 16 June 2020; Published: 18 June 2020
Abstract: This paper deals with the efficiency and sustainability of Construction and Demolition
Waste (CDW) management in 30 Member States of the European Economic Area (EEA) (the 28 European Union countries plus Norway and Iceland) for the period 2010–2016 using Exploratory Data Analytics (EDA) and Data Envelopment Analysis (DEA). The first stage of the proposed methodology is EDA with already available (the CDW recovery rate) and suggested indicators (e.g., building stock characterization, dwelling occupancy ratio, macroeconomic ratios and CDW breakdown) to characterize the efficiency and sustainability of CDW management. The second stage is to assess the efficiency of countries using DEA through two original CDW production models, one for sustainability, measuring the efficiency of the construction sector for reducing its CDW, and the second a model to score the efficiency of maximizing the CDW recovery rate. The main outcome of the paper is the proposed methodology, which is a candidate for replacing current indicators in order to evaluate the performance of CDW policy, due to is adaptive nature, promoting the continuous improvement and overcoming the limitations of the poor quality of metrics, data and parametric indicators. The methodology has been experimentally validated using Eurostat data for 30 Member States of EEA, ranking them according to the two DEA model scores, to point out the countries considered efficient among those of their scale, as a reference for sustainable and efficient practices.
Keywords: Construction and Demolition Waste (CDW); Exploratory Data Analytics (EDA); Data
Envelopment Analysis (DEA); sustainable CDW management; efficient CDW management
1. Introduction
Construction and Demolition Waste (CDW) accounts for approximately 35% of all waste generated in the European Union (EU), reaching 925 million tons per year [1]. China has been generating more CDW over the last years (1.13 billion tons in 2014) while United States generates over 548 million tons [2]. CDW consists of numerous materials, including concrete, bricks, gypsum, wood, glass, metals, plastic, solvents, asbestos and excavated soil. Many of these materials are actually being recycled, re-used or backfilled by substituting other materials (e.g., in roads and drainage construction), favored by regulation and generally available technology. The recovery
success depends heavily on being separated at origin. In fact, once mixed, CDW pose particular risks when containing hazardous waste, as well as hampering recycling [3].
The European Commission (EC) [4] has identified CDW as a priority waste stream. The Waste Framework Directive (WFD 2008/98/EC, Article 11.2) sets a recovery target to attain 70% CDW recycling (CDW recovery rate indicator) in all Member States (MS) by 2020, and, according to the latest Eurostat Data (2016) (see Appendix A), the EU 28 already have a recovery rate of 89%, with countries ranging from below 10% to more than 90%. The recovery rate is not only recycling, but also backfilling operations, where suitable non-hazardous waste is used for purposes of reclamation in excavated areas or for engineering purposes in landscaping. Waste used for backfilling must substitute non-waste materials, be suitable for the aforementioned purposes and be limited to the amount strictly necessary to achieve those purposes. Here, comparisons across countries are cumbersome, as the definition of CDW, particularly for backfilling, varies. In fact, in some countries even materials from land levelling are considered CDW (the WFD excludes naturally occurring material), as its recovery is quite direct, influencing the metrics.
The EC is promoting CDW management protocols and guidelines [5,6] in line with the waste hierarchy (with a priority for the prevention and reuse as higher-ranking options than recycling and recovery), to contribute to resource efficiency and enable the transition from a Linear to a Circular Economy (CE) [7,8], particularly relevant in the construction industry [9]. Additionally, special efforts are being made in regulation, publishing EU guidelines for audits before building demolitions (characterizing valuable materials and hazardous substances) and Level(s) [10], a voluntary reporting framework to assess the environmental performance of buildings through indicators that help aligning particular building practices with EU and Member States’ policy goals.
The objective of this paper is to analyze the efficiency and sustainability of CDW management, using already available indicators and especially proposing new ones, not only for assessing the degree of compliance with regulations (the CDW recovery rate), but also the efficiency in the resource usage using indicators. Firstly, Exploratory Data Analysis (EDA) [11] has been used for identifying the main factors influencing CDW indicators. Secondly, Data Envelopment Analysis (DEA) [12,13] has provided efficiency indicators of national CDW management against their comparable peers, thus avoiding the influence of economies of scale, management policies, and data with several levels of quality.
The reminder of the paper is structured as follows: the current state of the research field is presented in Section 2 and our methodology for assessing the efficiency and sustainability of CDW using EDA and DEA is explained in Section 3. Section 4 presents the analysis using the proposed methodology and Eurostat data (see Appendix A) for the period 2010–2016 and for 30 EEA countries (at that time the EU28 MS, plus Norway and Iceland, excluding Liechtenstein for its lack of detailed CDW data). This enables validating the methodology and analyzing comparatively at the national level the heterogeneity of CDW management. The section also includes several rankings of EEA countries according to their CDW management efficiencies using a set of proposed DEA production models. Section 5 discusses the main findings with a systematic approach to reviewing the proposed methodology. In Section 6, we draw the main conclusions, stressing that the proposed methodology based on EDA and DEA has demonstrated its utility as a tool for analyzing CDW efficiency and sustainability indicators, particularly because it overcomes the limitations of indicator-based policies and the lack of fully comparable data across countries.
2. State of the Art in Exploratory Data Analysis and Data Envelopment Analysis of CDW
Indicators are key to managing and improving systems. Therefore, indicator-based assessments of CDW management are critical to evaluate its efficiency and to achieving sustainable development. However, there is a shortage of research and a lack of methodologies to measure CDW management consistently due to the traditional and atomized nature of the building sector [14], particularly when considering the CE paradigm [15,16]. In this context, two methodologies arise as particularly suitable: EDA and DEA.
EDA is a popular methodology due to the increasing availability of datasets and its ability to derive insights from data, being usually the first technique when approaching data, assisting both with the identification of hidden patterns and correlations among attributes, but also with the formulation of hypotheses from the data and its validation.
EDA has been used in multiple sectors, also in construction for many years, relying on a wide range of techniques and tools [17], from basic statistical exploration and visualization to more sophisticated attribute transformations such as Principal Component Analysis (PCA), Factor Analysis (FA) and Canonical Correspondence Analysis (CCA). In waste management practice, PCA, because of its power and simplicity, is preferentially used over FA, ([18] reports little difference between PCA and FA). In [19], PCA was used to explore leaching parameters from Municipal Solid Waste Incineration (MSWI) fly ash to obtain an overview of the mobility of metals under certain conditions. PCA/FA generally helps in finding hidden relationships between variables, whereas CCA is useful for ecological community data, for the interaction of waste in the environment and species through different pollutants [20]. Apart from these specific studies, which involve different chemicals and the prerequisite of multivariate data analysis, most of the studies on CDW rely on univariate and bivariate statistical analysis and visualization.
A recent (October 2017) analysis of the CDW management situation in EU MS [21] covers CDW generation performance, directly related to the economic situation of each MS, as well as its degree of compliance with EU goals, identifying good methodological practices and obstacles. This related work combines EDA with qualitative research, also highlighting six case studies. Moreover, it assesses the reliability of CDW statistics, identifying the sources of inaccuracy and proposing measures for their improvement.
In [14], a set of CDW indicators with their corresponding confidence degree was proposed, namely the amount and breakdown in different materials of CDW per square meter of six specific sectors, the combinations of residential and non-residential construction/demolition/refurbishment activities. The objective was to estimate CDW on site both globally and by waste stream. The indicators were derived from previous works and were analyzed using EDA with basic statistics and visualization (boxplots).
Using EDA, Villoria Sáez and Osmani [1] examine and compare CDW generation and CDW recovery rate across EU MS in correlation with their respective national construction turnover, Gross Domestic Product (GDP) and CDW per capita, proposing a novel analysis approach, CDW-TGC, and ranking 18 EU MS using this indicator with 2014 data. The paper points out the ineffective CDW regulations and incoherent data quality.
Another study [22] assesses the 28 EU MSs’ environmental efficiency for the period 2008–2014 using Municipal Solid Waste (MSW), selecting three inputs (labor, population and gross fixed capital formation) and five outputs (waste generation, GDP and tree pollutants SOx, NOx and greenhouse gas (GHG) emissions). It concludes, after designing six environmental production models, each with different inputs and outputs, that the recycling rate and the percentage of usage of sustainable treatment options at each country are a proxy variable of the DEA efficiency, these variables being directly related.
A more recent paper [23], focused on the MSW recycling market in Spain at a subnational level (regions are DMUs) and found that per capita income and population density significantly explain regional differences.
DEA has been used in the construction sector in recent years. In [24], the authors evaluated the eco-efficiency of construction materials using DEA, in combination with lifecycle assessment and lifecycle cost methodologies, using environmental effects as an input, subject to be minimized to maximize the efficiency of the output (generated value).
One of the aforementioned methodologies, Lifecycle Assessment (LCA), is a cradle-to-grave or cradle-to-cradle analysis technique to assess environmental impacts [25] associated with all the stages of a product’s life, from raw material extraction through materials processing, manufacturing, distribution, use and finally end-of-life. In the construction industry [26] , LCA has been gaining popularity due to the increasing interest in building sustainably. Regarding CDW management, LCA
has been used to assess solid waste management systems and their potential environmental impacts [27,28], revealing the need for reliable, transparent and detailed data describing the technical and economic performance of each solid waste collection, separation, treatment and disposal process. These are the main limitations to the application of LCA to a complex process such as CDW management. Furthermore, LCA has been traditionally focused on a product or service (in [28] just 1Mg mineral to be used either in road construction or landfilled or in [29] a multifunctional building glass façade project). This scoping problem could be overcome by aggregating sector level data, a technique called Economic Input-Output LCA (LCA). As for [24] LCA, and particularly EIO-LCA, it can be combined with DEA, but for the sake of simplicity this combination is considered as future work, especially due to the aforementioned limitations of LCA in analyzing CDW management.
In our paper, we extend these previous works by: (1) proposing a simple and effective methodology, that includes new indicators and incorporates the computation of efficiencies through DEA, and (2) considering 30 EEA countries with the most up-to-date data (Eurostat 2016 data). Additionally, our research shows that the CDW recycling rate is not a proxy variable of DEA efficiency due to the heterogeneity of CDW management, which opposes the conclusions of [22]. In fact, DEA efficiencies directly relate to low-generation CDW, which could be a sign of a lack of data quality.
3. Materials and Methods
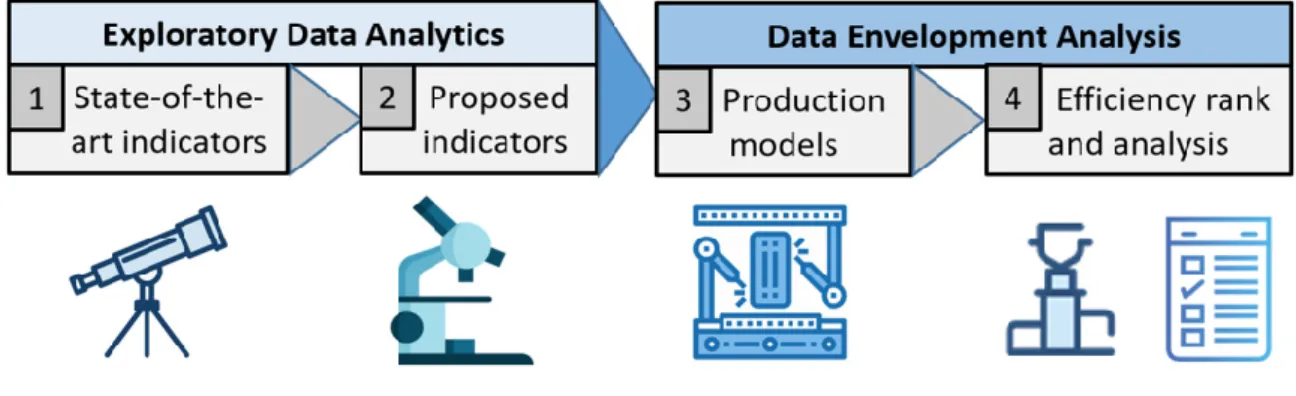
This paper introduces a methodology for assessing efficiency and sustainability of CDW management consisting of four stages: (first) EDA using state-of-the-art indicators; (second) EDA using suggested indicators that deepen the analysis; (third) DEA using several original CDW production models; and (fourth) ranking countries according to efficiency measures and analyzing the results. Figure 1 summarizes graphically the methodology.
Figure 1. Overview of the proposed methodology.
3.1. Exploratory Data Analysis (EDA) for Assessing the Efficiency and Sustainability of CDW Management
The first stage of the proposed methodology uses EDA with state-of-the-art quantitative indicators at a macroeconomic level, including CDW recovery rate and those proposed by [1]: CDW per construction turnover, GDP and capita. One of the main drawbacks of other types of indicators (e.g., qualitative, microeconomic and product flows measures) are their specificity and complexity, which discourages deriving efficiency and sustainability insights.
The main contributions of EDA, also known as Visual Analytics, are its simplicity and efficiency in deriving insights from data. It is usually the first technique when approaching data. According to Tufféry [30] EDA usually consists of six steps (see Figure 2) namely: (i) distinguish/identify attributes; (ii) univariate data analysis to characterize the data in the dataset; (iii) detect interactions among
attributes by performing bivariate and multivariate analysis; (iv) detect and minimize impact of missing and aberrant values; (v) detect outliers (further analysis or errors); and, finally, (vi) feature engineering, where features are transformed or combined to generate new features.
Figure 2. Exploratory Data Analysis (EDA) steps.
There is a large number of tools for performing EDA (50 of them are analyzed in [17]) with different functionalities to assist both with the identification of hidden patterns and correlations among attributes, but also with the formulation of hypotheses from the data and their validation. EDA can also be performed using R (used in our research work, together with Datawrapper visualization), python or any other programming language oriented to data preparation, exploration, and visualization.
3.2. New Indicators for Assessing the Efficiency and Sustainability of CDW Management
The limited number of quantitative indicators at a macroeconomic level limits the assessment of the efficiency and sustainability of CDW management. For this reason, new indicators are required. Some of the most used sustainability indicators [31] for the environmental dimension are GHG (measured in CO2-eq), CO, NH3, NOx, PM10, PM2.5, SO2, VOCs (Volatile Organic Compounds), and
energy. They are commonly used for scope-based carbon emissions. Regarding the economy dimension, total output, total intermediate, tax, gross surplus and import are usually considered. Finally, the social dimension includes men employment, women employment, injuries occurred, high-/medium-/low-skilled labor compensation and overall compensation.
However, when it comes to the construction industry, and to CDW management, it is necessary to define more tailored indicators. Furthermore, the introduced indicators should be able to assess the five CE requirements to be measured, in line with the new EU policy: (i) Reduce the Input and Use of Natural Resources; (ii) Reduce Emissions; (iii) Reduce Valuable Material Losses; (iv) Increase Share of Renewable and Recyclables Resources; and (v) Increase the Value Durability of Products. A review of 30 micro-level indicators for CE moving away from to the Triple Bottom Line (TBL) of sustainability (economic, environmental and social indicators) is presented in [32], discussing three types of indicators: single quantitative, analytical tools and composite indicators. This review analyzes recycling, end-of-life management, remanufacturing, resource-efficiency, disassembly, lifetime extension, reuse, and, finally, the overall waste management procedures. In the CE waste management is the last solution, and, as for recycling, it is usually measured using ratios, both total waste and of the recyclable part.
Another source of tentative indicators is provided in [33], a work that analyzes 63 indicators and 24 features relevant to the CE, highlighting the product perspective in addition to the efficiency of
processes. Based on this work, we have decided to include data on the longevity, availability and occupancy of building stock.
CDW generation is influenced by several factors, including population, urbanization, GDP, and CDW Management regulatory measures [1]. However, population and urbanization parameters on CDW generation are best captured through the occupancy index, which is the eventual indicator that reflects population increase/decrease, migrations, and urbanization pressure. Moreover, the energy and characterization of pollutants can also be included (both in the environmental dimension, and energy cost in the economic one) whenever good quality data is available.
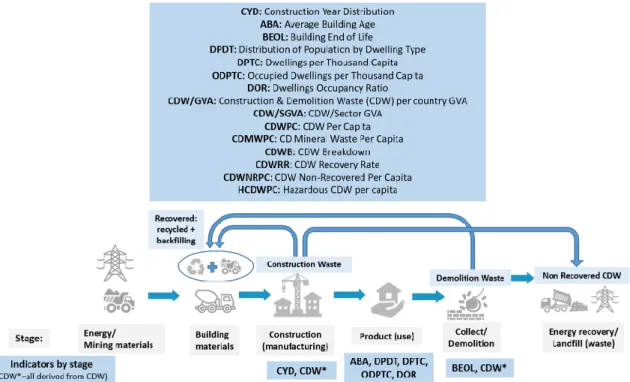
Table 1 contains our set of proposed indicators worth analyzing, based on the requirements of the analysis for assessing the sustainability and efficiency of CDW management. Figure 3 presents a graphical schema of the proposed indicators. In this paper, we consider just the material alone, from raw materials to CDW recycling/reuse of materials, while the energy variable, pollutants and GHG remain out of the scope of this research work.
This second stage, EDA with these proposed indicators, is expected to better characterize the efficiency and sustainability of CDW management than using the previously introduced parameters. Previous works [34] have successfully used DEA for assessing the ecological dimension of sustainability in the EU. Some of the most relevant contributions of this set of candidate indicators are: (i) characterizing the building stock through year construction, average age, and type of construction; (ii) using the dwelling occupancy ratio as proxy for the habitational needs; (iii) use of Gross Value Added (GVA) rather than GDP, as it accounts more directly for the value provided by sector activity (without taxes and subsidies); and (iv) providing ratios for CDW management Key Performance Indicators (KPIs).
Table 1. Proposed indicators for assessing efficiency and sustainability of Construction and
Demolition Waste (CDW) management.
Indicators Definition Unit
CYD: Construction Year Distribution
Distribution of building depending on the construction
period Percentages
ABA: Average Building
Age Estimated average age of buildings Years
BEOL: Building End of Life Useful life period according to the generally adopted
accounting principles for each country (e.g., 50 years) Years DPDT: Distribution of
Population by Dwelling Type
Share of the population living in (a) building with at least 10 flats, (b) buildings under 10 flats, (c) semidetached, and
(d) detached houses
Percentages DPTC: Dwellings per
Thousand Capita Dwellings per thousand capita
Units per thousand capita ODPTC: Occupied
Dwellings per Thousand Capita
Occupied dwellings per thousand capita Units per
thousand capita DOR: Dwelling Occupancy
Ratio ODPTC/DPTC Percentage
CDW/GVA CDW per million € Gross Value Added (GVA) Ton/M€
CDW/SGVA CDW per million € Construction GVA Ton/M€
CDWPC: CDW per Capita CDW per capita kg/capita
CDMWPC: CD Mineral
Waste Per Capita CDW per capita kg/capita
CDWB: CDW Breakdown Distribution of the elements of CDW Percentages
CDWRR: CDW Recovery Rate
Recovery rate of mineral waste of construction and
demolition Percentage
CDWNRPC: CDW non
recovered per capita CDW non recovered per capita kg/capita
HCDWPC: Hazardous
Figure 3. Proposed efficiency and sustainability CDW management indicators with both linear arrows
and CDW recovery circular loops.
3.3. Data Envelopment Analysis (DEA) for Assessing the Efficiency and Sustainability of CDW Management
The third stage of the proposed methodology involves using DEA, a popular technology in CE performance assessments [35], through several CDW production models.
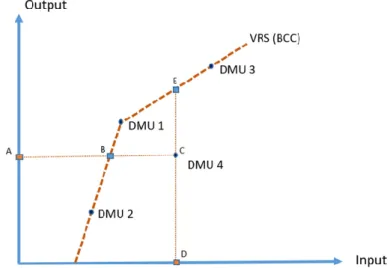
DEA is a non-parametric method to measure the performance of firms of entities, called Decision-Making Units (DMUs). A DMU can be a factory, a bank branch, a hospital, and, as in our paper, a country and its CDW management. The initial DEA models consider Constant Return to Scale (CRS; or CCR for Charnes, Cooper and Rhodes), which ignores the fact that different DMUs could be operating at different scales. In our scenario, this would not make any distinction between Luxembourg (0.6 million people) and Germany (83 million people). To overcome the drawback, the Variable Returns to Scale (VRS or BCC for Banker, Charnes and Cooper) mode [36] was introduced, ensuring that DMUs are only benchmarked against DMUs of a similar size. Figure 4 presents an example of four DMUs and both CRS and VRS efficiency frontiers. Further to VRS, a wide range of DEA models have been designed for measuring efficiency and capacity specializing the original models into different types of problems. However, DEA alone only determines the efficiency scores of each DMU and does not account for the factors related to inefficiency; neither can it predict the performance of each DMU.
Regarding CDW DMUs, due to the heterogeneity of the technology and stakeholders of the sector across territories, VRS is quite likely to be a good fit. This is the opposite to Municipal Waste DMUs where CCR is being used [22] as the consumer habits and regulations are more homogeneous across cities/countries.
Figure 4. Data Envelopment Analysis (DEA) Constant Return to Scale (CRS) and Variable Returns to
Scale (VRS) efficiency frontiers and four Decision-Making Units (DMUs). DMU 1 is the only one in the CRS efficiency frontier (the only efficient CRS), maximizing the Output/Input ratio, whereas DMUs 1, 2 and 3 are in the VRS efficiency frontier (the trees are efficient in VRS, DMU 2 in low input values and DMU 3 in high input values).
DEA models can be classified in either input-oriented or output-oriented models. Figure 5 shows an inefficient DMU (DMU 4) to exemplify both approaches. With input-oriented DEA, a DMU computes the potential savings of inputs in the case of operating efficiently (in Figure 5, reducing the inputs from C to B while providing the same output). In contrast, with output-oriented DEA, a DMU measures its potential output increase given its inputs do not vary (in Figure 5 increasing the outputs from C to E while using the same amount of input, D.
Figure 5. DEA VRS efficiency frontier and DMU 4 efficiencies: (a) input-oriented efficiency = BA/CA,
if C were in the frontier the efficiency would be 1; and (b) output-oriented efficiency = CD/ED, if C were in the frontier the efficiency would be 1.
The bad/undesirable outputs have been treated as inputs, and the inputs as outputs, reversing traditional DEA models [37,38]. This technique is based in the fact that undesirable outputs can be treated as inputs when there is a combination of undesirable and desirable outputs. The objective is to minimize the undesirable output, so considering it as input the function looks for its minimization. However, in our case, when only one undesirable output is considered, we reverse the model to consider how to maximize the inputs for a given undesirable output. As the original model shows
increasing returns to scale, when moving the output to the input it shows decreasing returns to scale. There are alternatives to this approach. The use of a Directional Distance Function (DDF) allows for the simultaneous increase in desirable outputs and reduction of undesirable outputs [39]; however, for reasons of simplicity, DDF and other approaches, such as DEA-Malmquist and Slacks-Based Measure (SBM) DEA, have been kept for future work. Malmquist and SBM have been used in [34] with four input and four output variables not directly related.
A DEA model is a particular selection of inputs and outputs to analyze the efficiency of DMUs. For example, in [21] waste, pollutants and GDP have been selected as outputs, whereas labor, population and gross fixed capital formation have been selected as inputs for the DEA model.
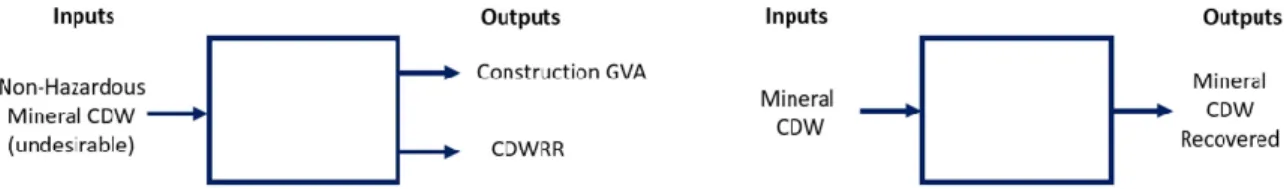
Figure 6 presents our candidate DEA models: a sustainability model (a), and an efficiency model (b). The sustainability model (a) measures the efficiency of a country (or subnational entity or company) for generating construction GVA and maximizing the CDW Recovery Rate (CDWRR) while at the same time reducing Non-Hazardous Mineral CDW. It is an input-oriented model that, for a given construction GVA and CDWRR, looks for minimizing Non-Hazardous Mineral (NHM) CDW. There is no input in the model, as CDW is an undesirable output treated as an input. The reason is that, so far, all the inputs considered in related work, such as labor force and gross capital formation [21], add little value to the model. Alternative inputs, such as national GVA, buildings’ construction year distribution and distribution of population have been tested by us, but these inputs either add little value (GVA is highly correlated with construction GVA) or consider efficient a significantly higher number of countries. In a sector where data quality might be modest/poor and outliers are frequent, the usage of additional variables not directly related to the efficiency metric sought (such as using labor salary for estimating CDW production) causes the efficiency metric to lose discriminatory power. Finally, it is expected that the returns of the model will be varying in scale (thus VRS will be used), and different construction turnover and CDWRR might show different efficiencies when reducing the input.
The proposed CDW recovery efficiency model (see Figure 6b) is output-oriented. It looks for maximizing the amount of recovered material. VRS will be used; otherwise, if constant returns (CRS) have been used, the efficiency would be a mere ratio, and if two countries have 100% recovery rate (in fact three countries in EEA claim to have 100% recovery rate) then a CRS model would be the same as the CDWRR indicator. The main benefit of this model is to discriminate among countries according to the CDWRR obtained by their peers, considering as peers those countries generating similar amounts of CDW. The efficiency of this model is aligned with the CE principle of minimizing the non-recoverable part of the waste. It is likely to show increasing returns of scale, the higher the inputs the lower the recovery effort per input unit, as generating recoverable CDW is scalable.
Figure 6. Proposed sustainability and CDW recovery efficiency DEA models.
3.4. Ranking Countries According to Efficiency Indicators
The fourth and later stage of our methodology is to rank countries using the results of the two candidate DEA models. The proposed ranking assigns 50% of the final score to the sustainability (S) score and 50% to the efficiency (E) score. This parameter weighting has been selected for considering equally important the sustainability and efficient CDW management, although CE promotes the
reduction of waste generation versus the recovery of the generated waste, so, based on this, sustainability should have a higher weight than efficiency. However, considering than the final objective is to minimize the amount of non-recovered CDW, the resources that leave the circular loop, we suggest weighting each score at 50%. Each DEA model provides a metric in the range [0…1], so the sustainable and efficiency (S+E) score will be in the range [0…2].
4. Results
This section presents the analysis, using the proposed methodology and Eurostat data (see Appendix A) for the period 2010–2016 for 30 EEA countries (at that time, the EU28 MS, Norway and Iceland), validating the methodology and analyzing, comparatively at a national level, the heterogeneity of CDW management. The section also ranks EEA countries according to their sustainability (S) and efficiency (E) CDW management efficiencies using DEA production models.
4.1. Assessing the Efficiency and Sustainability of EEA MS CDW Management using EDA
Exploring the e data using the state-of-the-art and proposed indicators has provided an overall overview of the EEA CDW data. In this subsection, the descriptive data of the residential building stock will be first presented, followed by analyses of CDW data.
Figure 7 shows the estimated average building age (ABA indicator) of EU28 residential building stock as of 2014 and its distribution according to the year of construction (CYD indicator; this particular piece of data for Norway and Iceland is not available in the EU Building Database, see Appendix A). The distribution data is presented grouping dwellings in those built before 1945; built in the period 1945–1969; built in the 1970s, 1980s and 1990s; between 2000 and 2010; and built after 2010.
Figure 7. EU28 residential building observatory age and Construction Year Distribution (CYD; in
The average age has been estimated using 90 years for the first period (an average of 90 years for buildings built before 1945) and the central point for the other periods. The EU28 estimated ABA is 48 years. This data shows significant construction activity in Luxembourg and Bulgaria after 2010, and in Cyprus, Ireland and Spain in the previous decade. Insights that can be derived from this table are that it is likely that in the United Kingdom (UK) and Germany the relatively old building stock contains more hazardous materials, from demolitions and refurbishments, than Ireland and Cyprus, two of the countries with the youngest residential buildings.
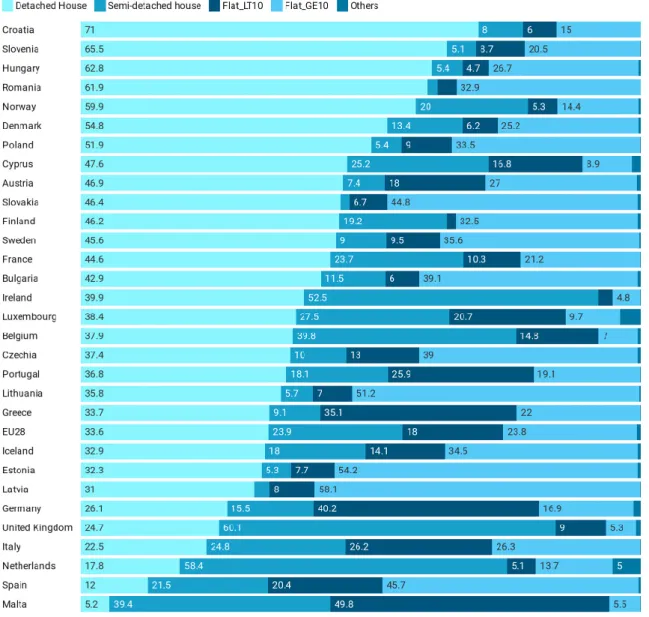
Figure 8 shows the distribution of population by dwelling type (DPDT indicator). This is a useful indicator for estimating construction materials efficiency. In fact, flats in buildings with ten or more flats (in the Figure the label Flat_GE10) are, in theory, the most efficient, in terms of shared constructive elements, followed by flats in buildings with less than ten flats (in the Figure the label Flat_LT10), then semidetached houses, and then detached houses. Furthermore, flats tend to be smaller, followed by semidetached houses, and, finally, detached houses are usually the largest. The data can be also analyzed in terms of the urbanization degree (rural areas, towns and suburbs, and cities), but unfortunately Eurostat CDW is currently not disaggregated by the degree of urbanization. The building stock by type of dwelling differs significantly across the EU. In the UK and Ireland, detached and semidetached dwellings are the dominant type (above 80%), while in Spain flats represent more than 65% of all dwellings.
Figure 8. European Economic Area (EEA) distribution of population by dwelling type, 2016;
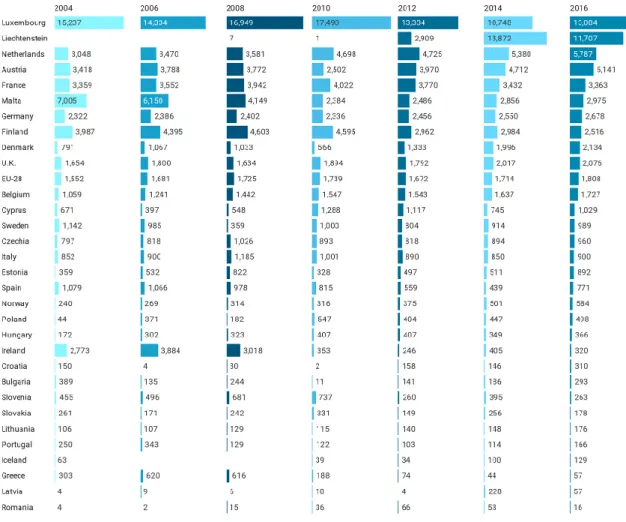
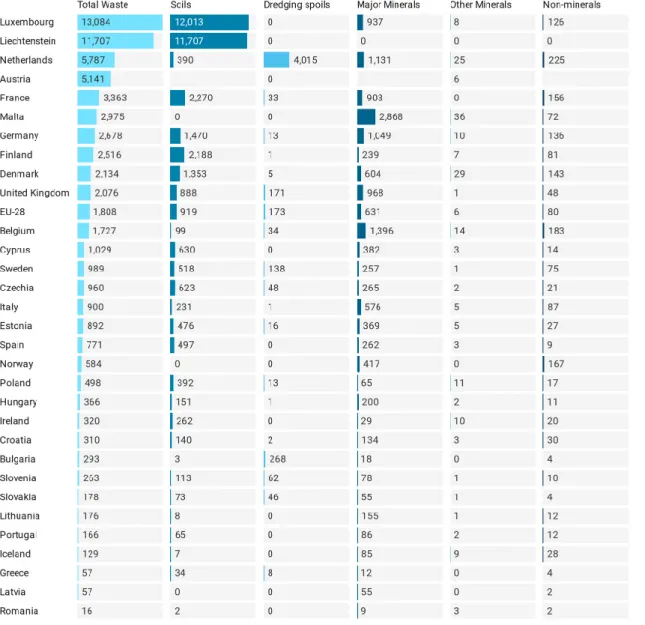
Figures 9 shows CDW (of the construction sector, NACE Rev. 2, Eurostat Statistical Classification of Economic Activities,code F) per capita for the period 2004–2016, whereas Figure 10 presents the breakdown of CDW per Capita in 2016 (source Eurostat data). The two figures are jointly analyzed, as most of the conclusions can be drawn from both, such as the fact that dredging soils motivate that the Netherlands has one of the highest figures of waste per capita. Austria’s breakdown is confidential, and some data has been estimated (France 2004, Belgium and Portugal 2004–2006, and Hungary 2004–2008). A significant percentage of this waste are soils (470 million tons in 2016, 51% of the construction waste; mainly in France, 32% of soils; Germany, 26% of soils; and in the UK, 12% of soils). Another highly relevant share is dredging spoils (88 million ton in 2016, 10% of construction waste; most of them in the Netherlands, 77% of dredging spoils, and the UK, 13% of dredging spoils). In addition to soils and dredging spoils, the most relevant EWC-STAT categories in construction is “Mineral waste from construction and demolition” (e.g., concrete, bricks and gypsum waste), accounting for 322 million tons in 2016 (35% of total construction waste), and the remaining categories of primary waste fall into “Waste excluding major mineral wastes” (e.g., wood and plastics), 41 million tons in 2016. Secondary waste (waste resulting from the treatment of waste) is 2.5 million tons.
Figures 9 and 10 present data in kg per capita to ease the comparison among different countries, being ordered by decreasing amount of waste in 2016. Some data is missing, and other data might not fully reflect the real situation, as data quality is quite diverse across countries. In fact, there is a wide range in the CDW per capita. The reasons behind this variation cannot be ascertained until data is collected in a consistent and robust way, in addition to being split into construction types (e.g., residential, commercial, infrastructure), and the activities of new build, demolition and refurbishment.
Figure 9. Generation of waste in kilograms per capita in the EEA in the period 2004–2016. (Source
Figure 10. Breakdown of CDW by waste category in kilograms per capita in the EEA in 2016. (Source
Eurostat CEI_WM040 dataset).
Figure 11 shows the Mineral CDW per capita (CDWPC indicator) in the period 2010–2016, ranked in increasing order (reference year 2016) to show the least generating EEA MS first. A potential metric of sustainability could be the least CDWPC, although this should be analyzed jointly with the construction GVA. For instance, Iceland and Portugal have similar values, 85 and 86 kg per capita, respectively. However, Iceland has 5.6 more construction GVA per capita than Portugal (Section 4.2 presents national construction GVAs). Thus, Iceland can keep waste as low as Portugal with a stronger construction sector. Another example is the comparison of France and the UK, with similar population and GVA, France has 886 kg CDW per capita whereas the UK 961 kg (+8%). However, the construction GVA is 22% higher in the UK, so it can be considered that the UK has a more sustainable construction sector. Additionally, Germany and the UK have similar values of sector GVA and CDWPC, so Germany, with over a 24% higher population than the UK, is producing 24% more CDW than the UK.
From this figure, it can be derived that CDWPCs show significant differences throughout EEA, motivated by multiple factors. Thus, the Netherlands has 11366% more CDWPC than Romania, with a similar population (Netherlands 17.3 million inhabitants and Romania 19.4 million inhabitants) and this increase is neither explained by construction GVA (it is approximately 200% higher in the
Netherlands than in Romania) nor by the building average age (both countries have around 45–46 years ABA).
Figure 11. Mineral CDW per capita (CDWPC) in the period 2010–2016, ranked in increasing order
(reference 2016) to show the least generating EEA Member State (MS) first. (Source Eurostat CEI_WM040 dataset).
In fact, Romania has most (37%) of its buildings (see Figure 7) built in the period 1945–1969, and there is a significant percentage of flats in buildings with equal or more than ten dwellings, like most countries in Eastern Europe (see Figure 8). Furthermore, there is half the new buildings compared to the Netherlands. Additionally, the average area of flats in Romania is 40–50 square meters, among the smallest in EEA (see Appendix A, EU Building Database), whereas in the Netherlands dwellings are approximately twice this area. To sum up, there is a factor of × 3 (GVA) × 5 (refurbishment vs. new dwellings; own estimate only for illustrative purposes) × 2 (dwellings area), a factor of potentially 30 times more CDW generation. This factor does not explain the factor of 114 shown in the numbers. The main reason that may explain this gap between Romania and the Netherlands figures is that the quality of the data is poor for Romania and good for the Netherlands.
According to [1,20], this is the classification (in alphabetical order within each category) of the EU28 MS according to CDW data quality:
Good Quality: Austria, Czech Republic, Denmark, Germany, the Netherlands, Poland, Portugal,
Slovakia, Slovenia;
Modest Quality: Belgium, Croatia, Estonia, France, Italy, Lithuania, Luxembourg, Spain, the UK; Poor Quality: Bulgaria, Cyprus, Finland, Greece, Ireland, Latvia, Malta, Romania, Sweden.
Bearing in mind this classification, it is worth noting that the nine EU28 MS with poor data quality are found either among the lowest CDWPC (the five MS with the lowest CDWPC, in increasing order: Romania, Greece, Bulgaria, Ireland and Latvia) or the MS with the highest CDWPC (Malta). It is likely that the lowest values of CDWPC are influenced by the lack of registration of a relevant share of CDW.
Further to the previous analysis, it is especially relevant to analyze the non-recovered CDW in terms of kg per capita. Figure 12 shows the data where a country generating more CDW but with a higher recovery rate is able to report very low values of non-recovered CDWPC, even 0 for those EEA MS reporting 100% CDWRR. This is the case of Malta, with the highest CDWPC but among the lowest non-recovered CDWPC. However, as it has been previously discussed, these results might be largely influenced by poor data quality.
Figure 12. Non-recovered Mineral CDW per capita in the period 2010–2016. (Source Eurostat
Eurostat publishes the recovery rate of construction and demolition waste, Code: CEI_WM040, biennially, with data from 2010, 2012, 2014 and 2016 (see Appendix A). The indicator is the ratio of construction and demolition waste, which is prepared for reuse, recycled or subject to material recovery, including through backfilling operations, divided by the construction and demolition waste treated as defined in Regulation (EC) No. 2150/2002 on waste statistics. The indicator covers the waste category “Mineral waste from construction and demolition” (EWC-Stat 12.1). Only non-hazardous waste is considered. Figure 13 presents the evolution of this indicator in the period 2010–2016.
Figure 13. The evolution of CDW recovery rate (CDWRR) indicator in the EEA (based Eurostat
CEI_WM040 dataset).
The indicator recovery rate includes backfilling. An indicator excluding backfilling would be a recycling rate. Backfilling is lower in the waste hierarchy than recycling, but currently there is no harmonized application of the definition of backfilling in the Waste Framework Directive, so the dividing line between recycling and backfilling differs among EU member states.
Figures of the remaining candidate indicators have not been included for simplicity reasons, as their relationship with CDW management turned out to be less direct than the data previously depicted in this section. These indicators are Dwellings per Thousand Capita (DPTC), and its derived Occupied Dwellings per Thousand Capita (ODPTC) and Dwelling Occupancy Ratio (DOR), figures derived from publicly available data from the EU Census 2011 (Appendix A).
4.2. Assessing the Sustainability and Efficiency of EEA MS CDW Management Using DEA
The DEA efficiencies of the sustainability and efficiency models using EEA CDW data have been computed using the solver software that comes with the reference DEA book by Cooper [13]. To be able to run the DEA, no missing values (or 0) are allowed, so in these scenarios either the latest available data was used (e.g., CDWRR for Germany, using the latest non confidential value of 2012) or it was estimated (e.g., 2016 Austria Mineral CDW, claimed to be confidential, was estimated by subtracting the Mineral CDW of the remaining 27 EU28 MS from the overall EU28 Mineral CDW aggregate).
Table 2 presents the results of the computed sustainability DEA model, showing the 30 EEA MS in descending order of CDWRR. Five EEA MS are considered efficient according to the proposed sustainability model: Iceland, Poland, Romania, Spain, and Sweden. In addition, the EU28 aggregated data is also considered efficient. Three more countries, Luxembourg, the Netherlands, and Ireland score very high, 0.999 or more. They are not efficient according to this model, but they are less than 0.1% from efficiency. Despite the fact that these three MS are among the first half of the table; the truth is that only one out of five MS considered efficient are in the first half of a table ranked by CDWRR. This means that CDWRR does not correlate well with the scores of this model, even being one of the outputs; in fact, three of the efficient MS have CDWRR below 85%.
Table 2. Results of construction sustainability DEA model for 30 EEA MS, in descending order of
CDWRR. Units of NHMCDW are million tons, of SGVA M€, and percentages for CDWRR. NHMCDW stands for Non-Hazardous Mineral CDW, SGVA stands for Sector (Construction) Gross Value Added. Input parameters are identified with (I) and Output with (O).
No. EEA MS Score Rank NHMCDW (I)
(M tons) Efficient NHMCDW SGVA (O) (M €) CDWRR (O) (%) 1 Luxembourg 0.9996 8 0.482 −0.04% 2745 100 2 Malta 0.369 18 1.306 −63.1% 326 100 3 The Netherlands 0.999 9 17.571 −0.1% 28,188 100 4 Hungary 0.199 25 1.957 −80.1% 3509 99 5 Iceland 1 1 0.028 0.0% 1139 99 6 Italy 0.791 11 34.804 −20.9% 65,599 98 7 Latvia 0.273 21 0.107 −72.7% 1187 98 8 Slovenia 0.245 22 0.161 −75.5% 1816 98 9 Estonia 0.062 31 0.485 −93.8% 1229 97 10 Lithuania 0.106 28 0.446 −89.4% 2335 97 11 Portugal 0.510 16 0.888 −49.0% 6523 97 12 Ireland 0.9999 7 0.135 0% 5944 96 13 United Kingdom 0.892 10 63.047 −10.8% 132,133 96 14 Belgium 0.218 24 15.769 −78.2% 19,869 95 15 Germany 0.673 13 80.968 −32.7% 132,544 94 16 Czech Republic 0.107 27 2.742 −89.3% 8694 92 17 Poland 1 1 2.436 0% 26,259 91 18 Bulgaria 0.277 20 0.131 −72.3% 1642 90 19 Denmark 0.234 23 3.358 −76.6% 13,380 90 20 EU28 1 1 312.890 0% 703,005 89 21 Austria 0.158 26 9.768 −84.2% 19,954 88 22 Greece 0.563 15 0.126 −43.7% 3845 88 23 Finland 0.486 17 1.267 −51.4% 13,120 87 24 Romania 1 1 0.173 0% 10,300 85
25 Spain 1 1 12.117 0% 59,374 79 26 Croatia 0.074 30 0.554 −92.6% 1926 76 27 France 0.592 14 59.102 −40.8% 108,362 71 28 Norway 0.681 12 2.168 −31.9% 19,610 71 29 Sweden 1 1 2.368 0% 25,980 61 30 Cyprus 0.088 29 0.325 −91.2% 750 57 31 Slovakia 0.333 19 0.297 −66.7% 5602 54
Looking at the score column, these range from Estonia (see No. 5), the most inefficient (0.062) to full efficiency (1). Estonia and Iceland (No. 5, one of the efficient MS) have a similar SGVA, but Estonia is producing 17 times more NHMCDW. Because of this distance to an efficient MS, Estonia is penalized, having 16 times less efficiency (it is not 17 times less efficient because there is a slight difference in SGVA and CDWRR). It is worth noticing that there is a direct relationship between efficiency and input efficient value projection when there is a single input. Thus, Estonia has an efficiency score of 0.062 and its efficient NHMCDW projection would be −93.8% lower. Its NHMCDW is 0.485 million tons, while to be efficient it should be 0.030. Its efficiency score is 0.062, which is the efficiency score 1 min 0.938 (−93.8%).
The EU28 has been included to measure the efficiency of the aggregated 28 MS, and the result is that the EU28, globally, is efficient. This is due to the use of VRS, otherwise it would be difficult for an aggregate to be considered efficient as it is composed of both efficient and inefficient elements.
Table 3 presents the results of the DEA model of the efficiency of CDW recovery, showing the 30 EEA MS in descending order of CDWRR.
Table 3. Results of efficiency DEA model for CDW recovery using 2016 data. The 30 EEA MS are
presented in descending order of CDWRR. Units of NHMCDW (recovered) are million tons and percentages for CDWRR. NHMCDW stands for Non-Hazardous Mineral CDW. NHMCDW is an input (I) parameter and NHMCDW recovered is an output (O) parameter.
No. EEA MS Score Rank NHMCDW
(I) NHMCDW Recovered (O) Distance to Efficiency CDWRR (%) 1 Luxembourg 1 1 0.482 0.482 0% 100 2 Malta 1 1 1.306 1.306 0% 100 3 The Netherlands 1 1 17.571 17.571 0% 100 4 Hungary 0.990 9 1.957 1.938 0% 99 5 Iceland 1 1 0.028 0.028 0% 99 6 Italy 1 1 34.804 34.108 0% 98 7 Latvia 0.982 10 0.107 0.105 +1.8% 98 8 Slovenia 0.981 11 0.161 0.158 +1.9% 98 9 Estonia 0.970 12 0.485 0.470 +3.1% 97 10 Lithuania 0.970 12 0.446 0.432 +3.1% 97 11 Portugal 0.970 12 0.888 0.861 +3.1% 97 12 Ireland 0.962 15 0.135 0.130 +4.0% 96 13 United Kingdom 1 1 63.047 60.525 0% 96 14 Belgium 0.950 16 15.769 14.981 +5.3% 95 15 Germany 0.999 8 80.968 76.110 +0.1% 94(*) 16 Czech Republic 0.920 17 2.742 2.522 +8.7% 92 17 Poland 0.910 18 2.436 2.217 +9.9% 91 18 Bulgaria 0.902 19 0.131 0.118 +10.9% 90
19 Denmark 0.900 20 3.358 3.022 +11.1% 90 20 EU28 1 1 312.890 278.472 0% 89 21 Austria 0.880 22 9.768 8.596 +13.6% 88 22 Greece 0.882 21 0.126 0.111 +13.4% 88 23 Finland 0.870 23 1.267 1.103 +14.9% 87 24 Romania 0.851 24 0.173 0.147 +17.5% 85 25 Spain 0.790 25 12.117 9.572 +26.6% 79 26 Croatia 0.760 26 0.554 0.421 +31.6% 76 27 France 0.738 27 59.102 41.962 +35.4% 71 28 Norway 0.710 28 2.168 1.539 +40.8% 71 29 Sweden 0.610 29 2.368 1.445 +63.9% 61 30 Cyprus 0.570 30 0.325 0.185 +75.4% 57 31 Slovakia 0.540 31 0.297 0.160 +85.1% 54
(*) Estimated using the most recent available data, of 2012.
Table 3 has only one input, Non-Hazardous Mineral CDW (NHMCDW), and one output, NHMCDW recovered. The model has varying returns of scale, VRS, and it is output-oriented. The target is to increase the recovered material, which is bounded by NHMCDW (a recovery of more than 100% is not possible). The efficiency scores are very similar to CDWRR (this indicator is not used in this model, but it is included in Table 3 for comparative purposes). It is worth noticing that the CDWRR and efficiency scores are directly related, expect for the three largest economies, the UK, Germany and for EU28 globally.
Six EEA MS are considered efficient according to the proposed efficiency model, Luxembourg, Malta, Netherlands, Iceland, Italy, and the UK. The first three already had a CDWRR of 100%, whereas Iceland 99%, Italy 98% and the UK 96% were close. Finally, the EU28, with 89% CDWRR, is also considered efficient. Another two countries score equal or higher than 0.99: Hungary, 0.990 efficiency score and a CDWRR of 99%; and Germany, a 0.999 efficiency score with an estimated 94% CDWRR. The model presents decreasing returns to scale, in fact it considers the UK efficient, with a 96% CDWRR, or the EU28 with 89%.
4.3. Ranking Countries According to Efficiency Measures
Table 4 presents the ranking of the EEA MS according to their sustainability (S) plus their efficiency (E) score. Iceland scores the highest; it is the only EEA MS efficient both in sustainability and efficient CDW management. The following three MS, Luxembourg, the Netherlands, and Ireland are not 100% efficient; they have a small inefficiency that can be seen using four decimal positions.
Table 4. EEA MS ranking based on sustainability and efficiency scores. Data quality based on [1].
Position EEA MS Sustainability (S)
Score Efficiency (E) Score S+E Score Data Quality 1 Iceland 1 1 2.000 NA 2 Luxembourg 0.9996 1 1.9996 Modest 3 The Netherlands 0.9992 1 1.9992 Good 4 Ireland 0.9999 0.9615 1.9614 Poor 5 Poland 1 0.910 1.910 Good 6 United Kingdom 0.892 1 1.892 Modest 7 Romania 1 0.851 1.851 Poor 8 Italy 0.791 1 1.791 Modest 9 Spain 1 0.790 1.790 Modest 10 Germany 0.673 0.999 1.672 Good
11 Sweden 1 0.610 1.610 Poor 12 Portugal 0.510 0.970 1.480 Good 13 Greece 0.563 0.882 1.445 Poor 14 Norway 0.681 0.710 1.391 NA 15 Malta 0.369 1 1.369 Poor 16 Finland 0.486 0.870 1.356 Poor 17 France 0.592 0.738 1.330 Modest 18 Latvia 0.273 0.982 1.255 Poor 19 Slovenia 0.245 0.981 1.226 Good 20 Hungary 0.199 0.990 1.189 Modest 21 Bulgaria 0.277 0.902 1.179 Poor 22 Belgium 0.218 0.950 1.168 Modest 23 Denmark 0.234 0.900 1.134 Good 24 Lithuania 0.106 0.970 1.076 Modest 25 Austria 0.158 0.880 1.038 Good 26 Estonia 0.062 0.970 1.032 Modest
27 Czech Republic 0.107 0.920 1.027 Good
28 Slovakia 0.333 0.540 0.873 Good
29 Croatia 0.074 0.760 0.834 Modest
30 Cyprus 0.088 0.570 0.658 Poor
5. Discussion
The EU28 generated around 924 million tons of CDW in 2016, a 6% increase compared to the 870 million tons in 2014, the first relevant increase since the 864 million tons generated in 2008 followed by 6 years of stagnation motivated by the economic crisis. In the meantime, the recovery rate of the Mineral CDW, the most valuable and resource-demanding part, around 35% of CDW, raised from 70% (in 2010, the first historical record) to 89% (2016, at this time, the last record in the series). This is the highest rate across the main economies, as the CDW recycling rate is around 70% for the USA, and between 3–10% for China, with total amounts of 548 million tons and 2500 million tons of CDW, respectively [2].
Currently, there are two main actions to improve the sustainability of the construction sector: reducing the amount of CDW generated and increasing the CDW recovery rate. However, it is difficult to balance the two objectives, as reducing the amount of CDW might penalize the recovery rate due to reducing economies to scale. To cope with this challenge, this paper has proposed a methodology for analyzing the efficiency and sustainability of CDW management. This methodology has been validated with a case study, EEA MS, using both EDA and DEA to assess the sustainability and efficiency of EEA MS.
Figure 14 presents a European map depicted with the final S+E score proposed to evaluate the sustainability and CDW management efficiency, ranking from Iceland, Luxembourg, the Netherlands, Ireland, Poland and the UK in the first six positions (in descending order, Iceland being the most sustainable and efficient). Furthermore, the EEA MS in the last six positions are Austria, Estonia, Czech Republic, Slovakia, Croatia, and Cyprus (in descending order, Cyprus being the least sustainable and efficient).
Figure 14. Sustainability and efficiency (S+E) scores in Europe using the last available data (2016). Additionally, globally the EU28 has been evaluated, being efficient both for sustainability and efficiency; its S+E Score is 2.0. This is possible due to using VRS DEA models with decreasing returns to scale. However, it is true that most of EU28 population, 335 million inhabitants, or 66% of the total 510 million EU28 inhabitants, live in countries in the first ten positions (out of 30) of the ranking presented in Section 4.3.
A comparison of the EU28 against Iceland, the only country that also scores 2.0 in our indicator, shows that the EU28 has 11,175 times more NHMCDW than Iceland (312.890 vs. 0.028 million tons), whereas SGVA is 617 times higher (€703,005 million vs. €1139 million), and CDWRR is 99 for Iceland and 89 for the EU28. The EU28 is generating over 18 times more NHMCDW per SGVA unit, in constant returns to scale (CRS), which would be highly inefficient, but our model considers VRS. Far from having increasing returns to scale, CDW management in the EEA presents decreasing returns to scale, although this can be considered highly influenced by specific conditions that minimize CDW generation. In fact, Iceland might have little need for demolition, based on its low population density and an urbanism based, even in the capital city center, in detached and semidetached dwellings, and a relevant use of stone and wood as construction materials. Additionally, a significant part of Iceland construction materials is imported, with expensive and slow provisioning, which incentives CDW minimization.
In the related literature, we found excellent initiatives to rank the generation of CDW and the recovery rates of CDW. In [1], the use of the amount of CDW-TGC (CDW generated per construction turnover, GDP and capita) have shown that Austria, Germany, the Netherlands, Belgium, and France were found to be the highest CDW-TGC producers, whereas Croatia, Slovenia, Slovakia, Poland, Portugal, and Spain were found to be the lowest. Our methodology has shown that some high producers of CDW-TGC are more efficient than others.
However, the usage of DEA raises criticism, as it is highly influenced by outliers, and in an area like CDW, poor data quality might affect the efficiency scores. We agree that outliers, such as Iceland and its comparison against Estonia, might have penalized small economies in Europe, which have Iceland or Luxembourg and its 100% recovery rate, as a reference. Although full efficiency is difficult
to achieve when countries are considered outliers, it is a reference that proves that at small scale it is possible to excel in sustainability.
Another major drawback of DEA discussed in the related literature [24] is the fact that the accuracy of the results depends on the accuracy of the data being used. In fact, to increase the consistency of the methodology proposed by this paper, Eurostat CDW data might need to be further curated. The heterogeneity of the collection procedures discourages any analysis that goes further than EDA based on the proposed indicators.
Another drawback of DEA raised in [24] is the usage of relative references. To analyze this appraisal, we would like to compare CDWRR, an absolute indicator, and the candidate efficiency CDW recovery DEA model. CDWRR might not reflect the complexity that represents achieving a 100% of recovery rate of 80 million tons, which is the amount of NHMCDW in Germany. In fact, most countries with 97% or more in CDWRR deal with less than 1 million tons. So, the benefit of a relative reference is to ease the consideration to be efficient from the theoretical 100% recovery rate to a plausible percentage. In this case, as three EEA MS have a CDWRR of 100%, it is more difficult to achieve the full efficiency in a ratio. Further, regarding DEA models, there are different levels. In fact, a DEA CRS would be equal to CDWRR in this scenario since at least two countries have scored the maximum CDWRR, 100%. However, DEA VRS is a more powerful indicator than CDWRR as it takes into account the difficulties of reaching a 100% CDWRR in the largest EEA economies, and is adaptive; if an efficient peer improves, then other countries improving less than the efficient country will have their scores decrease, and, vice versa, if they improve more than the efficient country then their scores will rise. So, far from being a drawback, we consider that the use of relative references might help to pursue the operation efficiency in CDW management. In fact, the proposed CDW recovery efficiency model is an alternative to CDWRR, considering the effort of achieving a recovery rate across different amounts of Mineral CDW.
However, the disadvantages of DEA do not preclude that the proposed ranking is based at 100% in DEA models. In fact, the results of these models are straightforward to analyze, not requiring EDA, which is a tool oriented to the first data analytics stages when approaching complex datasets. Nevertheless, EDA would be useful in case of analyzing alternative rankings or varying parameter weights of the composite index S+E, not only 50% for both.
Finally, the ranking is intended to reflect the efforts that EEA MS make to both reduce CDW and recover the majority of CDW generated. When the target is an absolute indicator it might discourage further improvement or the indicator itself might be the target, discouraging the improvement of data quality. This is the case of CDWPC (see Figure 11), where low values might be considered more sustainable, but the five MS with the lowest values are considered to have low quality of data collection. Using a DEA these five countries are compared among them, ranking some as sustainable, despite the quality of the data, such as Romania and Ireland, and others with sustainability scores of 0.2–0.3, such as Latvia and Bulgaria. So, the impact of data tweaking can be potentially limited to countries using the same techniques to make progress in the indicators.
6. Conclusions
This paper has analyzed the efficiency and sustainability of CDW management across 30 EEA countries using both Exploratory Data Analysis and Data Envelopment Analysis. The main contributions of this work have been: (1) proposing 15 indicators for EDA of CDW management sustainability and efficiency; (2) proposing a methodology for characterizing sustainability and efficiency using DEA and two original CDW production models; (3) validating the methodology by analyzing 30 EEA countries; and (4) ranking them using DEA efficiency scores. The main conclusions of the paper are: (1) EDA has been demonstrated as a helpful tool for analyzing CDW efficiency and sustainability indicators; and (2) the heterogeneity of CDW management across EEA countries has been highlighted, making comparative analysis using EDA difficult. However, (3) the proposed DEA efficiency indicators have turned out to be a good alternative for comparing efficiency across countries, being able (4) to rank EEA countries according to their CDW management efficiencies by using the proposed methodology.
The introduced methodology is a proposal for replacing current indicators in order to evaluate the performance of CDW policy due to its adaptive nature, promoting continuous improvement and overcoming the limitations of poor-quality metrics, data and parametric indicators. Thus, EEA countries might rely on it to further measure and understand the efficiency of their CDW management, highlighting which countries might be their references and evaluating and encouraging the performance of their policies further than just meeting a goal, such as an indicator threshold (e.g., a 70% CDW recovery rate).
Author Contributions: This study is a joint work of the authors. All authors developed the Conceptualization;
Investigation G.L.T.; Supervision Á.P.; Writing–original draft, G.L.T.; Writing–review and editing, I.S., C.S. and Á.P. All authors have read and agreed to the published version of the manuscript.
Funding: This research was funded by the Ministry of Economy, Industry and Competitiveness of Spain, Project
TIN2016-75845-P (AEI/FEDER/EU) and SNEO-20161147 (CDTI) and by Xunta de Galicia and FEDER funds of the EU (Centro de Investigación de Galicia accreditation 2019–2022, ref. ED431G2019/01, and Consolidation Programme of Competitive Reference Groups, ref. ED431C 2017/04).
Conflicts of Interest: The authors declare no conflict of interest. The funders had no role in the design of the
study; in the collection, analyses, or interpretation of data; in the writing of the manuscript, or in the decision to publish the results.
Appendix A
The sources of data used in the study are openly available on:
- Eurostat website at: https://ec.europa.eu/eurostat/data/database, reference number: cei_wm040, env_wasgen Construction (class F under NACE Rev.2), ilc_lvho01
- European Statistical Census “EU 2011 Population and Housing Census”
https://ec.europa.eu/eurostat/web/population-and-housing-census/census-data/2011-census
- EU Buildings Database. Building Stock Characteristics
- https://ec.europa.eu/energy/eu-buildings-database_en
References
1. Villoria Sáez, P.; Osmani, M. A diagnosis of construction and demolition waste generation and recovery practice in the European Union. J. Clean. Prod. 2019, 241, 118400.
2. Aslam, M.S.; Huang, B.; Cui, L. Review of construction and demolition waste management in China and USA. J. Environ. Manag. 2020, 264, 110445.
3. Weil, M.; Jeske, U.; Schebek, L. Closed-loop recycling of construction and demolition waste in Germany in view of stricter environmental threshold values. Waste Manag. Res. 2006, 24, 197–206.
4. European Commission. Construction and Demolition Waste. Available online:
https://ec.europa.eu/environment/waste/construction_demolition.htm (accessed on 16 May 2020).
5. European Commission. EU Construction and Demolition Waste Protocol and Guidelines. Available online: https://ec.europa.eu/growth/content/eu-construction-and-demolition-waste-protocol-0_en (accessed on 16 May 2020).
6. European Commission. Eurostat Statistics Explained. Waste Statistics. 2019. Available online: https://ec.europa.eu/eurostat/statistics-explained/index.php/Waste_statistics (accessed on 16 May 2020). 7. European Commission. Circular Economy Action Plan. 2020. Available online:
https://ec.europa.eu/environment/circular-economy/ (accessed on 16 May 2020).
8. European Commission. First Circular Economy Action Plan. 2015. Available online: https://ec.europa.eu/environment/circular-economy/first_circular_economy_action_plan.html (accessed on 16 May 2020).
9. Munaro, M.R.; Tavares, S.F.; Bragança, L. Towards circular and more sustainable buildings: A systematic literature review on the circular economy in the built environment J. Clean. Prod. 2020, 260, 121134. 10. European Commission. Building Sustainability Performance—Level(s). Available online:
https://ec.europa.eu/environment/eussd/buildings.htm (accessed on 16 May 2020). 11. Tukey, J.W. Exploratory Data Analysis; Addison Wesley: Reading, MA, USA, 1977.
12. Charnes, A.; Cooper, W.W.; Rhodes, E. Measuring the efficiency of decision making units. Eur. J. Oper. Res.
1978, 2, 429–444.
13. Cooper, W.W.; Seiford, L.M.; Tone, K. Data Envelopment Analysis; Springer: New York, NY, USA, 1999. 14. Mália, M.; de Brito, J.; Pinheiro, M.D.; Bravo, M. Construction and demolition waste indicators. Waste
Manag Res. 2013, 31, 241–255.
15. Nuñez-Cacho, P.; Górecki, J.; Molina-Moreno, V.; Corpas-Iglesias, F.A. What gets measured, gets done: Development of a circular economy measurement scale for building industry. Sustainability 2018, 10, 2340. 16. Geng, Y.; Fu, J.; Sarkis, J.; Xue, B. Towards a national circular economy indicator system in China: An
evaluation and critical analysis. J. Clean. Prod. 2017, 23, 216–224.
17. Ghosh, A.; Nashaat, M.; Miller, J.; Quader, S.; Marston, C. A comprehensive review of tools for exploratory analysis of tabular industrial datasets. Visual Inform. 2018, 2, 235–253.
18. Velicer, W.F.; Jackson, D.N. Component Analysis versus Common Factor Analysis: Some issues in Selecting an Appropriate Procedure. Multivar. Behav. Res. 1990, 25, 1–28.
19. Ecke, H. Sequestration of metals in carbonated municipal solid waste incineration (MSWI) fly ash. J. Waste
Manag. 2003, 23, 631–640.
20. Kim, K.D.; Lee, E.J. Soil seed bank of the waste landfills in South Korea. Plant Soil 2005, 271, 109–121. 21. Deloitte. Study on Resource Efficient Use of Mixed Wastes, Improving Management of Construction and
Demolition Waste—Final Report. Prepared for the European Commission, DG ENV. 2017. Available online: https://ec.europa.eu/environment/waste/studies/pdf/CDW_Final_Report.pdf (accessed on 16 May 2020).
22. Halkos, G.; Petrou, K.N. Assessing 28 EU member states’ environmental efficiency in national waste generation with DEA. J. Clean. Prod. 2019, 208, 509–521.
23. Expósito, A.; Velasco, F. Municipal solid-waste recycling market and the European 2020 Horizon Strategy: A regional efficiency analysis in Spain, J. Clean. Prod. 2018, 172, 938–948.
24. Kucukvar, M.; Tatari, O. Eco-Efficiency of Construction Materials: Data Envelopment Analysis. J. Constr.
Eng. Manag. 2012, 138, 733–741.
25. Finnveden, G.; Moberg, Å. Environmental systems analysis tools—An overview. J. Clean. Prod. 2005, 13, 1165–1173.
26. Setac-Europe. Life-Cycle Assessment in Building and Construction: A State-of-the-Art Report; SETAC: Pensacola, FL, USA, 2003.
27. Buyle, M.; Braet, J.; Audenaert, A. Life cycle assessment in the construction sector: A review. Renew. Sustain.
Energy Rev. 2013, 26, 379–388.
28. Butera, S.; Christensen, T.H.; Astrup, T.F. Life cycle assessment of construction and demolition waste management. J. Waste Manag. 2015, 44, 196–205.
29. Fregonara, E.; Giordano, R.; Ferrando, D.G.; Pattono, S. Economic-environmental indicators to support investment decisions: A focus on the buildings’ end-of-life stage. Buildings 2017, 7, 65.
30. Tufféry, S. Data Mining and Statistics for Decision Making; Wiley: Chichester, UK, 2011; Volume 2.
31. Abdella, G.M.; Kucukvar, M.; Onat, N.C.; Al-Yafay, H.M.; Bulak, M.E. Sustainability assessment and modeling based on supervised machine learning techniques: The case for food consumption. J. Clean. Prod.
2020, 251, 119661.
32. Kristensen, H.S.; Mosgaard, M.A. A review of micro level indicators for a circular economy-moving away from the three dimensions of sustainability? J. Clean. Prod. 2020, 243, 118531.
33. Parchomenko, A.; Nelen, D.; Gillabel, J.; Rechberger, H. Measuring the circular economy—A Multiple Correspondence Analysis of 63 metrics. J. Clean. Prod. 2019, 210, 200–216.
34. Łozowicka, A. Evaluation of the Efficiency of Sustainable Development Policy Implementation in Selected EU Member States Using DEA. The Ecological Dimension. Sustainability 2020, 12, 435.
35. Sassanelli, C.; Rosa, P.; Rocca, R.; Terzi, S. Circular economy performance assessment methods: A systematic literature review. J. Clean. Prod. 2019, 229, 440–453.
36. Banker, R.D.; Charnes, A.; Cooper, W.W. Some models for estimating technical and scale inefficiencies in data envelopment analysis. Manag. Sci. 1984, 30, 1078–1092.
37. Fare, R.; Grosskopf, S. Modelling undesirable factors in efficiency evaluation: Comment. Eur. J. Oper. Res.
38. Seiford, L.M.; Zhu, J. Modeling undesirable factors in efficiency evaluation. Eur. J. Oper. Res. 2002, 142, 16– 20.
39. Mohd, S.A.; Khan, N.; Ramli, R.; Azizul Baten, M.D. Enhanced DEA model with undesirable output and interval data for rice growing farmers performance assessment. AIP Conf. Proc. 2015, 1691, 030016.
© 2020 by the authors. Licensee MDPI, Basel, Switzerland. This article is an open access article distributed under the terms and conditions of the Creative Commons Attribution (CC BY) license (http://creativecommons.org/licenses/by/4.0/).