M
ASTER OF
S
CIENCE IN
FINANCE
M
ASTERS
F
INAL
W
ORK
PROJECT
EQUITY RESEARCH
:
BP
PLC
GONÇALO
ANTUNES
MARQUES
M
ASTER OF
S
CIENCE IN
FINANCE
M
ASTERS
F
INAL
W
ORK
PROJECT
EQUITY RESEARCH
:
BP
PLC
GONÇALO
ANTUNES
MARQUES
S
UPERVISOR
:
VICTOR
MAURÍLIO
SILVA
BARROS
i
Abstract
This Master's Final Work consists of a valuation and consequent
recommendation of BP PLC stock, a multinational company listed in the London
Stock Exchange, operating in the Oil & Gas Industry.
This report has been developed in accordance with ISEG Master of Finance Final
Work standards and written based on the guidelines recommended by the CFA
Institute. The main motivation in the selection of the company results from BP
PLC being one of the largest players in the industry with a strong presence in the
Portuguese market. In addition, there has been a paradigm shift in the sector,
justified by the recent transition to a low carbon economy, where a large
development of alternative energy sources is foreseen, making the valuation very
challenging.
In order to develop this analysis and determine BP PLC price target at the end of
2020, three different methods were applied: the Discounted Cash Flow method;
the Discounted Dividend model and the Multiple Valuation model. The first
approach meets the reality of the company, taking into account the soundness of
its capital structure, the second derives from the stability in dividend payments
that BP PLC provides to its shareholders and, the latter proposes based in the
analysis of comparable companies in the sector.
Of the above approaches mentioned, the main focus was on the Discounted Cash
Flow method, resulting in a hold recommendation with a price target of GBP 5.985
per share, implying a potential appreciation of around 14% against August 30
th,
2019 closing price of GBP 5.002 per share. However, it is important to emphasize
the high risk inherent in this recommendation, particularly on the volatility that
commodity prices have experienced, which has caused constant uncertainty
among investors, as well as the possible Brexit effect.
The information and references used in the development of the report are limited
to information made available to the public as of August 31
st, 2019. Therefore,
any subsequent information or events were not taken into account.
JEL classification: G10; G32; G34
Keywords: Equity Research; Company Valuation; Discounted Cash Flows; BP
PLC; Oil & Gas Industry.
ii
Resumo
Este Trabalho Final de Mestrado consiste numa avaliação e consequente
recomendação da ação da BP PLC, empresa multinacional cotada na Bolsa de
valores de Londres (London Stock Exchange), que opera na Indústria de
Petróleo e Gás.
O presente relatório foi desenvolvido em conformidade com os padrões do
Trabalho Final de Mestrado em Finanças do ISEG e escrito tendo como base as
diretrizes recomendadas pelo CFA Institute. A principal motivação na seleção da
empresa resulta do facto da BP PLC ser um dos maiores players na indústria,
com forte presença no mercado português. Adicionalmente, tem-se assistido a
uma mudança de paradigma no setor, justificada pela recente transição para
uma economia de baixo carbono, onde se prevê um grande desenvolvimento de
fontes de energia alternativas, tornando a sua avaliação muito desafiante.
De modo a desenvolver esta análise e apurar o price target da BP PLC no final
do ano de 2020, foram aplicadas três metodologias: o Método dos Fluxos de
Caixa Descontados, o Modelo dos Dividendos Descontados e ainda a Avaliação
por Múltiplos. A primeira abordagem vai ao encontro da realidade da empresa,
tendo em consideração a solidez na sua estrutura de capital, o segundo modelo,
deriva da estabilidade no pagamento de dividendos que a BP PLC proporciona
aos seus acionistas e, o último assenta numa avaliação baseada na análise de
empresas comparáveis do setor.
Das abordagens mencionadas, foi dado especial enfase ao Método dos Fluxos
de Caixa Descontados, resultando numa recomendação para manter com um
price target de GBP 5.985 / ação, implicando um potencial de valorização na
casa dos 14% sobre a cotação de GBP 5.002 / ação a 30 de agosto de 2019. No
entanto, é fundamental alertar para o alto risco inerente a esta recomendação,
com especial foco na volatilidade que os preços das commodities têm registado,
o que tem provocado uma constante incerteza junto dos investidores, como
também no possível efeito Brexit.
As informações e referências utilizadas no desenvolvimento do relatório
cingem-se a informação pública disponibilizada à data de 31 de agosto de 2019. Desta
forma, qualquer informação ou eventos subsequentes não foram tidos em
consideração.
Classificação JEL: G10; G32; G34.
Palavras-Chave: Equity Research; Avaliação de Empresas; Fluxos de Caixa
Descontados; BP PLC; Indústria de Petróleo e Gás.
iii
Acknowledgements
Being this the last stage of my Master’s degree, I would like to leave a few words
of gratitude to several people who have always been present and made it
possible to successfully complete this project.
First of all, to Professor Victor Barros for his supervision and for always being
available giving important insights and guidance during this long journey.
Secondly, to my colleagues at ISEG, specially to António Calapez Correia, João
Duarte Pereira, Pedro Lourenço and Sérgio Sousa, for their companionship and
encouragement in the most difficult times.
Thirdly, to my girlfriend Ana Beatriz Silva, for always being by my side and for all
the patience she had at the worst times since the beginning of this stage.
Finally, to my family, especially my parents Maria da Conceição Marques and
Carlos Marques for their unconditional support and dedication during my entire
life, and to my godmother Sílvia Pacheco for all the support and motivation.
iv
Index
Abstract ... i
Resumo ... ii
Acknowledgements ... iii
Index ... iv
List of Figures ... vi
List of Tables ... vii
List of Appendices ... viii
Abbreviations ... ix
1. Research Snapshot ... 1
2. Business Description ... 2
3. Management and Corporate Governance... 4
4. Industry Overview and Competitive Positioning ... 6
5. Investment Summary ... 10
6. Valuation ... 12
7. Financial Analysis ... 14
8. Investment Risks ... 15
Appendices... 18
Appendix 1: Statement of Financial Position (BP PLC) ... 18
Appendix 2: Income Statement (BP PLC) ... 19
Appendix 3: Cash Flow Statement (BP PLC) ... 20
Appendix 4: Key Financial Ratios... 21
Appendix 5: Common-Size Statement of Financial Position (BP PLC) ... 22
Appendix 6: Common-Size Income Statement (BP PLC) ... 23
Appendix 7: Common-Size Cash Flow Statement (BP PLC) ... 24
Appendix 8: Macroeconomic and Industry Assumptions ... 25
Appendix 9: Income Statement Assumptions ... 25
Appendix 10: Statement of Financial Position Assumptions ... 26
Appendix 11: Upstream Segment Assumptions ... 27
Appendix 12: Downstream Segment Assumptions ... 28
Appendix 13: How Petroleum and Natural Gas were Formed ... 29
Appendix 14: Oil & Gas Industry Value Chain ... 29
Appendix 15: BP’s Governance Model ... 30
Appendix 16: BoD Remuneration ... 30
v
Appendix 18: Industry Life Cycle ... 31
Appendix 19: Industry Business Cycle ... 32
Appendix 20: Energy consumption – 2040 projections ... 32
Appendix 21: Evolution of electric vehicles – 2040 projections ... 33
Appendix 22: Key Drivers of Profitability ... 33
Appendix 23: Industry Peers ... 34
Appendix 24: SARD Approach ... 35
Appendix 25: OPEC Countries ... 35
Appendix 26: Discounted Cash Flow Assumptions ... 36
vi
List of Figures
Figure 1: BP Price Target ... 1
Figure 2: Hard Brexit impact on BP Price Target ... 1
Figure 3: BP worldwide presence ... 2
Figure 4: Revenues per segment ... 2
Figure 5: 2018 YE Employees per segment ... 2
Figure 6: Upstream segment Financials ... 3
Figure 7: Downstream segment Financials ... 3
Figure 8: Other Business and Corporate segment Financials ... 3
Figure 9:
BP’s Credit Profile ... 4
Figure 10:
Shareholder’s Structure ... 4
Figure 11:
Shareholder’s by Institution Type ... 4
Figure 12:
BP’s Governance Structure ... 5
Figure 13: World Real GDP (2010 Constant Prices) ... 5
Figure 14: World Total Population (billion people) ... 5
Figure 15: World Primary energy consumption. Forecast by source (GTOE) ... 6
Figure 16: World Crude Oil and NGL Production (MB/d) ... 6
Figure 17: Brent historical and forecasted Prices (USD/BBL) ... 6
Figure 18: U.S. Henry Hub historical and forecasted Prices (USD/BBL) ... 7
Figure 19: World Crude Oil Reserves (Trillions of Barrels) ... 7
Figure 20: Total CO2 emissions from fuel combustion (Mt of CO2) ... 7
Figure 21: Brent Price vs RoACE ... 8
Figure 22: Gross fixed investments ... 8
Figure 23: Worldwide Capacity and Utilization ... 8
Figure 24: Top 5 IOC M&A activity (#deals and $B) ... 9
Figure 25: Positioning Matrix ... 9
Figure 26:
Porter’s Five Forces ... 9
Figure 27:
BP’s SWOT Analysis ... 10
Figure 28: Brent Oil Price evolution vs Peers performance ... 11
Figure 29:
BP’s Dividends & Dividend Yield ... 11
Figure 30:
BP’s Enterprise Value (2020F) ... 12
Figure 31: Production & Realization by source... 12
Figure 32: BP Capital Expenditures ... 13
Figure 33:
BP PLC vs Peers’ Multiples ... 13
Figure 34: EBIT Margin and ROACE ... 14
Figure 35: Interest Coverage Ratio and Capital Structure ... 14
Figure 36: DuPont Analysis ... 14
Figure 37: Cash Ratio and Quick Ratio ... 15
Figure 38: Risk Matrix ... 15
Figure 39: World Energy Consumption vs World Real GDP growth ... 15
Figure 40: GBP / USD quote ... 16
Figure 41: BP PLC vs GBP / USD quote ... 16
Figure 42: Recommendation System ... 16
vii
List of Tables
Table 1: BP market data ... 1
Table 2: BP Financials Highlights ... 1
Table 3: BP Production (2018 YE) ... 2
Table 4:
BP’s Financial Framework ... 3
Table 5: Governance Metrics ... 4
Table 6:
BP’s Board members ... 5
Table 7: DCF Price Target ... 10
Table 8:
BP’s WACC ... 10
Table 9: DCF Price Target - SoP ... 11
Table 10: DCF Price Target - FCFE ... 12
Table 11: DDM Price Target ... 12
Table 12:
Peers’ Group ... 13
Table 13:
Peers’ Group Highlights ... 13
Table 14: Sensitivity analysis for the Average Brent vs GBP/USD ... 16
Table 15: Sensitivity analysis for the Risk-free rate vs Country Risk Premium 17
Table 16: Sensitivity analysis for the Terminal growth rate vs WACC ... 17
viii
List of Appendices
Appendix 1: Statement of Financial Position (BP PLC) ... 18
Appendix 2: Income Statement (BP PLC) ... 19
Appendix 3: Cash Flow Statement (BP PLC) ... 20
Appendix 4: Key Financial Ratios ... 21
Appendix 5: Common-Size Statement of Financial Position (BP PLC) ... 22
Appendix 6: Common-Size Income Statement (BP PLC) ... 23
Appendix 7: Common-Size Cash Flow Statement (BP PLC)... 24
Appendix 8: Macroeconomic and Industry Assumptions ... 25
Appendix 9: Income Statement Assumptions ... 25
Appendix 10: Statement of Financial Position Assumptions ... 26
Appendix 11: Upstream Segment Assumptions ... 27
Appendix 12: Downstream Segment Assumptions ... 28
Appendix 13: How Petroleum and Natural Gas were Formed ... 29
Appendix 14: Oil & Gas Industry Value Chain ... 29
Appendix 15: BP’s Governance Model ... 30
Appendix 16: BoD Remuneration ... 30
Appendix 17: BP’s Social Responsibility ... 31
Appendix 18: Industry Life Cycle ... 31
Appendix 19: Industry Business Cycle ... 32
Appendix 20: Energy consumption – 2040 projections ... 32
Appendix 21: Evolution of electric vehicles – 2040 projections ... 33
Appendix 22: Key Drivers of Profitability ... 33
Appendix 23: Industry Peers ... 34
Appendix 24: SARD Approach ... 35
Appendix 25: OPEC Countries ... 35
Appendix 26: Discounted Cash Flow Assumptions ... 36
ix
Abbreviations
ADSs –
American Depositary Shares
APO –
Anglo-Persian Oil company
BBLS –
Billions of barrels
BoD –
Board of Directors
boe/d –
Barrels of oil equivalent per day
BP –
BP PLC
CAGR –
Compound Annual Growth Rate
CAPEX –
Capital Expenditure
CAPM –
Capital Asset Pricing Model
CNBC –
Consumer News and Business Channel
CRP –
Country Risk Premium
D&A –
Depreciations and Amortizations
DCF –
Discounted Cash Flow
DDM –
Dividend Discount Model
DWS –
Downstream segment
EU –
European Union
F –
Forecasted
FCFE –
Free Cash Flow to the Equity
FCFF –
Free Cash Flow to the Firm
FPT –
Formulated products technology
GHG –
Greenhouse Gas
GIGS –
Global Industry Classification Standard
GTOE –
Gigatonne of Oil Equivalent
IOC –
Integrated Oil Companies
LNG –
Liquefied Natural Gas
mboe/d –
Million barrels of oil equivalent per day
mb/d –
Million barrels per day
M&A –
Mergers and Acquisitions
MRP –
Market Risk Premium
NOC –
National Oil Company
NYSE –
New York Stock Exchange
NGL –
Natural Gas Liquids
OBC –
Other Businesses and Corporate segment
OPEC –
Organization of the Petroleum Exporting Countries
p.p. –
Percentual point
PCT –
Petrochemical technology
R&D –
Research and Development
RFR –
Risk-Free Rate
ROS –
Rosneft segment
RTE –
Refining, technology and engineering
SARD –
Sum of Absolute Rank Differences
SoP –
Sum of Parts
SOT –
Standard Oil Trust
UPS –
Upstream segment
US – United States
USA – United States of America
WACC –
Weighted Average Cost of Capital
YE –
Year-End
1. Research Snapshot
BP PLC: Growing the Business and Energy Transition in an uncertainty Brexit Scenario
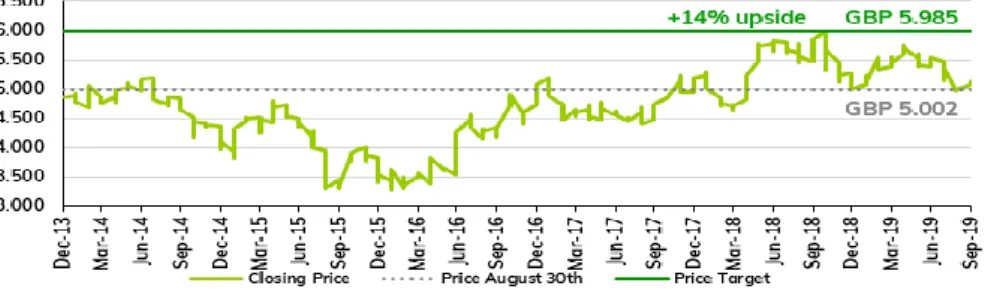
HOLD is our recommendation for BP PLC (BP) with a 2020YE price target of GBP 6.0/sh using a DCF model, implying a +14% upside potential from August 30th ,2019 closing price of GBP 5.0/sh, although with high-risk. As BP is an Integrated Oil and Gas company, in the face of an unpredictable and constantly changing market environment, BP can ensure sustainable growth by considering the diversification of its business portfolio and adopted strategies.
Growing advantaged oil and gas in the Upstream. BP has completed in October 2018 the $10.5 billion acquisition of BHP’s US assets. The deal will significantly upgrade BP’s US onshore oil and gas portfolio and help drive long-term growth. BP expects to achieve a gradual increase in its oil and gas production by around 190,000 barrels of oil equivalent per day (boe/d) by 2021. The company will benefit from discovered resources in the liquids-rich regions of the Permian and Eagle Ford basins in Texas and in the Haynesville natural gas basin in East Texas and Louisiana. Additionally, BP already started six major projects (Azerbaijan, Australia, Egypt, UK North Sea, Russia and US Gulf of Mexico), making a significant contribution of more 900,000 boe/d of expected new production between 2016 and 2021.
Expanding growth in the Downstream. BP has invested in the expansion of its global retail network and is expected to grow by 0.50% CAGR 2019F-23F. In 2018, BP opened more than 220 retail sites in Germany, increasing to about 1,400 convenience partnership sites. Following the same strategy, BP intends to grow its network in new markets and has increased to around 440 BP-branded retail sites in Mexico and opened its first sites in Indonesia, with the future objective of growing in China. The electrification of cars appears to be a small threat to this strategy.
Looking forward to growth in electric vehicles. The use of electric vehicles is a new trend. By 2040, there could be around 350 million circulating around the world. BP has more than 6,500 charging points across the UK, due to its acquisition (2018) of the UK’s largest charging network, forming BP Chargemaster. Additionally, BP has already invested $5 million in FreeWire, a US manufacturer of mobile rapid charging systems for electric vehicles, to respond to the demand for charging facilities, and $20 million in StoreDot, Israeli company that develops ultra-fast charging battery technology for mobile and industrial markets. Brexit is (all) about exchange risk. In a Hard Brexit scenario, it is expected a depreciation of GB Pound against US Dollar, resulting in the loss of purchasing power by UK-based citizens and companies. However, BP has the USD as the functional currency and most costs and nearly all sales are incurred in USD. Such events should result in modest adverse impact on the BP’s operating margins. Our grey sky scenario points to a loss around 3% in EBIT Margin and a revision in our price target to GBP 4.0/sh. A soft Brexit may, in turn, leverage BP’s positioning worldwide and diversification of currency risk to a higher price target (Figure 2). Gonçalo Marques ([email protected])
Master in Finance
BP PLC
Oil & Gas Refining
London Stock Exchange
August 2019, PortugalBP PLC
Date: August 2019 Ticker: BP/ LN (Bloomberg) Current Price: GBP 5.002 GBP 1.000: USD 1.23Recommendation: HOLD (14% Upside) Price Target: GBP 5.985 (USD 6.88) High-Risk
Figure 1: BP Price Target
Source: Author’s estimates (GB Pounds)
Figure 2: Hard Brexit impact on BP Price Target
Source: Author’s estimates and analyses (GB
Pounds)
Source: Bloomberg data and Author’s estimates
Table 2: BP Financials Highlights
Source: BP and Author’s estimates
Table 1: BP market data
2
2. Business Description
BP PLC (BP, Bloomberg: BP/ LN), incorporated on April 14, 1909, is a British multinational integrated Oil and Gas company, which holds interest in OJSC Oil Company Rosneft. The company explores for and produces oil and natural gas, refines, markets, and supplies petroleum products, generates solar energy, and manufactures and sells chemicals. Its segments include Upstream, Downstream, Rosneft and Other Businesses and Corporate. BP is one of the largest oil and gas producer in the world and a top refiner. It is also a major producer of petrochemicals.
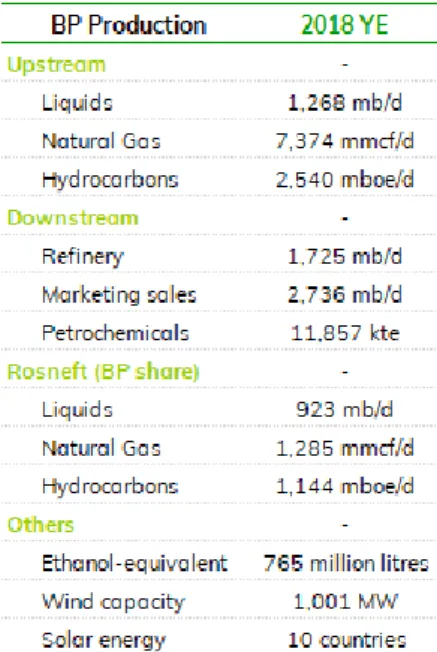
The company supplies fuel and related convenience services to consumers in more or less 18,700 BP-branded retail sites worldwide, and operates in 78 countries, with presence in Europe, North and South America, Australasia, Asia and Africa (Figure 3). By 2018YE, BP had a working force of 73,000 employees (Figure 5), reaching $298,756M of Revenues (Figure 4) and $49,319M of EBITDA, corresponding to a 16.51% EBITDA Margin.
In 1882, Amoco emerged in the US from Standard Oil Trust (SOT), American oil producing, transporting, refining and marketing company and monopoly. Later, in 1911, SOT was broken up into 34 independent oil companies, and, in 1985, one of them became Amoco.
In 1901, the future Anglo-Persian oil company (APO) began oil exploration and was incorporated on April 14, 1909. In 1914, the British government took a 51% of APO. APO, in 1954, started to use the British Petroleum name. From that moment, BP began its strategy of strategic mergers and acquisitions with companies of the same sector. In 1996, BP and Mobil merged, and the British government sold its stake in BP. Two years later, BP merged with Amoco in a $52 billion deal that formed BP Amoco. In 2000, BP Amoco bought ARCO and Burmah Castrol, adopting BP as its main worldwide name. With the objective of expanding its activity at a global level, BP acquired a $1 billion stake in Rosneft (19.75%), the largest oil company in Russia. In 2007, BP announced a new Alternative Energy unit and in 2010, BP acquired Devon Energy’s (emerging in Brazil). In the same year, BP reported a $4.9 billion loss as a result of the Gulf oil spill.
Upstream. BP’s upstream segment (UPS) generated 9% of 2018YE revenues with a profit of $14,550M. UPS include the activities of exploration of oil and natural gas (including Liquefied Natural Gas (LNG) and Natural Gas Liquids (NGL)), development, production, midstream transportation, storage and processing. In 2018, BP’s activities took place in 33 countries with new exploration access of 63,000km2 and upstream plant reliability of 95.7%.
UPS uses technology based on seismic imaging, enhanced oil recovery (industry average of 35%), wells and facilities using partnering with industry experts and digital upstream (big data technology). Assets are located onshore and offshore and include wells, gathering centers, in-field flow lines, processing facilities, storage facilities, offshore platforms, export systems, pipelines and LNG plant facilities.
UPS strategies are enabled by quality execution, grow oil and gas production and reduce gas emissions, returns-led growth (improve operational efficiency) and new projects by 2021 (35% higher operating cash margins).
Downstream. BP’s downstream segment (DWS) generated 90% of 2018YE revenues with a profit of $7,561M (75% in Fuels, 17% in Lubricants and 8% in Petrochemicals). DWS include the activities of refining, manufacturing, marketing, transportation, and supply and trading of crude oil, petroleum and petrochemicals products. The Company sells refined petroleum products, including gasoline, diesel and aviation fuel. In 2018, DWS comprised 1,400 convenience partnership sites, 94.9% of refining availability and 91% of refinery utilization rate.
BP develops and applies technologies that enhance operational integrity, boost conversion efficiency and reduce emissions. DWS uses three different technology programs according to its activity, more specifically refining, technology and engineering (RTE), formulated products technology (FPT) and petrochemical technology (PCT).
DWS strategies are enabled by safe and reliable operations, advantaged manufacturing (improve competitively advantaged), profitable marketing growth, simplification and efficiency and transition to lower carbon and digitally-enabled future.
Rosneft. BP’s Rosneft segment (ROS) generated 1% of 2018YE revenues with a profit of $2,316M. ROS serves as a resource base of hydrocarbons onshore and offshore. Rosneft is the largest oil company in Russia and the largest publicly traded oil company in the world
Source: Company data
Table 3: BP Production (2018 YE) Figure 3: BP worldwide presence
Source: Company data
Figure 5: 2018 YE Employees per segment
Source: Author’s estimates
Figure 4: 2018YE Revenues per segment
3
(listed on the MICEX stock exchange in Moscow), based on hydrocarbon production volume, with assets in all Russia’s key hydrocarbon regions.
ROS results from the 19.75% shareholding in Rosneft with two directors on the 11-person board and allows BP to benefit from a diversified set of existing and potential projects in the Russia oil and gas sector. Russia has one of the largest and lowest-cost hydrocarbon resource bases in the world and its resources play an important role in long-term energy supply to the global economy.
ROS strategies are enabled by increase total shareholder return and partner with in building a material business outside of the shareholding, participation in the Rosneft Board of Directors, develop and apply technology to improve oil and gas field and refining performing in collaboration with Rosneft, partner with Rosneft to generate incremental value from joint ventures that are separate from BP’s core shareholding and collaborate on the provision of technical, HSE (Health, Safety and Environment) and non-technical services on a contractual basis to improve asset performance.
Other Businesses and Corporate. BP’s Other Businesses and Corporate segment (OBC) generated a negative impact on less than 1% of 2018YE results with a loss of $1,558M. OBC comprises BP Alternative Energy (biofuels, biopower, wind energy and solar energy), shipping, treasury and corporate activities, including centralized functions and the costs of the Gulf of Mexico oil spill.
BP’s strategies on alternative energy are concentrating their efforts in Brazil (one of the most cost-competitive biofuel sources), increase production of biopower by burning bagasse (low carbon power source), continue to optimize BP business of wind energy by seeking out technological advancements and finding ways to deliver power more efficiently and expand its global presence of solar energy by BP’s partner with Lightsource, global market leader in the development, acquisition and long-term management of international large-scale solar projects and smart energy solutions (43% share).
Key Drivers of Profitability. The moment of uncertainty in the global economy has a direct influence on Energy demand and supply. This is implied by the dispute between the major economic powers, such as the influence that OPEC quotas have on the industry.
As a result, BP’s performance is highly impacted by fluctuations in commodity prices, directly affecting realization as well as company margins. Regarding production levels, BP faces a constant challenge in finding new oil wells and rehabilitating existing ones. BP has invested in partnerships and the acquisition of onshore and offshore assets, as well as divesting non-core businesses. These have enabled the maintenance and consequent increase in the company’s production levels, following the behaviour of its peers (Table 3).
Company’s Strategies.
• Growing gas and oil in the Upstream: BP intends to invest more in oil and gas, producing both with increasing efficiency. BP has 4 key factors to follow:
o Transforming the US onshore: Purchased assets from BHP in a deal of $10.5 billion, giving access to some of the best basins in the onshore US;
o Collaborative partnerships: BP signed a new production-sharing agreement with SOCAR, Azerbaijan’s state oil and gas company, and formed a strategic alliance with Petrobras to explore joint projects in upstream, downstream, trading and low carbon in Brazil;
o Project approvals: Development of projects in Oman, UK North Sea, Trinidad, India, Angola, Gulf of Mexico, Mauritania and Senegal;
o Major projects start-ups: BP started up six major projects, making a significant contribution of 900,000 boe/d of expected new production until 2021.
• Market-led growth in the Downstream: BP intends to innovate with advanced products and strategic partnerships. BP has 4 key factors to follow:
o Convenience partnerships: Opened more than 220 sites in Germany, taking the total number of convenience partnership sites to around 1,400 across BP global retail network;
o Growing retail in new markets: Expanded BP network to 440 BP-branded sites in Mexico and opened the first site in Indonesia;
o Sustainable aviation fuel: Entered into an innovative collaboration between Air BP and Neste, a leading renewable products producer, to secure and promote the supply of sustainable aviation fuel;
o Strong brands and partnerships: Strengthened BP lubricants and fuels partnership
with Renault Sport Racing.
Figure 6: Upstream segment Financials
Source: Author’s estimates
Figure 7: Downstream segment Financials
Source: Author’s estimates
Figure 8: Other Business and Corporate
segment Financials
Source: Author’s estimates
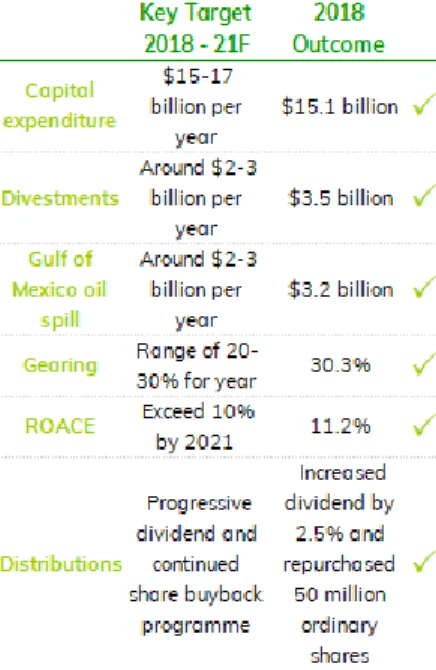
Table 4: BP’s Financial Framework
4
• Venturing and low carbon across multiple fronts: BP intends to pursue new opportunities to meet evolving technology, consumer and policy trends. BP has 4 key factors to follow:
o Harnessing battery power: Investments in electric vehicle technology and
infrastructure;
o Advancing solar: Expand its global presence of solar energy by BP’s partner with Lightsource;
o Turning waste to fuel: Licensed technology, developed by BP and Johnson Matthey
for use at their planned US commercial-scale waste-to-fuels plant;
o Cleaner power: Working with the Oil and Gas Climate Initiative to use natural gas to generate power.
• Modernizing the whole group: BP intends to simplify their processes and enhance their productivity through digital solutions. BP has 4 key factors to follow:
o Using wearable technologies: Use smart glasses to help increase safety and efficiency at BP’s operations;
o Cloud-based technologies: Reduce the time it could take engineers to diagnose a problem from hours to minutes;
o Intelligent operations: APEX technology across all upstream BP-operated assets to help identify efficiency improvements;
o Process automation: Using robotic process automation to help to optimize business processes, drive productivity and improve customer satisfaction.
Shareholder Structure. BP presents a diversified Shareholder´s Structure with 20,102.5 million of shares outstanding. BP’s largest shareholder is BlackRock, Inc, an American global investment management corporation, with a 10,26% ownership position. Vanguard Group, Inc, an American registered investment advisory, is the second-largest shareholder with 4,39%. The third-largest with only 2,59% ownership is Legal & General Group PLC, a British multinational financial services company (Figure 10).
BP’s main shareholders are Investment Advisors who hold Oil & Gas Exploration & Production ETF’s. Accordingly, they are considering passive investments, having no direct intervention in BP management (Figure 11).
BP ordinary shares are traded publicly on the London Stock Exchange and the Frankfurt Stock Exchange. BP American Depositary Shares (ADSs) trade publicly on the New York Stock Exchange (NYSE) and one BP ADS represents ownership rights in six BP ordinary shares.
3. Management and Corporate Governance
Mr. Helge Lund was elected BP’s Chairman of the Board on January 1st, 2019, succeeding Mr. Carl-Henric Svanberg. He joined the Board in July 2018 and he has a wide background with 10 years of experience with BG Group as President & CEO and executive positions on Aker Kvaerner, Aker RGI and Hfslund Nycomed. Mr. Bob Dudley joined Amoco Corporation in 1979 and became general manager strategy in 1999. Currently, he is BP’s CEO since October 1st, 2010. In March 2013, he was appointed as director of Rosneft and since 2016, he has chaired the OGCI. Mr. Brian Gilvary is the CFO since January 1st, 2012. He joined BP in 1986 after obtaining a PhD in mathematics. Thought his career he was director of TNK-BP and served on the HM-Treasury Financial Management Review Board (Table 6).
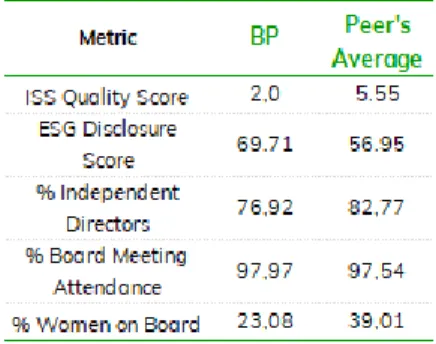
Board Structure and Attendance. There are 14 seats on the Board of Directors with 76.9% independent, above of both the generally accepted standard of 66% (Wall Street Journal) and 72% (Standard & Poor’s). However, it is below the peer average of 82.8%. BP’s ISS Quality Score is 2, putting the company above its peers with an average of 5.5 (Table 5). ISS analyses over 200 factors, divided into four pillars (board structure, compensation/remuneration, shareholder rights, and audit & risk oversight). It has a scale of 1 to 10, where 1 indicates relatively higher quality governance practices. The key factors that contribute to BP’s score include board meeting attendance of 98%, considerably high, being at the level of peer’s average of 98% too. Also, BP’s remuneration policy that is based on 4 pillars (simplification, reduced package versus previous policy, link to strategy and stewardship) and subdivided into 3 distinct categories (Executive Directors, Non-executive Chairman and Non-executive Directors).
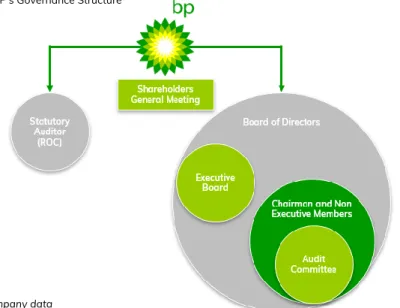
Corporate Governance. BP follows the Anglo-Saxon corporate governance model (Figure 12)
where shareholders in attendance at the General Meeting elect all directors each year: Source: Bloomberg data and Author’s estimate
Table 5: Governance Metrics
Figure 11: Shareholder’s by Institution Type
Source: Bloomberg data and Author’s
estimates
Figure 9: BP’s Credit Profile
Source: Bloomberg data
Figure 10: Shareholder’s Structure
Source: Bloomberg data and Author’s
5
• Board of Directors – responsible for monitoring BP’s performance, identify the principal risks and uncertainties and control them, Board and executive management succession.
• Audit Committee – 4 members responsible for monitoring the effectiveness of the
group’s financial reporting, internal control systems and risk management systems. Deloitte was appointed for the statutory audit, with effect from 2018.
• Safety, ethics and environment assurance committee (SEEAC) – 7 members
responsible for looking at the processes adopted by BP’s executive management to identify and mitigate significant non-financial risk.
• Remuneration Committee – 6 members responsible for determining and
recommending to the board the remuneration policy for the chairman and executive directors.
• Geopolitical Committee – 7 members responsible for monitoring the company’s identification and management of geopolitical risk.
• Chairman’s Committee – Composed by all non-executive directors responsible for
providing a forum for matters to be discussed.
• Nomination Committee – 6 members responsible for ensuring an orderly succession
of candidates for directors and the company secretary.
BP complied throughout 2018 with 96.4% of provisions of the UK Corporate Governance Code, which is based on the principles of Leadership, Effectiveness, Accountability, Remuneration and Relations with Shareholders. BP’s ESG Disclosure Score is 69.71, considerably higher than the peer’s average of 56.95. These metrics have a range of 0 to 100, that measure transparency, the more information disclosed, the higher the disclosure score. BP has three types of shares: ordinary shares, that represent 99.58% of the total issued nominal share capital of the company (excluding shares held in treasury), with the one-share-one-vote principle; preference shares, that represent 0.42%, with the one-share-two-votes principle; and ADS that represent ownership rights in six BP ordinary shares. The company’s major shareholders do not have different voting rights, and this principle protects minority shareholders by giving them the same voting rights for candidates for the Board and the right to receive dividends.
Sustainability and Social Responsibility. BP is a company that already has more than two decades of taking actions on climate change and active participation on several initiatives with the concern in the reduction of emissions. In 2018, BP implemented its Advancing Low Carbon accreditation programme, supported by 6 initiatives and specifically designed to encourage every part of BP to pursue lower carbon opportunities (Appendix 17).
BP’s sustainability strategy highlights three main areas: reducing emissions in operations, including zero net growth in operational emissions out to 2025, 3.5Mte of sustainable greenhouse gas (GHG) emissions reductions by 2025, and with targeting methane intensity of 0.2% and holding it below 0.3%; improving BP’s products, by providing lower emissions gas, developing more efficient and lower carbon fuels, lubricants and petrochemicals, and growing lower carbon offers for costumers; and creating low carbon businesses, by expanding low carbon and renewable businesses, with $500 million invested in low carbon activities each year, and collaborating and investing in the Oil and Gas Climate Initiative’s.
Figure 14: World Total Population
(billion people)
Source: Economist Intelligence Unit
Figure 13: World Real GDP (2010
Constant Prices)
Source: Economist Intelligence Unit Source: Company data
Figure 12: BP’s Governance Structure
Table 6: BP’s Board members
6
4. Industry Overview and Competitive Positioning
World Economic Outlook.
Stable world economic GDP growth. In the aftermath of the sovereign crisis in the early 2010’s, the world real GDP growth has been on a recovery path. There was a slight growth from 2.40% in 2012 to 3.00% in 2017. World real GDP growth is expected to range from 2.60% to 3.00% between 2018F and 2022F, mainly explained by Asia and Australasia (Figure 13). However, OECD countries real GDP growth is expected to slightly decrease (1,40% in North America vs 1,60% in Western Europe, in 2020F).
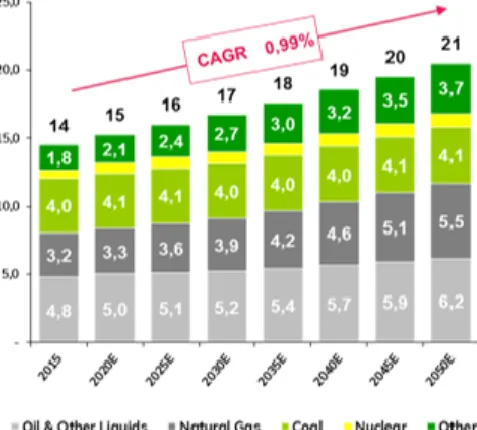
World Population Growth. World Population is expected to increase to 3.5 billion people in 2022F, resulting in a +2% CAGR, between 1990 and 2022F, mainly explained by the Asian and Australasian regions, increasing from 0.8 billion people to 1.9 billion people (Figure 14). Demand for Primary energy. The demand for energy consumption is projected to increase over the next 30 years. Thus, it is expected to grow to a CAGR of 0.99%, from 14 to 21 gigatonne of oil equivalent (GTOE). This increase is mostly justified by population growth and the economic development in non-OECD countries (Figure 15).
There has been a recent transition to a low carbon economy through the development of new sources of energy, particularly renewables. However, its impact is expected to take time to penetrate the market, making Oil & Gas the world’s leading primary sources of energy (56% in 2015 vs 57% in 2050F).
Stable production of Crude Oil, with a slightly predicted growth.In the recent past, between 2000 and 2015, Crude Oil and NGL production has increased considerably from 75 to 91 million barrels per day (mb/d). In the year 2022F it is expected to reach 100 mb/d, corresponding to a CAGR of +0.41%. This is due to the hegemony of OPEC countries, with a market share of 42% in 2017 (Figure 16).
Considering this and developments in consumption and production of Crude Oil, Brent prices are expected to grow at CAGR of +4.14 and the US Henry Hub to a CAGR of 3.05% (both between the period 2015-2022F).
The rise in Crude Oil Price influenced by political instability. The global uncertainty of the international supply accompanied by the low growth of oil inventories (0,11% CAGR between 2012-2017) caused an increase in the crude oil price since the collapse of the price in 2014 ($/BBL 52 in 2015 vs. $/BBL 54 in 2017). The determining factor is geopolitical instability, namely the production cut in Venezuela and the possibility of economic sanctions imposed by the USA. As a future trend, it is expected an increase of the price from the $/BBL 54 in 2017 to $/BBL 70 in 2022, as OPEC members have recently agreed to decrease production by about 1mb/d (Figure 17).
The risk of Hard Brexit.
Instability in Brexit Agreement. Brexit is an abbreviation for “British exit”, a term used when referring to UK’s decision to leave the EU. On June 23rd, 2016, the British people were asked whether the UK should stay or leave the EU. The majority (52% of voters) decided that the country should leave, however, this did not happen immediately.
In March 2017, this decision was notified to the EU, and according to Article 50 of the Lisbon Treaty, once communicated, the withdrawal would take place two years later. However, this was not the case as during this period the exit agreement of former British Prime Minister Theresa May was rejected three times in Parliament. The agreement defined the following three points:
i) UK would have to pay to EU around GBP 39 billion for breaking the partnership contact; ii) Specific rules defining the consequences for British and European citizens living in and outside the UK;
iii) Question to avoid a closed frontier between Northern Ireland (which is part of the UK) and the Republic of Ireland (EU independent country).
The agreement also provided for a transitional period until December 31st,2020 for the UK and the EU to formulate a trade agreement to prevent sudden and unattached exit. The main reason for the rejection in Parliament is justified by the uncertainty over the possible political tension regarding the frontier between Northern Ireland and Republic of Ireland (marked by conflict for three decades in the past).
Source: USEIA – International Energy
Outlook 2017
Figure 15: World Primary energy
consumption. Forecast by source (GTOE)
Figure 16: World Crude Oil and NGL
Production (MB/d)
Source: Rydstad Energy
Source: BP Annual Reports, Bloomberg,
Deloitte forecast and EIA forecast
Figure 17: Brent historical and
7
The successive failures in Brexit’s driving led Theresa May to leave in June 2019, being the second after the David Cameron. As such, Boris Johnson was elected, determined to take Brexit forward with or without agreement.
Faced with the imminent risk of a Hard Brexit, 27 European leaders agreed on the postponement of the UK exit deadline, easing the threshold originally set by Article 50. Regarding that, in September 2019, a law was passed in the British Parliament preventing a Brexit without agreement, requiring a new deadline. Therefore, the next deadline will be October 31st, 2019, in which case Brexit will make UK the first member state to leave the EU. Severe economic uncertainty. The occurrence of a Hard Brexit would mean leaving UK without the possibility of a transitional period, severing relations with EU overnight. Such an event will bring serious economic consequences. The IMF predicts that a non-deal exit scenario could knock between five or eight percentage points off Britain’s GDP and threaten the global economy.
In addition, two serious consequences are expected:
i) Hit to Corporate Profits. With a Hard Brexit, trade will suddenly switch to World Trade Organization terms, raising tariffs and customs checks overnight. Thus, more expensive imports coupled with the expected depreciation of the country’s currency will inevitably increase inflation levels. This scenario would weigh on Corporate profits, reduce consumer purchasing power and potentially destroy the British economy.
ii) Pressure on Financial Contracts. A major concern remains in the possible shortage of labour by EU citizens and in London’s status as a global financial center. Banks and financial services companies operating outside the capital of the country are moving to Europe for fear that their ability to serve customers outside UK may be undermined. Given this scenario of constant uncertainty, Martin Gilbert, chairman of Aberdeen Standard Investments, on June 6th, 2019, assigned a percentage of 60% for a Hard Brexit. This number was motivated by two successive events, firstly the imminent exit of Theresa May without reaching agreement in the British parliament; and, secondly the unwillingness of the EU to negotiate with the new prime minister, given the failure carried out by Theresa May. Regarding with that, recent declarations by Boris Johnson state that the UK’s chances of no-deal Brexit are “a million-to-one against”.
Global Oil & Gas Industry Overview. Oil & Gas Industry includes global processes of exploration and extraction (upstream), transportation and commercialization of petroleum products (midstream), as well as refining (downstream).
The market structure is an Oligopoly composed of a small set of large players that influence the direction of the market and by a group of small companies conditioned by them. Oil & Gas Industry life cycle is mature, in which market is expected to grow slowly but presence of its players is high (Appendix 18). In terms of business cycle, it presents a cyclical activity that ranges between 7 and 9 years (Appendix 19), considering the correlation between the sales growth rate of the two largest US players and real GDP USA growth (correlation coefficient amounting to 46%).
Industry marked by high volatility in Commodities Prices. One of the major challenges facing the Oil & Gas industry is related to the relationship Production vs Price. Historically, there has been a decrease in the new reserves discovery with economic viability between 2010 and 2017. Regarding with that, the number of global Crude Oil reserves has decreased from 1.707 billions of barrel (BBLS) in 2016 to 1.697 BBLS in 2017 (Figure 19).
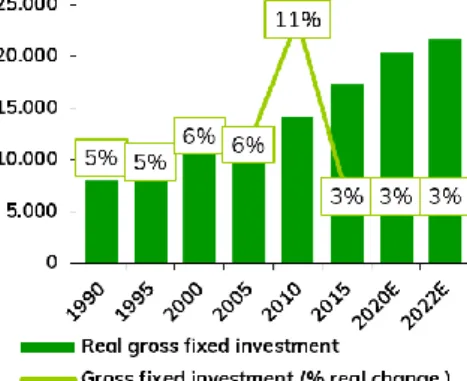
With the collapse of the prices from 2010 ($/BBL 80) to 2015 ($/BBL 52), there was a decrease in the growth rate of gross fixed investment from 11% in 2010 to 3% in 2015 (Figure 22). The estimates point for the lower rate to persist (stable growth rate at 3% YoY from 2015 to 2022). Paris Climate Change Agreement and Legal changes. In the recent past, there has been a growth in total C02 emissions due to coal and other sources of fuel combustion including industrial waste and non-renewable municipal waste. The Paris Climate Change agreement was celebrated following the growth of total CO2 emissions from fuel combustion by a CAGR of 1.71%, between 1990 and 2015. Therefore, total CO2 emissions from fuel combustion, are expected to increase at a slower CAGR rate of 0.74%, between 2015 and 2022F (Figure 20). This forecast is result from incentives of governments to lower taxes on renewable energies and raising taxes on fuel combustion sources of energy.
Figure 19: World Crude Oil Reserves
(Trillions of Barrels)
Source: Company Filings and BP Annual
Statistical Report
Figure 20: Total CO2 emissions from
fuel combustion (Mt of CO2)
Source: Economist Intelligence Unit Source: BP Annual Reports, Bloomberg,
Deloitte forecast and EIA forecast
Figure 18: U.S. Henry Hub historical
8
Additionally, on the demand side, the traditional metal-based materials used in the new generations of airplanes were replaced by resistant fibres that are made with oil-based resins.
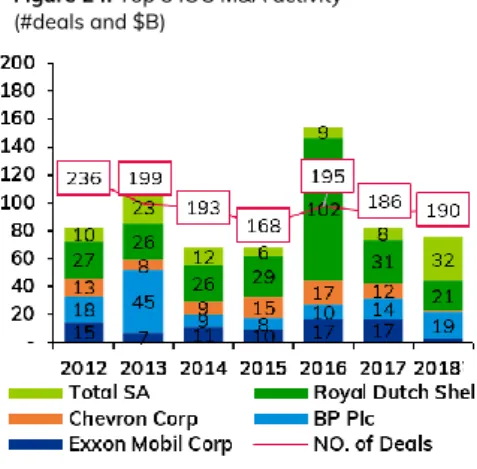
Higher M&A activity. The Oil & Gas Industry is conducive to a higher M&A activity, and a new wave of opportunities has appeared. Between 2015 and 2017, the five largest IOC, by market cap, increased from 168 to 186 deals (Figure 24). The main key drivers for this evolution were:
i) value chain integration; ii) economies of scale; iii) technology / digital;
iv) distress (means of survival for companies with large debt burdens in a significantly oversupplied market);
v) increased difficult on the access to capital markets.
In short, M&A activity is a strategy undertaken by the largest players to quickly adapt to changes in the sector.
Portfolio Optimization and disruptive technological changes. A future trend is also the portfolio optimization, that is, several contractors and service providers already planning divestments of non-core divisions. Additionally, the USA Corporate Tax Cut from 31% to 25%, and the higher flexibility in the repatriation of profits overseas is expected to have major impacts in the profitability of the US Companies in the industry.
In less than a decade, there was a major technological change on the supply and demand sides of the industry, by the combination of directional drilling and hydraulic fracturing ("fracking").
The changing energy mix. Energy consumption has experienced a paradigm shift associated with industry electrification and the increasing demand for renewable energy sources. Regarding that, two distinct scenarios are foreseen (Appendix 20):
i) Evolving transition – This scenario assumes that government policies, technology and social preferences continue to evolve in a manner and speed seen over the recent past. Thus, it is expected that world energy demand increases by one third from 2017 to 2040; CO2 emissions from energy increase by 7% by 2040; and, oil and gas account for more than half of global energy in 2040.
ii) Rapid transition – This scenario is consistent with the Paris goals, and is broadly like the reduction in carbon emissions in the EIA’s Sustainable Development Scenario. Thus, is expected that oil demand in 2040 decreases by 14Mb/d and Biofuels grow by 4Mb/d; CO2 emissions decline by around 45% by 2040; and, global energy consumption grows by around one fifth.
Additionally, the use of electric vehicles is expected to increase and, by 2040, there could be around 350 million circulating around the world. Currently, only about 1% of cars int the world are fuel type electricity. However, by 2025 this figure is expected to increase to about 5%. From then on, a large growth is projected, reaching in 2040 31% of electric vehicles (Appendix 21).
Key Drivers of Industry Profitability. Price (driven by supply and demand) is the Oil & Gas industry most relevant profitability driver, conditioning the level of return. Nevertheless, this is also the most difficult driver to manage, because it is an input from the market. Given this, companies can only act over it by taking long-term contracts or developing a hedging strategy with derivatives.
In addition, price dictates which rigs are profitable, conditioning the production volume and stating the importance of rig portfolio management.
Besides that, to be profitable and create value, companies can lever other value drivers along the value chain, such as refinery yield, flexibility and refining margins, among others. Major players in the Oil & Gas industry also add enterprise value, through synergies captured over the value chain, by adopting an integrated operating model.
Among Peers, looking upward. Industry peers were selected based on the Bloomberg Integral Oil Companies (IOC Group). This Group comprises the companies that operate in the three levels of the value chain (i.e. upstream, midstream and downstream) and are publicly traded. We have selected the five largest IOC in the group by market cap and by production level, i.e., Exxon, Chevron, BP, Royal Dutch Shell and Total.
These companies share common strategies, namely:
Source: Bloomberg data
Figure 21: Brent Price vs RoACE
Figure 22: Gross fixed investments
Source: EIU analysis and Author’s analysis
Figure 23: Worldwide Capacity and
Utilization
9
i) Diversification in emerging markets;
ii) M&A, strategic agreements and partnerships; iii) Business models integration;
iv) Portfolio optimization; v) Increase in production; vi) Raise profits and returns;
vii) Maximize value from technology.
BP Competitive Positioning. In order to assess BP’s strategic position in the Oil & Gas Industry, we presented a Positioning Matrix (Figure 25) comparing the 5 largest identified IOCs, assessing ROCE by production level, two of the industry’s leading comparison indicators. Additionally, we performed a Porter’s Five Forces analysis (Figure 26), as well as a SWOT analysis.
Porter’s Five Forces analysis.
Threat of new entrants | LOW
The entry of new players in the market is a relatively low threat, considering the characteristics of the industry, that require the following:
i) Industry economies of scale – To operate in the market, a high level of production is required to achieve break-even and dilute the infrastructure fixed costs;
ii) High Capital requirements – At every stages of the value chain, a high level of investment is required. Starting with the Exploration activity, where investment does not always guarantee return, passing to Refining through large facilities and ending up in Research & Development (R&D), where technology innovation capacity prevails;
iii) Difficult access to distribution channels – Practically all distribution channels are dominated by the industry’s largest players, making it difficult to access newcomers; iv) Restrictive government policies – Highly regulated industry restricted to the generation of new production licenses, protecting the interests of the actual players;
v) Expected retaliation from actual players – The industry’s biggest players have a huge financial capacity to outperform any newcomer strategy, having a long history of M&A processes.
Bargaining power of suppliers | MODERATE
Given that most players have a vertically integrated value chain, the most relevant suppliers are oil producer countries. In the industry there are no alternative substitute products, increasing dependence on oil producers. States have the power to allocate exploration and production licenses and, in many cases, cartels are formed allowing them to acquire a major market share. Regarding with that, oil producer countries might integrate forward in the value chain, creating a National Oil Company (NOC) to explore their own national resources. However, this bargaining power on the part of suppliers may be affected. A possible disruption in a cartel organization could set a precedent of instability (e.g. Qatar exit from OPEC). Another threat is directly linked to political tension and economic sanction (e.g. Syria and Iran). Finally, many countries have a huge dependence on oil exploration for their financial stability.
Bargaining power of buyers | LOW
Considering the characteristics of the industry, it can be said that the bargaining power of buyers is relatively low. There is a massive group of different kinds of buyers, comprising since single costumers (e.g. refined products), to industries (e.g. petrochemical) and state companies (e.g. gas contracts). The existence of vertical integration along players’ value chain, along with cartelization, gives companies a higher bargaining power than consumers. The determined market price is the result of a match between supply and demand, with the top 3 quotes being the Brent Blend, the West Texas Intermediate, and the Dubai/Oman. Associated with this, as there is no viable solution for a massive alternative product substitution, it makes the consumer not price sensitive. Lastly, high costumer switching costs, since the changing of oil & gas to another energy source is expansive and only possible in the long run.
Threat of substitute products or services | MODERATE
The current paradigm of the threat of substitute products is relatively low. There is no viable solution to a massive replacement of plastic and petrochemicals in the world. Some of actual energy sources are likely to lose importance in the global energy mix, associated with environmental and political reasons, such as the impact of coal on CO2 emissions.
Figure 24: Top 5 IOC M&A activity
(#deals and $B)
Source: Global Data’s Deals and Alliances
Profile
Figure 25: Positioning Matrix
Source: Bloomberg data and Author’s
analysis
Figure 26: Porter’s Five Forces
Source: Michael E. Porter framework (2008)
10
However, the threat of substitute products tends to increase in the mid-term, with the search and development of alternative fuels (e.g. ethanol from Brazil), as well as, the expansion in renewable energy production (associated with the transition to a low carbon economy).
Rivalry among existing competitors | HIGH
Oil & Gas Industry is a mature oligopoly, where the intensity of rivalry between competitors is high. There are a considerable number of players on the market, some of which are relatively similar in size and power (e.g. top 5 IOC). Given that the industry is growing, especially with the existence of a new market to exploit renewable energy, players are expected to increase their rivalry in search of additional market share.
It should also be noted that products have little or no differentiation and exit barriers ate high given the costs of stopping production, for example, costs of shut down a well or to abandon a refinery.
However, the level of competition can be compensated through the differentiation strategies of each player. There is no competition in price, since it is formed by the market. So, companies try to differentiate by their brand power and services delivered.
5. Investment Summary
We issue a HOLD recommendation on BP with a 2020YE target price of GBP 5.985/sh using a DCF model, representing a +14% upside potential to the company’s stock price of GBP 5.002/sh at August 30th, 2019, but with high risk.
We attribute the company’s undervaluation to excessive investor pessimism due to the recent drop in price in line with the entire global stock market (Figure 28). The crude prices have fallen about a fifth from 2019 highs hit in April, partly because of worries that the trade war, between USA and China, is impacting the global economy and oil demand.
Despite the predictable effect of Brexit on the falling GBP/USD quote due to the lack of time to prevent a no-deal Brexit, which increases uncertainly causing a short-term weakness in share price, BP CEO has already announced that the company will remain in the UK. However, crude price recovery is expected, with an average forecasted price 2019F-23F of $68.00. The growing advantaged oil and gas in the Upstream, the Market-led growth in the Downstream, and a strong and diversified portfolio, accompaniedby a strong dividend policy, opens room for an increase in the share price. We must take into consideration the uncertainty related to Hard Brexit and the possible effects on the company’s operating results.
In short, BP is a company with growth potential, especially in an energy transition environment. Nevertheless, there is uncertainty regarding its upside potential motivated by the impact of Brexit.
Figure 27: BP’s SWOT Analysis
Source: Author’s analysis
Table 7: DCF Price Target
Source: Author’s estimates
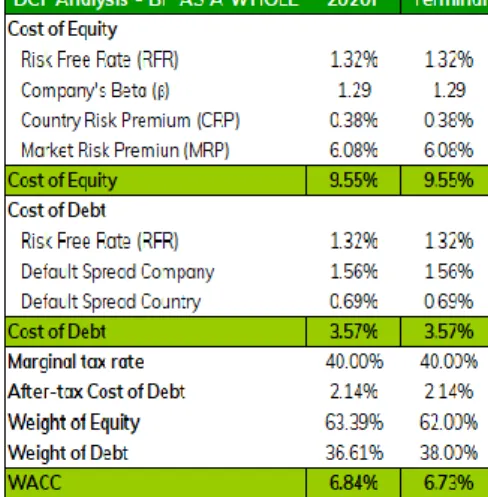
Table 8: BP’s WACC
11
The recent acquisition of BHP’s US assets in a deal that will significantly upgrade BP’s US onshore oil and gas portfolio and help drive long-term growth. This deal will allow BP to achieve by 2021 a gradual increase in its oil and gas production by around 190.000 boe/d. BP started up six major projects in UPS, with a global presence (Azerbaijan, Australia, Egypt, UK North Sea, Russia and US Gulf of Mexico), making a significant contribution to the 900.000 boe/d of expected new production between 2016YE and 2021F. This investment allows BP to increase its total production from 5,078 million barrels of oil equivalent per day (mboe/d) to 5,504 mboe/d (increase of 2.72% CAGR 2018YE-21F). This, coupled with the positive outlook for the crude price recovery, permits BP to increase its average realization in liquids, natural gas and hydrocarbons, resulting in an increase of its revenues 2019F-23F by +12.4pp. BP’s constant investment in the expansion of its global retail network has allowed its Downstream businesses to penetrate new markets. In 2018, BP opened more than 220 retail sites in Germany, increasing to about 1,400 convenience partnership sites. Following this strategy, BP intends to grow its network, having increased to around 440 BP-branded retail sites in Mexico and opening its first sites in Indonesia, with the future objective of growing in China. This investment allows BP to have an expected growth on its retail sites of 0.50% CAGR 2019F-23F, resulting in an increase of its revenues of Marketing, spot and term sales of refined products by +8.6pp.
BP has a clear policy of paying dividends to shareholders, aiming to ensure a progressive dividend policy. BP has a current 6.30% dividend yield, relatively stable over the last 6 years, ranging from 5.70% - 7.50%. This value is justified by a historically paid 40.00 cents average dividend per share, concluding that BP will always pay dividends to its shareholders, even when it gets a negative EPS (example in 2015). In addition, BP offers a scrip dividend programme which enables ordinary shareholders and ADS holders to elect to receive new fully paid shares or ADSs instead of a cash dividend. The programme was approved by shareholders at the 2010 Annual General Meeting and this approval was renewed at both the 2015 and the 2018 Annual General Meeting (Figure 29).
BP is recognized in the market for managing a strong and diversified business portfolio that includes Upstream, Downstream, Renewable Energy and an established trading function. Its diversification strategy is supported by its global presence in more than 70 countries. In addition, BP has a unique partnership with Rosneft, the largest oil company in Russia (19.75% shareholding). This allows BP to remain resilient in a changing world, having the flexibility to adapt to changing trends and legislation, and helps BP to mitigate the impact of commodity pricing cycles.
Valuation Methods. To obtain BP’s target price we used the Discounted Cash Flow (DCF) model through Free Cash Flow to the Firm (FCFF) methodology. Regarding that, we have made two distinct valuation methods:
i) BP as a whole - We derive the Enterprise Value of all BP segments, considering the existing synergies between segments, obtaining a price target of GBP 5.985/sh (Table 7); ii) Sum of Parts (SoP) approach – We derive the Enterprise Value of each segment (Upstream, Downstream and Other Businesses and Corporate), considering the risk associated with each segment individually, obtaining a price target of GBP 5.480/sh (Table 9).
For both methods, we have subtracted gross debt and non-controlling interests from the determined Enterprise Value and made the necessary adjustments to equity to account for items previously not considered. However, since BP is an integrated oil and gas company, it makes sense to recognize the joint synergies of each segment, rejecting the SoP approach recommendation option.
As complementary methods we used DCF model through Free Cash Flow to the Equity (FCFE) methodology, obtaining a price target of GBP 6.139/sh. With the Dividend Discount Model (DDM) valuation, we have reached at a GBP 6.075/sh, and with the Multiples Valuation through EV / EBIT, Price-to-Earnings and Price-to-Book, obtaining an average price target of GBP 5.513/sh, that are in line with base 2020YE recommendation.
Risks to Achieve Price Target. In the Oil & Gas Refining industry, the nature of BP’s business is inherent in greater risk exposure. As such, we must pay attention to some Investment Risks that cannot be controlled, but mitigated, by BP management. These risks include economic, environmental, operational and political risks.
Figure 28: Brent Oil Price evolution vs Peers
performance
Source: Bloomberg data and Author’s
estimates
Figure 29: BP’s Dividends & Dividend Yield
Source: Company data and Author’s estimates
Table 9: DCF Price Target - SoP