Universidade do Minho
Escola de Engenharia
Marco Rafael Linhares Couto
Monitoring Energy Consumption
in Android Applications
This thesis is integrated in the project GreenSSCM - Green Software for Space Missions Control, a project financed by the Innovation Agency, SA, Northern Regional Operatio-nal Programme, Financial Incentive Grant Agreement under the Incentive Research and Development System, Project No. 38973.
Universidade do Minho
Dissertação de Mestrado
Escola de Engenharia
Departamento de Informática
Marco Rafael Linhares Couto
Monitoring Energy Consumption
in Android Applications
Mestrado em Engenharia Informática
Trabalho realizado sob orientação de
Professor João Alexandre Saraiva
Professor João Paulo Fernandes
A C K N O W L E D G M E N T S
As all journeys must come to an end, journey towards a masters degree is finally coming to a close. All the difficulties, struggles and failures that appeared were impossible to overcome alone, and as such I am obligated to show my gratitude with who supported me on this effort. First of all, I would like to thank all my family for all their patience and support they gave me. Second, I have to thanks my supervisor, professor Jo˜ao Saraiva, and my co-supervisor, professor Jo˜ao Paulo Fernandes, since they were the most usual source of support and advice. Their support for me never wavered, and after this work I see them as role models. A warm thanks is also extended to professor J´acome Cunha, another role model for me, and all the remaining members of Green Lab (Pedro Martins, Jorge Mendes, Rui Pereira and Tiago Carc¸˜ao), and to the members of the GreenSSCM1 project. Their critics and advices were absolutely crucial in countless times. At last (but not least) I would like to thanks professor Robert Dick, from Michigan University (USA), for his great availability when his help was needed.
1 This work is integrated in the project GreenSSCM - Green Software for Space Missions Control, a project financed by the Innovation Agency, SA, Northern Regional Operational Programme, Financial Incentive Grant Agreement under the Incentive Research and Development System, Project No. 38973.
A B S T R A C T
The use of powerful mobile devices, like smartphones, tablets and laptops, are changing the way programmers develop software. While in the past the primary goal to optimize software was reducing the run time, nowadays there is a growing awareness of the need to reduce energy consumption.
In this thesis we present a combination of techniques to detect anomalous energy consumption in Android applications, and to relate it to their source code. The idea is to provide applications developers with techniques and tools to locate in the source code of the application the code fragments that are responsible for high energy consumption. Thus, we present a model for energy consumption for the Android ecosystem.
The model is then used as anAPIto monitor the application execution. To relate program execution and energy consumption to the application source code, the code is first instrumented with calls to the API of the model. To execute that (instrumented) application, we use a testing framework for Android.
Finally, we use a statistically approach, based on fault-localization techniques, to localize abnormal energy consumption in the source code.
R E S U M O
O uso de dispositivos m´oveis, como smartphones, tablets ou port´ateis, est´a a mudar a forma como os programadores desenvolvem software. Enquanto que no passado o principal objetivo para otimizar software era o de diminuir o tempo de execuc¸˜ao, nos dias de hoje existe uma sensibilizac¸˜ao crescente para com a necessidade de reduzir o consumo de energia.
Esta dissertac¸˜ao visa apresentar uma combinac¸˜ao de t´ecnicas para detetar consumos de energia anormais no c´odigo de aplicac¸˜oes Android. A ideia ´e fornecer aos desenvolvedores de aplicac¸˜oes An-droid t´ecnicas e ferramentas que consigam localizar no c´odigo fonte de uma aplicac¸˜ao fragmentos de c´odigo que sejam responsaveis por n´ıves de consumo de energia mais elevados. Assim, apresentamos um modelo de consumo de energia para o sistema Android.
Esse modelo ´e depois usado na forma deAPI para monitorizar a execuc¸˜ao da aplicac¸˜ao. Assim sendo, o c´odigo fonte de uma aplicac¸˜ao ´e inicialmente instrumentado para podermos relacionar com ele consumos de energia. Para executar a aplicac¸˜ao (instrumentada), usamos uma framework de teste para Android.
Finalmente, usamos uma abordagem estat´ıstica, baseada em t´ecnicas de localizac¸˜ao de falhas, para localizar consumos de energia anormais no c´odigo fonte.
C O N T E N T S
i I N T R O D U C T O R Y M AT E R I A L 1
1 I N T R O D U C T I O N 2
1.1 Motivation and Objectives 3
1.2 Document structure 5
2 S TAT E O F T H E A R T 7
2.1 Software Development: Monitoring tools 7
2.2 Green Computing and energy profiling 10
2.3 Monitoring Energy Consumption in Mobile devices 11
2.4 The selected tool: Power Tutor 15
3 T H E P R O B L E M A N D I T S C H A L L E N G E S 17
ii C O R E O F T H E D I S S E R TAT I O N 19
4 P O W E R C O N S U M P T I O N M O D E L 20
4.1 The Android Power Tutor Consumption Model 20
4.2 Static Model Calibration 22
4.3 Power Model: Dynamic Calibration 22
5 E N E R G Y C O N S U M P T I O N I N S O U R C E C O D E 25
5.1 The Model as an API 25
5.2 Source Code Instrumentation 26
5.3 Automatic Execution of the Instrumented Application 28
5.4 Green-aware Classification of Source Code Methods 29
6 G R E E N D R O I D: T H E F R A M E W O R K F O R E N E R G Y P R O F I L I N G 32
6.1 Workflow 32
6.1.1 Instrumenting the source code 33
6.1.2 Execute the tests 33
6.1.3 Pull files from the device 34
6.1.4 Classify the methods 34
6.1.5 Generate the results 35
7 R E S U LT S 37
8 C O N C L U S I O N S A N D F U T U R E W O R K 42
8.1 Achievements/Contributions 42
Contents iii A P E N D I C E S 50
A S U P P O R T W O R K 51
B D E TA I L S O F R E S U LT S 52
B.1 Results for 0xBenchmark 52
B.2 Results for AppTracker 54
B.3 Results for Catlog 56
B.4 Results for ChordReader 58
B.5 Results for Connectbot 60
B.6 Results for Google Authenticator 63
B.7 Results for NewsBlur 69
C T O O L I N G 71
C.1 Power Tutor 71
C.1.1 Construction of the power model 71
C.1.2 Assign power/energy to applications 72
C.2 Java Parser 72
C.3 Java DOM Parser 72
C.4 Android JUnit Report Test Runner 73
L I S T O F F I G U R E S
Figure 1 The 3 layers of the Green Droid tool and its interactions 6
Figure 2 An example of an execution of the GDB tool 8
Figure 3 GZoltar tool inside the Eclipse IDE 8
Figure 4 A comparison of memory usage between two implementations of the same
program (in Haskell) 9
Figure 5 Power Tutor execution views (reprinted from [43]) 15
Figure 6 Caption for image 21
Figure 7 3G interface power states (reprinted from [43]) 21
Figure 8 The architecture to dynamically calibrate the power model for different
de-vices 23
Figure 9 The behavior of the instrumentation tool 26
Figure 10 The behavior of the monitoring framework 33
Figure 11 Sunburst diagram (and how to interpret it) 36
Figure 12 Main page of the 0xBenchmark application 37
Figure 13 Total consumption per test (0xBenchmark) 38
Figure 14 Consumption per second (0xBenchmark) 38
Figure 15 Execution time (0xBenchmark) 38
Figure 16 Total consumption per test (Google Authenticator) 39
Figure 17 Execution time (Google Authenticator) 39
Figure 18 Consumption per second (Google Authenticator) 40
Figure 19 Sunburst diagram for 0xBenchmark application (and how to interpret it) 41
Figure 20 Sunburst diagram for Google Authenticator application 41
Figure 21 Total consumption per test for 0xBenchmark application 53
Figure 22 Consumption per second for 0xBenchmark application 53
Figure 23 Execution time per test for 0xBenchmark application 53
Figure 24 Total consumption per test for Apptracker application 54
Figure 25 Consumption per second for Apptracker application 55
Figure 26 Execution time per test for Apptracker application 55
Figure 27 Total consumption per test for Catlog application 56
Figure 28 Consumption per second for Catlog application 56
Figure 29 Execution time per test for Catlog application 57
Figure 30 Total consumption per test for Chordreader application 59
List of Figures
Figure 32 Execution time per test for Chordreader application 59
Figure 33 Total consumption per test for Connectbot application 60
Figure 34 Consumption per second for Connectbot application 60
Figure 35 Execution time per test for Connectbot application 61
Figure 36 Total consumption per test for Google Authenticator application 67
Figure 37 Consumption per second for Google Authenticator application 67
Figure 38 Execution time per test for Google Authenticator application 68
Figure 39 Total consumption per test for NewsBlur application 69
Figure 40 Consumption per second for NewsBlur application 70
L I S T O F TA B L E S
Table 3 Top Smartphone Operating Systems, Shipments and Market Share in 2013
(Units in Millions) 11
Table 4 Example of a power model instance for HTC Dream smartphone (reprinted
from [43]) 16
Table 5 Table representation of test results of App1 (with method classification
bel-low) 31
Table 6 List and detalis of the Android applications tested 51
Table 7 Details of each test from 0xBenchmark application 52
Table 8 Details of each test from AppTracker application 54
Table 9 Details of each test from Catlog application 56
Table 10 Details of each test from ChordReader application 58
Table 11 Details of each test from Connectbot application 62
Table 12 Details of each test from Google Authenticator application 66
L I S T O F L I S T I N G S
2.1 Example of an use of nanoTime() method for performance analysis. . . 9
5.1 Example of an utilization of traceMethod . . . 27
A C R O N Y M S
A P I Application Programming Interface
C P U Central Processing Unit
L C D Liquid Crystal Display
U I D User Identifier
O S Operating System
M W Milliwatts
M H Z Megahertz
G P S Global Positioning System A U T Application Under Test
X M L eXtensible Markup Language
S D K Software Development Kit
S F L Spectrum-Based Fault Localization
G C C GNU Compiler Collection
Part I
1
I N T R O D U C T I O N
The software engineering and programming languages research communities have developed ad-vanced and widely-used techniques to improve both programming productivity and program perfor-mance. For example, they developed powerful type and modular systems [11, 14], model-driven software development approaches [4,27], integrated development environments [17,18] that, indeed, improve programming productivity. These communities are also concerned with providing efficient execution models for such programs, by using compiler-specific optimizations (like, tail recursion elimination), partial evaluation [21], incremental computation [2], just-in-time compilation [26], de-forestation and strictification of functional programs [19,39, 40], for example. Most of those tech-niques aim at improving performance by reducing both execution time and memory consumption.
While in the previous century computer users were mainly looking for fast computer software, this seems to be changing nowadays with the advent of powerful mobile devices, like laptops, tablets and mobile devices. This trend to mobile devices is getting evident with the statistics regarding device shipments. Table 1shows the total number of devices sold in the last years, comparing mobile and desk-based.
Device Type 2012 2013 2014 2015
PC (Desk-Based and Notebook) 341,273 299,342 277,939 268,491 Tablet (Ultramobile) 119,529 179,531 263,45 324,565 Mobile Phone 1,746,177 1,804,334 1,893,425 1,964,788 Other Ultramobiles (Hybrid and Clamshell) 9,344 17,195 39,636 63,835
Total 2,216,322 2,300,402 2,474,451 2,621,678
Table 1.: Worldwide Device Shipments by Segment (Thousands of Units)1
As we can see, the number of traditional computers sold is decreasing. On the other hand, mobile devices sales (such as tablets and smartphones) is growing, and it is expected that next year sales continue to rise for these devices.
The importance and prominence that mobile devices have in our days is evident. However, in our mobile-device age, one of the main computing bottlenecks is energy-consumption. The amount of time that one of this devices takes to fully discharge its battery is short, and makes the device look not that mobile since it has to be constantly charged or plugged to a charging station. In fact,
1.1. Motivation and Objectives
device manufacturers and their users tend to be as concerned with the performance of their device as with battery consumption/lifetime. Creating a device that takes longer to discharge the battery is still crucial and manufacturers are actually working in this front, but designing energy efficient software is also an area needed to be explored.
This growing concern on energy efficiency may also be associated with the perspective of soft-ware developers [35]. Unfortunately, developing energy-aware software is still a difficult task. While programming languages provide several compiler optimizations (GCChas the optimization flags, for example), memory profiling tools like the Heap Profiler [37] for Haskell, benchmark and time exe-cution monitoring frameworks (in Java there is nanoTime() and timeInMillis() method calls, among others), there are no equivalent tools/frameworks to profile/optimize energy consumption, at the best of our knowledge.
Another interesting point is that there is a clear gap in the works that have been done in energy efficiency for the past years. Although there are several works aiming at reducing energy consumption by software systems, those works are focused on optimizing the hardware [3, 5, 6], i.e. creating hardware components such as CPUs or disks that spend less energy when executing software. The interest in optimizing energy consumption by analyzing software is very recent. But if the software is what triggers the hardware to work, it should be possible to design it to use the hardware in a way that minimizes the energy consumed. The question here is how to do that, how can a developer know what to change in the source code or what decisions he needs to make at the design phase, in order to minimize the energy consumption at runtime. There is still no clear answer to this question, so this area shows great research potential.
What this thesis aims to study is how software can influence the power consumption of mobile devices, more specifically how Android applications affect the battery discharge in a device running AndroidOS. If different implementations of identical software can have different values of power consumption, as has already been showed [12], then it must be possible to identify source code in-structions considered as energy ”threats”. For this, we intend to implement some techniques and methodologies that can help developers to identify possible energy inefficient blocks of code (such as methods or classes).
1.1 M O T I VAT I O N A N D O B J E C T I V E S
In this section, we start by clarifying the motivation for our work, and the reasons why we think this is an important research area. Next, we describe the goals we want to achieve with this work and the questions we want to give an answer to.
Nowadays, the utilization of mobile devices is not restricted to sending messages and making phone calls. In fact, the set of features and applications that mobile devices provide is increasingly varied, from accessing the e-mail to social network integration. This aspect, combined with the convenience and easiness of use made the mobile device industry (manufacturing and applications development)
1.1. Motivation and Objectives
show evident signs of growth. The abundance of tasks that a mobile device allows the users to do made the community look at them not as simple communication devices, but as a set of tools, applications and utilities, with infinite possibilities.
As a consequence of this growth, we face an increasing interest in developing new applications and adapting old ones to this new concept. But the convenience and easiness of use that make mobile devices so attractive also creates a problem: the battery lifetime. The fact is that the more functionality a device offers, the more energy it consumes, and as a consequence its battery lifetime will be shorter and we have less ”mobile” use.
From the programmer’s viewpoint, we can say that, without increasing the available resources (like memory, for example), the more efficient the application is, the less power will be consumed. But that is an assumption that is only related to theCPUcomponent. How to know if an application is efficient when using Wi-Fi orGPS? This components have significant influence in the power consumption of the device as well, and many applications use them. A simple web search allows us to understand the impact that these (and other) components have in the device energy consumption. Table 2shows a well known comparison between the battery lifetime in stand-by mode and executing different tasks: phone calls, web browsing and video playback.
Stand-by Talk Time Web browsing Video Playback
Samsung Galaxy S5 390 h 21 h 10 h 12 h
HTC One (M8) 496 h 20 h 9.5 h 11 h
LG G2 540 h 25 h 11.5 h 12 h
Samsung Galaxy Note 3 528 h 25 h 5 h 13.5 h Apple iPhone 5s 250 h 10.5 h 10 h 10.5 h
LG G Flex 600 h 25.5 h 9.5 h 20 h
Nokia Lumia Icon 432 h 16.5 h 7 h 9 h
Huawei Ascend Mate2 650 h 25 h 8.5 h 12.5 h
Sony Xperia Z1s 600 h 15 h 6 h 7 h
Google Nexus 5 300 h 15.3 h 4.5 h 5 h
Table 2.: Battery lifetime comparison2
Each of these tasks need different hardware components and in different proportions. For example, web browsing will mostly need Wi-Fi or 3G to download the information needed, andCPUto process it, while video playback mostly needsCPUto run, for example, the decoding algorithm, and of course the phone display. Most importantly, web browsing and video playback can be considered as software. So this shows the enormous weight that software has in the battery duration/lifetime. So, the first question that we face is: since the influence of software in battery lifetime is so obvious, how important and useful can it be to optimize software in terms of energy consumption?
Taking this question as a starting point we then wanted to study the influence of software imple-mentation in energy consumption, how different impleimple-mentations of similar tasks can lead to different
2 This values and more information can be found at http://cell-phones.toptenreviews.com/ mobiledevices/.
1.2. Document structure
(and possibly excessive) power consumption values. For that purpose, we needed to evaluate the pos-sibility of analyzing power consumption at a more detailed level: source code level. We propose a technique, based on an initial idea by [8], that turns the energy consumption analysis possible at the methods level, and present a tool that brings the programmer a new and clearer vision about the effi-ciency of an Android application, from a power consumption viewpoint. Being the battery one of the most critical components of a mobile device, the advantages of monitoring its usage are evident.
We considered the main goal of this thesis developing a technique or methodology and then im-plementing a tool that puts the methodology in practice. But besides that, we want to know if it can be useful for the developers, since they are the target audience for us, and also if there are results supporting the idea that energy consumption can be optimized by changing the source code, and so this thesis also aims to answer to three research questions:
• Q1: Given the source code of an Android application, is it possible to associate energy con-sumption to different code sections?
• Q2: Is it possible to develop a tool that can automatically identify code fragments most likely to have anomalous energy consumption, based on a power consumption model?
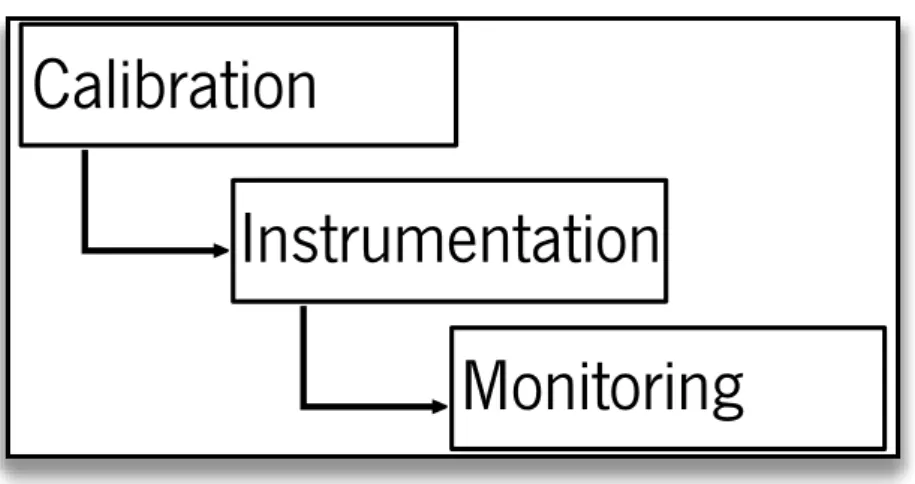
• Q3: Is the execution time of a code fragment directly proportional to its energy consumption? Our tool will be used to help us answer all this questions, so we discussed and analyzed in detail what was the best way to implement it. We decided to do it in a three layer architecture, as described in Figure 1. The tool is called Green Droid3, and works as a traditional tool that receives values as parameters related to the application being tested and uses intermediate tools (such as the instrumen-tation tool) as a sequence of steps to generate the results.
The calibration layer is still a work in progress. To summarize, the model can have different in-stances for different devices, and so for more reliable results those inin-stances need to be created. That is what we call dynamic calibration. In this document we will present an algorithm to dynamically calibrate the power model for different devices. Although the algorithm appears to be, at the best of our knowledge, correct (since it is a realization of the concept introduced in [43]), we could not fully test its implementation. This is due to the fact that a set of (supposedly) available training applications remained unavailable throughout the entire duration of this project.
1.2 D O C U M E N T S T R U C T U R E
This document is organized as follows: besides the current chapter, where we started by introducing the area of research, and then we describing the motivation founded for this work, as well as the goals intended to be reached, the next chapter, Chapter2, is destined to present the state of the art, where we describe the work done in the past: what has been studied and developed in this area. Here we present
1.2. Document structure
I
ns
t
r
ume
nt
at
i
on
Cal
i
br
at
i
on
Moni
t
or
i
ng
Figure 1.: The 3 layers of the Green Droid tool and its interactions
the different approaches that researchers followed in order to implement their ideas, along with the work we mostly based ours in.
We clarify the problem we want to solve and identify the biggest problems and corresponding solu-tions we had when we designed and implemented our technique/methodology, and when developing the tool in Chapter3.
The next chapter, Chapter4, is the beginning point for the core of this dissertation. Here is described what a power consumption model is, most specifically the model we used, its different components and how it was created. Section4.1is where we describe the power consumption model: what it is, how it is created and what components does it have. In section4.2we start by explaining what a static model is and its limitations for our purpose, and then in Section4.3we describe the methodology and algorithm to instantiate a power model for a specific device. Chapter 5describes the changes made to the power consumption model so it can be used as an APIto monitor power consumption at the source code level, as well as the changes that the framework does to an application source code.
Chapter6 shows the entire workflow of the final application. Every task is described, since the power model calibration to the test cases execution. For every task described we identify what the tool is expecting as input and what is expected to give as result (output).
In Chapter7 is where we show the results and consequent conclusions we took from them. We compare different results for different applications analyzed by our tool and explain how to interpret them.
Finally, in Chapter8we start by identifying the contributions and applications of our work, explain-ing how we answered the questions previously identified, and then we discuss about the conclusions we came to, as well as the future work we want to do.
2
S TAT E O F T H E A R T
2.1 S O F T WA R E D E V E L O P M E N T: M O N I T O R I N G T O O L S
Over the years, software development faced a challenge that still persists nowadays: monitoring. We can define monitoring as the act of inspecting how a piece of software executes. When monitoring a piece of software, we may be interested in understanding, for example, the memory usage that is made by it. The existence of monitoring tools began to be a necessity for developers, and so those tools started to emerge.
With the aid of monitoring tools, a developer may realize how a piece of software behaves, and is able to check if it is working as intended or not. If not, it has to be re-written or re-designed, but first the developer needs to find the error(s) he made in the source code in order to detect what he needs to change. This task of finding errors or faults is called debugging.
The necessity for monitoring and debugging tools has been realized several times in practice. One of its most well known instances is probably the GDB tool: Gnu Debugger1. This tool allows the developer to see what is going on ”inside” another program while it executes, or how a program executes until the moment it crashed. Figure2shows an example of this tool being used.
Debugging techniques can only assist developers in knowing what went wrong at a specific time in the program execution ( breakpoint). Indeed, they do not give further help in understanding the reason behind the errors (or unexpected behaviors). It would be of greater assistance if there was a way to know what was wrongly written in the code when a breakpoint is achieved.
In order to provide further assistance to developers, some research works focused on creating testing techniques and tools for different pieces of software. For example, in the context of Java programs, JUnit2 testing framework was developed. This tool allows the developer to write unit tests, which
are methods to test a set of one or more individual units of source code (typically methods of a Java class).
Unit testing gained big importance in software testing, specially in large-scale applications. As a consequence of this, several tools were developed using JUnit to run tests for one or more applications and get the results. A very good example is the GZoltar [7] tool. It is considered a fault localization tool (that means it is focused on finding possible errors in the source code): for every application it
1 More information about this tool:http://www.gnu.org/software/gdb/.
2.1. Software Development: Monitoring tools
Figure 2.: An example of an execution of the GDB tool
tests, the tool is able to determine the instructions that are most likely causing errors or faults. In order to do that, it runs several tests (previously written), and for each one it checks two things: the results of the test (passed, error or fault) and the set of instructions that were invoked.When all the tests end, it uses a technique calledSFL [1] to determine what are the instructions most likely to being faulty. Figure3shows the work that this tool does and how it shows the results.
2.1. Software Development: Monitoring tools
Monitoring, debugging and fault localization are not the only testing interests when talking about software testing. Sometimes developers also need to monitor the memory usage of an application. If we take the Haskell language as an example, there is a Heap Profiling tool3 that is able to detect memory leaks and helps the programmer to design software solutions more focused in saving memory resources. Figure4shows two graphs generated by this tool that indicate the amount of memory spent by a program. The left one shows the amount of memory spent before one modification to the code, and the second one is related to the same program but after that modification. The gainings are evident.
Figure 4.: A comparison of memory usage between two implementations of the same program (in Haskell)
Developers also have interest in testing the performance of their applications. If we look at a more abstract level, developers can simply compare alternatives for implementing the same functionality. For example, in the Java language we have a large set of alternatives when we want to save a set of objects of the same class (maps, lists or sets). There are situations when a list is better suited than a set, and developers use the System.nanoTime() method to check if search, insertion or removal in one of this structures is faster than the others. The structure of the code is almost the same in every case:
public class Main(){ ...
public static void main(){
long after = System.nanoTime();
//insert, remove or search something in a List, Map or Set
long final = System.nanoTime() - after; }
... }
Listing 2.1: Example of an use of nanoTime() method for performance analysis
This brief set of examples shown in this section already indicates that developers find monitoring tools useful and actually use them in practice. But with the growing interest in mobile devices, devel-opers are getting more interested in energy efficiency more than performance. In fact, this has already been proved [35].
2.2. Green Computing and energy profiling
Most recently, a new area of monitoring is gaining interest among the scientific community, related to software optimization in terms of energy consumption. It looks interesting at first because of the increasingly appearance of better and more sophisticated mobile devices, but when compared to debugging and fault localization, that have a big set of studies, tools and techniques well known, this area shows signs that is still a lot of work to be done. Section2.2and Section2.3describe the work that has been done in the past years, and some work being done at the moment.
2.2 G R E E N C O M P U T I N G A N D E N E R G Y P R O F I L I N G
Green Computingis a sub-area of computer science focused in the environmentally responsible use of computers and related resources. The interest of this area is to understand in which way minimizing the power consumption of different technological components, likeCPU’s, servers and peripherals, is possible.
During the last years, the research in this area was mostly focused in the hardware and in its opti-mization in terms of power consumption, due to the increasing necessity of managing great amounts of data. There is currently a concern of minimize power consumption in data centers [5,6] and telecom-munications systems [3], for example, and at a lower level hardware components, like processors or displays.
The software design and implementation, unfortunately, still today has not fully integrated the adoption of Green Computing. Software optimization is still a big concern, but it is always focused in reducing execution time (i.e., making the applications run faster). So, in addiction to the algorith-mic efficiency and complexity, there is not much more information available about the influence of software optimization related to energy consumption.
Nevertheless, when we talk about mobile devices the concern about energy-efficient software is much bigger, and that concern tends to get even bigger, since the work being done in the area is increasing. In fact, the number of accepted publications related to this research area in the last 18 months is much bigger than before that. This indicates that energy-efficient software is gaining a big interest among researchers at the moment.
The growing interest in this area has indeed some basis. The influence of software in the power con-sumption is clear. In fact according to some recent reports4, we can verify that the power consump-tion in a smartphone varies with different software system distribuconsump-tions, even in the same machine. So, this gives us a first (and good) indication that software has a major influence in mobile devices’ power consumption. But that is a bit abstract. Of course software is of major importance, but with this information alone we cannot quantify how much software influences the total amount of energy spent by a mobile device. And such a quantification is crucial to qualify software in terms of energy consumption.
4 These reports can be found at http://www.huffingtonpost.com/2011/11/11/ ios-5-battery-problemsapple-iphone_n_1088691.html and at http://www.fun47.com/ motorola-droid-razrrazr-maxxics-bug-fix-to-release-in-mid-august/.
2.3. Monitoring Energy Consumption in Mobile devices
It seems clear that there are several decisions taken during the analysis and implementation steps of the software development that will influence the way hardware acts. Those decisions are taken with the purpose of ease the job of the developers’, or because they rely on very internalized concepts that are not always the best to achieve the desired functionality of an application. These decisions do not take into account the impact they will have on the power consumption. It would be desirable to know the energy spent by an application at different execution times and associate those consumptions with different software components (like methods/functions, for example).
Some research works aimed to develop tools in order to understand where is the energy being spent in an application, some of them working as simple energy profilers (in other words, simply assigning consumption values to executing applications) and some giving information at a more fine-grained level. Those research works, as well as their applications, are explained in the next section. The works will be compared, and the advantages and disadvantages of using them for our purpose will also be discussed.
2.3 M O N I T O R I N G E N E R G Y C O N S U M P T I O N I N M O B I L E D E V I C E S
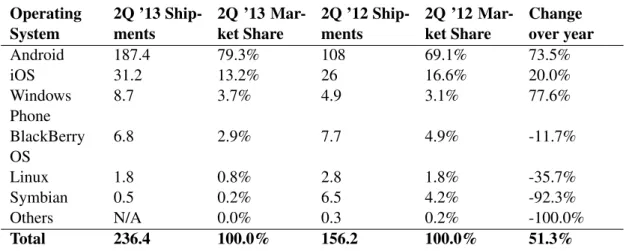
Several research works that were done in the last three years managed to show some interesting results in the mobile device energy consumption field. Almost every of them focus on the Android based mobile devices, mostly because it is an open source OS5 and statistics reveal that the percentage of selling is much higher for Android devices than any other6. In fact, in the second quarter of 2013 almost 80% of the market share belonged to Android devices, as Table3indicates.
Operating System 2Q ’13 Ship-ments 2Q ’13 Mar-ket Share 2Q ’12 Ship-ments 2Q ’12 Mar-ket Share Change over year Android 187.4 79.3% 108 69.1% 73.5% iOS 31.2 13.2% 26 16.6% 20.0% Windows Phone 8.7 3.7% 4.9 3.1% 77.6% BlackBerry OS 6.8 2.9% 7.7 4.9% -11.7% Linux 1.8 0.8% 2.8 1.8% -35.7% Symbian 0.5 0.2% 6.5 4.2% -92.3% Others N/A 0.0% 0.3 0.2% -100.0% Total 236.4 100.0% 156.2 100.0% 51.3%
Table 3.: Top Smartphone Operating Systems, Shipments and Market Share in 2013 (Units in Millions)
The oldest research work we found was PowerScope [20]. This tool was able to determine what fraction of the total energy consumed during a certain time period is due to specific processes in the
5 An Android overview can be found athttp://www.openhandsetalliance.com/Android_overview.html. 6 Information about global smartphone shipments can be found at http://techcrunch.com/2013/08/07/
2.3. Monitoring Energy Consumption in Mobile devices
system, using a profiler and an external power measurement tool. This work inspired other ones [34, 43], and so researchers started to study how to use the energy profiling idea in order to do a similar work in mobile devices, since they were rising in interest and usage.
There were a few different tools and studies that started to emerge in this area. Power Tutor [43] is an example of a tool7that came as a contribution of a research work. With this tool, it is possible to see, in a device using the AndroidOS, the applications executing and the (estimated) energy they are spending using different hardware components, such asCPUor 3G.
This tool started studying a new concept named power consumption model. A model consists in a set of components, in this case hardware components, like CPUorLCD. Is quite obvious that each component has a different weight in the device’s total power consumption per unit of time. At first sight, the Display (LCD) will spend much more energy than the GPS, for example, unless it is turned off, and theCPUwill spend more than the Wi-Fi in almost every case. So basically a power consumption model manages to map these different component states to different power consumption values (obtained using an external tool)8, and for every different device there is a different instance of the previously designed model. This kind of model considers something called utilization-based power behavior (i.e the consumption related to the concrete utilization of an hardware component), and Power Tutor [43] has three instances of it, for three different mobile devices, but also described a way to create (not so accurate) models without using an external measurement device.
One thing to know about hardware components is that they have something called the tail power states: they stay at a high power consumption state for a period of time after they are used. This is often called no-utilization-based power consumption, and that is something the normal application developer cannot manage or alter, but has a significant importance in the final power consumption.
A research work [34] studied and discussed in more detail the problem of the no-utilization-based power consumption, and the authors of the study also came up with another tool. This tool manages to trace system calls and relate them to power state transitions and corresponding power consumptions, in order to tell the application developers what was consuming the most energy, in a similar way to Power Tutor [43], but it has no power model instances for devices, so the first time someone would like to use this tool it would be needed to have an external power measurement device in order to run a stress application for each hardware component and instantiate the model.
The power consumption model concept has been widely explored in the context of mobile battery-powered systems for the last years.The same authors of [34] came up with a new study [33] about a year later, intended to help developers identify where the energy was being spent inside an application (what hardware component was the application using in a time interval and how much energy was spent).
Several other ideas have already emerged having this last two ([33,34]) as a basis. Sesame [16] is an example: a tool to automatically create power consumption models. It is quite accurate, since it gives
7 Powertutor application website:https://powertutor.org.
8 A widely known device, used for the referred tool and for most of others referred in this thesis, is available athttp: //www.msoon.com/LabEquipment/PowerMonitor.
2.3. Monitoring Energy Consumption in Mobile devices
95% accuracy in consumptions taken with 1 second sampling interval, and 88% with 10 milliseconds, although it does not consider the same components of Power Tutor and is not able to relate energy consumption to specific applications or processes.
Although most of the previously referred works have significant resemblances between them, there is always room for improvement, and researchers have found a way to keep exploring the power consumption concept. By searching a little more, we have found a considerable set of other works in this area, all of them related to power consumption modeling. DevScope[22] is another example of a tool appearing as a contribution to a work done in relation to power consumption modeling, and provides support to another one, AppScope [41], that works and executes in a similar way to Power Tutor: gives information about the energy consumption of Android applications. Basically, DevScope has a power consumption model and instantiates it for the device in use, and then AppScope uses that model instance to give power consumption estimations, much like the relation between Power Tutor and Power Booter [43].
Although AppScope and PowerTutor seem identical since the power models are so similar, they have a few differences. AppScope works as a Linux kernel module, and so traces the kernel function calls, and gets the data from the device in a process level, while Power Tutor works as a standard An-droid application and gets the data in an application level. Besides, AppScope has different granularity levels for each hardware component.
Several other examples of works based on power consumption models and its applications in differ-ent areas came up ever since ([10,24,25,42]), however none of them is as powerful as the remaining ones. Another interesting example, SEMO [15], has a similar behavior to Power Tutor, but does not use power consumption models. Instead, it is focused in battery discharge level, and its results are less reliable and accurate.
In a more recent work (December 2013), the same authors of AppScope [41] introduced User-Scope [23], a framework designed to collect energy usage data associated to a specific kind of user. It works in a similar way to AppScope, but its goal is to give information about what the normal user of an Android mobile device does with it and where does he spend the energy.
As we could see, there is obviously a growing concern about monitoring power consumption in mobile devices. Developers are becoming more and more interested in applications’ energy consump-tion, as we have already referenced [35]. But even with the growing concern and interest in energy consumption optimized software, the fact is that the available tools are too similar to each other. They show the developer the amount of energy being spent at different execution times, and in some cases they divide that amount of energy for different applications. But developers want more that that. They want to test their own application, and see where they can (most likely) improve in order to optimize the energy consumption of their application.
Some recent works in this area presented interesting studies and tools. Some of them [12, 32] demonstrate that it is possible to have different values of energy consumption for different softwares designed to do the same tasks, or even for the same software with different implementation techniques.
2.3. Monitoring Energy Consumption in Mobile devices
The idea that software running in mobile devices can eventually be optimized to consume less energy starts to be very well assimilated at this point with the references presented until here. Based in this assumption, other studies tried a different approach in the pursuit of energy-leaks. There is a good example of a recent empirical study [30] that was developed in order to identify what were the most energy-greedy APIs or their usage patterns used in Android applications, using an external measurement device to get the most reliable values.
Some researchers began to worry about the influence that software security policies could have in power consumption. An interesting research work [38] had the goal to understand if code obfuscation, an approach used by mobile developers for preventing software piracy, could significantly increase power consumption. This study proved that such policy did not affect power consumption in such a way that it could be considered.
Many different areas are now starting to show interest in the influence that applications could have in power consumption. Even in software testing researchers wanted to minimize the energy con-sumed [29], by developing a technique that successfully minimizes the test suites, and makes the testing phase consume up to 95% less energy while maintaining the coverage.
The last work [28], perhaps the most interesting, tried to go deeper and calculate source line level energy information for Android applications. It is still an empirical study, with some flaws in precision since they used an external device with a sampling interval considerably smaller than the precision needed for single instructions, but shows interesting results and reflects the increasing interest this area has.
Even with such a large set of research works identified, the feeling we get is that there is much more we can do in this area. For example, how can one developer automatically test the energy efficiency of an application he developed? How can we be sure that a code fragment used too much energy and not exactly the one it needs? Is it somehow possible to have good and accurate results for measuring without using an external measurement device? There is a lot of unanswered questions, and we intend to answer as much as we can with this thesis.
One thing seems clearer than the others: developers show interest in a tool to help them design energy efficient applications. But we don not think that they they should be obligated to use an external and really expensive measurement device. Even Google is trying to help developers in this task9
Given the need to choose a tool that we could use for our goals and the fact that most of them only work with an external device, we decided to choose Power Tutor so we could use its power consumption model and transform it into anAPI, as desired.
9 A tool called Project Volta will let programmers dig into application power us-age with Android’s debugging tools: http://arstechnica.com/gadgets/2014/07/ examining-project-volta-we-put-Android-l-through-our-battery-test/.
2.4. The selected tool: Power Tutor
2.4 T H E S E L E C T E D T O O L: P O W E R T U T O R
Power Tutor is an open source Android application, developed under a PhD project at the Michigan University, USA. It allows the user to know as estimation of the power consumption values of all the applications that are executing at the moment, divided by different hardware components, and updates the consumption values in one second intervals. The hardware components included in the Power Tutor model are:CPU,LCD, Wi-Fi, 3G,GPSand Audio.
This tool has three model instances created using an external measurement device, the Monsoon Power Monitor , but is designed in a way that including new instances can be done almost with no difficulty at all.
In a nutshell, the tool is able to calculate the consumption of every one of those components and show the results associated to different applications, as long as it has a power consumption model it can use. Figure5shows an example of an execution of Power Tutor, and Table4is an example of a power model instance. This tool and the model will be explained in more detail in Chapter4, along with a technique described by Power Tutor’s authors that can be used to create instances of the model for any device, without using the external measurement device.
Figure 5.: Power Tutor execution views (reprinted from [43])
In order to determine what hardware component is an application using (and for how long) at a specific time, Power Tutor uses information from the file system. Since Android is based on Unix, this information is usually located at the /proc directory (and sub-directories). With the information about the total utilization and utilization per application of every hardware component, the tool can use the power consumption model to determine the power consumption per application.
2.4. The selected tool: Power Tutor
Model (βuh×f reqh+βul×f reql) ×util+βCPU×CPUon+βbr×brightness+βGon× GPSon+βGsl×GPSsl+βWi−Fil×Wi−Fil+βWi−Fih×Wi−Fih+β3Gidle× 3Gidle+β3GFACH×3GFACH+β3GDCH×3GDCH
Component Variable Range Power Coefficient
CPU
util 1-100 βuh: 4.34 βul: 3.42 f reql, f reqh 0,1 n.a.
CPU on 0−1 βcpu: 121.46
Wi-Fi
npackets,Rdata 0−∞ n.a.
Rchannel 1-54 βcr
Wi−Fil 0,1 βWi−Fi l : 20 Wi−Fih 0,1 βWi−Fi h: 720 Audio Audio on 0,1 βaudio: 384.62 LCD brightness 0-255 βbr: 2.40
GPS GPS on 0,1 βGon: 429.55
GPS sl 0,1 βGsl: 173.55
3G
data rate 0−∞ n.a. downlink queue 0−∞ n.a. uplink queue 0−∞ n.a.
3Gidle 0,1 β3G idle: 10
3GFACH 0,1 β3G FACH: 401
3GDCH 0,1 β3G DCH: 570
3
T H E P R O B L E M A N D I T S C H A L L E N G E S
In the work described in this thesis, we address the problem of relate power consumption with the source code of android applications. That is to say that we wish to develop a methodology to identify energy consumption of source code fragments. Source code fragments can be methods, loops or conditional blocks (ifs), for example.
We knew beforehand that whatever values of power consumption we could provide would not be the exact real values. Indeed, we would always be providing estimated values, so our tool should execute an Android application more than once, and normalize the individual values.
Furthermore, our intention was to implement our methodology in a debugging tool, not an energy profiler. Debugging means findings bugs, errors or faults inside the source code, and the techniques used for debugging are not absolutely reliable. That is to say that not matter how good a debugging tool is it will always indicate instructions (or code fragments) most likely to be faulty, but not with 100% certain. What we did in our approach was to treat energy consumptions as possible faults (if classified as excessive).
Knowing that software power consumption analysis is a recent research area, we can say that the amount of documented information in papers, journals and so forth is considerably less when com-pared to other research areas (once again, debugging for example). This obviously helped us knowing what has been done, and more important what is being done at the moment and will be done in the future. In the time period available for this project (one year) is very difficult to create a tool from scratch based only in documentation.
In fact, it was crucial to choose a tool previously developed that was able to somehow give us values of energy consumption and could be used for our goals. We could not find a generic tool, like a library with an implemented API, that we could use for our desired purpose, so we had to adapt an existing one. Although there is not a framework that we could use, we found some tools with a behavior similar to an energy profiler. The most interesting energy profilers used an external (and really expensive) measurement device, that could measure power consumption with a very high update frequency, enabling a very short sampling interval. The high cost of this device is something we could not afford, so the tools which needed this device were discarded. Probably the biggest challenge of this thesis was finding a tool we could use and adapting it to our purpose.
All tools had their limitations. Some of the limitations were properly documented, for example the fact that power consumption models needed to be instantiated for a specific device, but not all of them were. As we said before, we used Power Tutor for our purpose, and the biggest limitations of this tool could only be found after we started using it.
We had to face a problem that was common to basically all of the tools, and Power Tutor was not an exception: the sampling interval. This interval is the time that the tool needs to wait until measure power consumption again. In Power Tutor, this interval was one second, and it was something we could not overcome.
The power model coefficients were calculated per unit of time (one second). That is the reason why the values are presented inmW(1mW =1mJ/s). For example,CPUcan work with a frequency of FMHz, and so there is a power coefficient C for that frequency. That coefficient indicates that, if the
CPUstays at the F frequency for one second, it spends approximately CmW. This cannot be changed, since the tool is implemented with this idea and was designed to give values for one second granularity. This was a huge drawback for us, and we needed to rethink the way we wanted to implement our tool. The decision of what code fragments we should analyze had to be made. We knew that analyz-ing sanalyz-ingle instructions (like attributions, arithmetic or boolean expressions) was impossible with the resources we had. If an instruction is too simple (like int a = 1;) we would not have the necessary precision. With our one second sampling interval, we would not be able to even analyze consumption per methods, but we still wanted to give the developer information about them. To do it, we needed to turn our attention to consumption per test. Knowing that a test is a sequence of method calls, the idea behind the consumption per test concept is that it would be needed for the application to run a set of previously written tests, and it would be needed to determine the consumption in every one of them.
From the beginning we wanted to implement our methodology in a tool/framework that could auto-matically do the analyzes. Every single task needed to be automatic represented a challenge we had to overcome. We had to study how an application and test projects could be compiled/built into a singleAPKfile, how to install that file in a device and how to automatically run tests over an appli-cation.These challenges were a bit easier to overcome. We achieved all of this simply by reading the Android developers manual1.
The most important (but probably easiest) challenges were to decide what metric would we use to determine if there was as excessive consumption or not (in other words, what value would we consider to compare the energy efficiency between tests), and how to save, retrieve and show the information we get from testing an application.
All the solution we came to, as long as the different ones we tried, are explained in the following chapters.
Part II
4
P O W E R C O N S U M P T I O N M O D E L
In this chapter, we start by discussing in Section4.1the Android power consumption model presented in [43]. This is a statically calibrated model that considers the energy consumption of the main hard-ware components of a mobile device. In Section4.2, we describe how is it possible to create instances of the model to different devices (calibration), and then in Section4.3 we present an algorithm for the automatic calibration of that model, so that it can be automatically ported to any Android based device.
4.1 T H E A N D R O I D P O W E R T U T O R C O N S U M P T I O N M O D E L
Different hardware components have different impact in a mobile device power consumption. As a consequence, an energy consumption model needs not only to consider the main hardware compo-nents of the device, but also its characteristics. Mobile devices are not different from other computer devices: they use different hardware components and computer architectures that have completely dif-ferent impact on energy consumption. If we consider theCPU, different mobile devices can use very differentCPUarchitectures (not only varying in computing power, but also, for example, in the num-ber of CPUcores), that can also run at different frequencies. The Android ecosystem was designed to support all different mobile (and non-mobile) devices (ranging from smart-watches to TVs). As a result, a power consumption model for Android needs to consider all the main hardware components and their different states (for example,CPUfrequency, percentage of use, etc).
There are several power consumption models for the Android ecosystem [16,22,25,41,43], that use the hardware characteristics of the device and its possible states to provide a power model. Next, we briefly present the Power Tutor model: a state-of-the-art power model for mobile devices [16]. This model currently considers six different hardware components: Display, CPU, GPS, Wi-Fi, 3G and Audio, and different states of such components, as described next.
C P U : CPUpower consumption is strongly influenced by its use and frequency. The processor may run at different frequencies when it is needed, and depending on what is being computed the percentage of utilization can vary between 1 and 100; There is a different coefficient of consumption for each frequency available on the processor. The consumption of this component at a specific time
4.1. The Android Power Tutor Consumption Model
is calculated by multiplying the coefficient associated with the frequency in use with the percentage of utilization.
L C D : TheLCDdisplay power model considers only one state variable: the brightness. There is only one coefficient to be multiplied by the actual brightness level, that has 10 different values.
G P S : This component of the power model depends on its mode (active, sleep or off). The number of available satellites or signal strength end up having little dependence on the power consumption, so the model has two power coefficients: one to use if the mode is active and another to use if the mode is sleep.
W I-F I : The Wi-Fi interface has four states: low-power, power, low-transmit and high-transmit (the last two are states that the network briefly enters when transmitting data). If the state of the Wi-Fi interface is low-power, the power consumption is constant (coefficient for low-power state), but if the state is high-power the power consumption depends on the number of packets trans-mitted/received, the uplink data rate and the uplink channel rate. The coefficient for this state is calculated taking this into account.
Figure 6.: Wi-Fi interface power states (reprinted from [43])
3G : This component of the model depends on the state it is operating, a little like the Wi-Fi
com-ponent. The states are CELL DCH, CELL FACH and IDLE. The transition between states depends on data to transmit/receive and the inactivity time when in one state. There is a power coefficient for each of the states.
4.2. Static Model Calibration
A U D I O : The audio consumption is modeled by measuring the power consumption when not in use and when an audio file is playing at different volume, but the measures indicate that the volume does not interfere with the consumption, so it was neglected. There is only one coefficient to take into account if the audio interface is being used.
4.2 S TAT I C M O D E L C A L I B R AT I O N
In order to determine the power consumption of each Android device’s component the power model needs to be “exercised”. That is to say, we need to execute programs that change the variables of each components state, for example, by setting CPUutilization to highest and lowest values, or by configuringGPSstate to extreme values by controlling activity and visibility ofGPSsatellites, while measuring the energy consumption of the device. By measuring the power consumption while varying the state of a component, it is possible to determine the values (coefficients) to include in a specific instantiation of the model for a device.
Power Tutor, as all other similar power models, uses a static model calibration approach: the pro-grams are executed in a specific device (which is instrumented in terms of hardware) so that an ex-ternal energy monitoring device1is used to measure the power consumption. Although this approach produces a precise model for that device [43], the fact is that with the wide adoption of the Android ecosystem makes it impossible to be widely used2. Indeed, the model for each specific device has to be manually calibrated! We intended to develop this functionality in the final tool.
4.3 P O W E R M O D E L: D Y N A M I C C A L I B R AT I O N
Once again we remember that we could not fully test the dynamic calibration due to the unavailability of the training applications throughout the entire duration of this project. So, Section.4.3will describe our approach to implement dynamic calibration, along with the algorithm used, and the only thing missing to include this functionality in our tool is, in deed, the test applications of each hardware component .
In order to be able to automatically calibrate the power consumption model of any Android device, we consider a set of training programs that exercises all hardware components of the power model. The training programs also change (over its full range) the state of each component, while keeping the other constant. In this way, we can measure the energy consumption by that particular component in that state. To measure the energy consumption, instead of using an external monitoring device as discussed before, we consider the battery consumed while running the training applications. The Android API provides access to the battery capacity of the device, and to the (percentage) level of the battery of the devices. By monitoring the battery level before and after executing a training application,
1 A widely used device is available athttp://www.msoon.com/LabEquipment/PowerMonitor. 2 In fact, [43] reports the calibration of the power model for three devices, only.
4.3. Power Model: Dynamic Calibration
we can compute the energy consumed by that application. Figure 8 shows the architecture of the dynamic calibration of the power model.
CPU LCD WIFI ... 4,3; 3,4 2,4 121; 20 ... POWER MODEL INSTANCE
β
freq1;β
freq2β
brβ
wifi_l;β
wifi_h ... POWER CONSUMPTION MODEL TRAINING APPS ANDROID DEVICE CALIBRATION APP CPU LCD WIFI ...Figure 8.: The architecture to dynamically calibrate the power model for different devices
The calibration process shown in Algorithm1executes the set of calibration applications in a spe-cific device. To summarize, the algorithm starts by getting the full capacity of the device’s battery. Since every component has multiple possible states (e.g., CPU with different frequencies), every training program has an finite number of execution states that will be executed. Then, every state is executed N times, in order to get an arithmetic mean of the consumption. This makes the results more reliable. This algorithm returns a collection of energy consumption coefficients, one per state of every hardware component. The generic power model presented in the previous section is then instantiated.
The coefficients of the power model are presented inmW since it is the power unit considered by Power Tutor, and are used to compute the energy consumption of an Android application. For example, when the CPU component is in a known state (i.e., running at a certain frequency, with a known percentage of use), then the power model computes the current energy consumption as an equation of those coefficients.
The Android energy consumption model used by Power Tutor is implemented as stand alone ap-plication, which indicate the (current) energy consumption of other application running in the same device. In the next section, we present our methodology to use our models in an energy profiling tool for Android application developers.
4.3. Power Model: Dynamic Calibration
Algorithm 1 Calculate power model coefficients N←20
capacity← GETBATTERYCAPACITY(); for allprog : trainingProgsSet do
for allstate :GETSTATES(prog)do
CLEAR(consumptions) fori=1 to N do
be f ore← CHECKBATTERYSTATUS() EXECUTE(prog, state)
a f ter←CHECKBATTERYSTATUS()
consumptions←consumptions∪ {(a f ter−be f ore) ∗capacity} end for
avgConsumed ←AVERAGE(consumptions, N)
coe f f icients←coe f f icients∪ {(state, avgConsumed)} end for
end for
5
E N E R G Y C O N S U M P T I O N I N S O U R C E C O D E
Modern programming languages offer powerful compilers, that include advanced optimizations, which allow us to develop efficient and fast programs. Such languages also offer advanced supporting tools, like debuggers, execution and memory profilers, so that programmers can easily detect and correct anomalies in the source code of their applications.
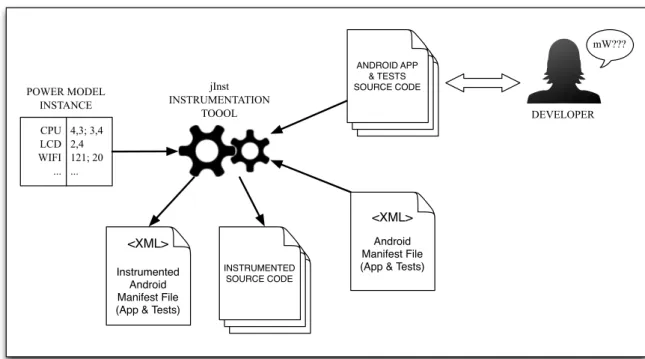
In this chapter, we present one methodology that uses/adapts the (dynamic) power model defined in the previous chapter, to be the building block of an energy profiling tool for Android applications. The idea is to offer Android application developers an energy profiling mechanism, very much like the one offered by traditional program profilers [36]. That is to say that we wish to provide a methodology, and respective tool support (developed in Java), that automatically locates in the source code of the application being developed the code fragments responsible for an abnormal energy consumption.
Our methodology consists of the following steps:
• First, the source code of the application being monitored is instrumented with calls to the cali-brated power model. Figure9displays this step.
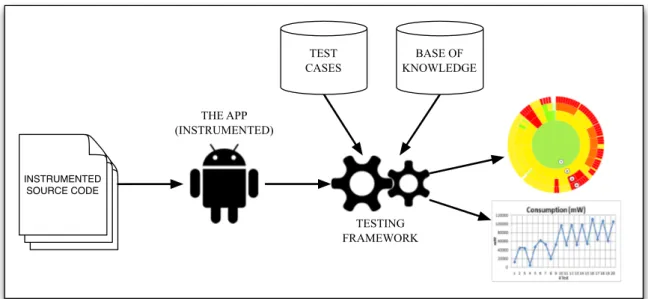
• After compiling such instrumented version of the source code, the resulting application is exe-cuted with a set of test cases.
• The result of such executions are statistically analyzed in order to determine which packages/meth-ods are responsible for abnormal energy consumptions.
The source code instrumentation and execution of test cases is performed automatically as we describe in the next sections. To instrument the source code with calls to the power model, we need to model it as anAPI. This is discussed first in Section5.1.
5.1 T H E M O D E L A S A N A P I
In order to be able to instrument the source code of an application with energy profiling mechanisms, we needed to adapt the current implementation of the power model described in Section2.4. That power model [43] is implemented as a stand alone tool able to monitor executing applications. Thus,
5.2. Source Code Instrumentation INSTRUMENTED SOURCE CODE ANDROID APP & TESTS SOURCE CODE mW??? DEVELOPER CPU LCD WIFI ... 4,3; 3,4 2,4 121; 20 ... POWER MODEL INSTANCE jInst INSTRUMENTATION TOOOL <XML> Android Manifest File (App & Tests) <XML>
Instrumented Android Manifest File (App & Tests)
Figure 9.: The behavior of the instrumentation tool
we needed to transform that implementation into anAPI-based software, so that its methods can be reused/called in the instrumented source code.
To adapt the Power Tutor implementation, we introduced a new Java class called Estimator that implements the methods to be used/called by other applications and respective test cases. Those methods work as a link interface between the power consumption model and the applications source code to be monitored.
The methods implemented in our Estimator class that are accessible to other applications are: • traceMethod(): The implementation of the program trace. With this method we are able to
save the method every time it is invoked.
• saveResults(): store the program trace/energy profile results in persintent storage(files). • start(): start of the energy monitoring thread.
• stop(): stop of the energy monitoring thread.
5.2 S O U R C E C O D E I N S T R U M E N TAT I O N
Having updated the implementation of the power model so that its energy profiling methods can be called from other applications, we can now instrument an application source code to invoke them.
In order to automatically instrument the source code, we need to define the code fragments we would like to monitor. Because we wish to do it automatically, that is by a software tool, we need
5.2. Source Code Instrumentation
to precisely define which fragments will be considered. If we consider too small code fragments (for example, a line in the source code), then the precision of the power model may be drastically affected: a neglected amount of energy would probably be consumed. In fact, there is not a tool that we can use that is capable of giving power consumption estimates at a so fine-grained level, with reliable results. On the other hand, we should not consider too large fragments, since this will not give a precise indication on the source code where an abnormal energy consumption exists.
We choose to monitor application methods, since they are the logical code unit used by program-mers to structure the functionality of their applications. To automate the instrumentation of the source code of an application we use the Java Parser tool1: it provides a simple Java front-end with tool support for parsing and abstract syntax tree construction, and the corresponding generic traversal and transformation mechanisms.
We developed a simple instrumentation tool, called jInst, that instruments all methods of all Java classes of a chosen Android application project, together with the classes of an Android test project. This tool was later easily included in the Green Droid tool (the energy profiler we developed). When instrumenting the source code of the application, jInst injects new code instructions, at the beginning of the method and just before a return instruction (or as the last instruction in methods with no return), as shown in the next code fragment:
public class Draw{ ...
public void funcA(){
Estimator.traceMethod("funcA", "Draw", Estimator.BEGIN); // Original code of funcA here
Estimator.traceMethod("funcA", "Draw", Estimator.END); }
Listing 5.1: Example of an utilization of traceMethod
This code injection allows the final framework to monitor the application, keeping trace of the methods invoked and energy consumed.
The instrumentation was implemented using a traditional compiler approach. Recent techniques, like aspect oriented programming [9], seem very adequate to implement the instrumentation as well, but we choose the traditional approach since the available technologies an techniques were better known to us.
It is important to refer that not only the Java source code is instrumented. Since Android uses many
XMLto define, among other things, the name of the project, the version of theAPIused, the name of the test runner, etc., we used the standard JavaXMLparser (DOM parser)2 as well, in order to edit some necessary definitions, which are:
1 Java Parser framework webpage:https://code.google.com/p/javaparser.
2 More information about DOM parser can be found here:http://docs.oracle.com/javase/tutorial/jaxp/ dom/readingXML.html.
5.3. Automatic Execution of the Instrumented Application
• The name of the project (both for application and test project): this is needed so if the instru-mented projects are opened in Eclipse IDE they do not get name conflict with the original projects.
• The list of permissions given to the application (for the application project): needed to execute the Power TutorAPI.
• The test runner (for the test project): the JUnit test runner needs to be different than the one by default. In the next chapter will be explained why.
So, after instrumenting the source code of the application, jInst also edits the Android Manifest file of both the application and test projects.
5.3 A U T O M AT I C E X E C U T I O N O F T H E I N S T R U M E N T E D A P P L I C AT I O N
After compiling the instrumented source code an Android application is produced. When executing such application energy consumption metrics are produced. In order to automatically execute this application with different inputs, we use the Android testing framework3that is based on jUnit.
In order to use the instrumented application and the developed Estimator energy class, the appli-cation needs to call methods start and stop before/after every test case is executed. Both jUnit and Android testing framework allow test developers to write a setUp() and a tearDown() methods, that are executed after a test starts and after a test ends, respectively. So, our jInst tool only needs to instru-ment those methods so we can measure the consumption for each test, as shown in the next example:
public class TestA{ ...
@Override
public void setUp(){ Estimator.start(uid); ...
} ... @Override
public void tearDown(){ Estimator.stop(); ...
}
Listing 5.2: The changes made by jInst to test classes
With this approach, we assure that every time a test starts, the method Estimator.start(int uid) is called. This method starts a thread that is going to collect information from the operating system and


![Figure 5.: Power Tutor execution views (reprinted from [43])](https://thumb-eu.123doks.com/thumbv2/123dok_br/17660307.824489/28.892.237.705.559.936/figure-power-tutor-execution-views-reprinted.webp)