–
Evaluation of airborne particulate matter pollution in
Kenitra City, Morocco
doi: 10.4136/ambi-agua.1042
Mounia Tahri1*;Moussa Bounakhla1; Mustapha Zghaïd2; Yves Noack3; Fouad Benyaïch2; Abdelfettah Benchrif1
1
National Center of Energy. Sciences and Nuclear Techniques (CNESTEN), DASTE Department, Unity of Pollution and Geochemistry, Rabat, Morocco 2
Department of Physics. Faculty of Sciences. University Moulay Ismail, Meknes, Morocco 3
CEREGE. Aix-Marseille University, CNRS IRD, CdF - BP 80 - 13545 AIX en Provence Cedex 4 – France
*Autor correspondente: e-mails: [email protected],
[email protected], [email protected], [email protected],[email protected],
ABSTRACT
Two size fractions of atmospheric particulate matter < 2.5 µm and 2.5-10 µ m were collected in Kenitra City from February 2007 to February 2008. The sampling was done using a Gent Stacked sampler on nuclepore polycarbonate filters and the collected filters were analyzed using Total Reflection X-Ray Fluorescence (TXRF) and Atomic Absorption Spectroscopy (AAS). The particulate matter trends show higher concentrations during the summer as compared to other seasons. The highest concentrations were obtained for Ca in coarse particles and Fe for fine particles. However, the lowest concentrations were observed for Cd in both particulate sizes. The principal component analysis (PCA) based on multivariate study enabled the identification of soil, road dust and traffic emissions as common sources for coarse and fine particles.
Keywords: X-ray fluorescence, cluster analysis, principal component analysis.
Avaliação da poluição de material particulado de aviação em
Kenitra, Marrocos
RESUMO
1. INTRODUCTION
Air pollution has become a matter of global concern because of its impact on human health and environmental quality. The awareness of air pollution has led to numerous studies on the chemical composition of ambient aerosols and the determination of pollution sources. Atmospheric aerosols influence many atmospheric processes and have adverse human health effects, affecting both the respiratory and cardiovascular systems (Laden et al., 2000; Michael and Daniel, 2005; Ruzer and Harley, 2004; Li et al., 2009).
A major component in air urban pollution is particulate matter (PM) which can be coarse or fine. Coarse particles can be regarded as those with a diameter ranging from 2.5 to 10 m (PM2.5-10); and fine particles less than 2.5 m (PM2.5). Coarse particles usually contain materials from the earth’s crust and dust from vehicles and industrial plants; while fine particles contain the secondary formed aerosols, combustion particles and re-condensed organic and metallic vapours (Jacobson, 2002).
The chemical characterization of particulate matter could be elaborated using many multi-elemental techniques. Non-destructive nuclear and related analytical techniques such as X ray fluorescence analysis (XRF) have already proven to be well suited for the routine analysis of aerosols samples (Chueinta et al., 2000; Biswas et al., 2003; Cohen et al., 2004; Kim Oanh et al., 2006; Santoso et al., 2008). It provides multi-element capability needed in creating databases to be used for assessing air pollution, source apportionment or time-trend assessments. This ability to quickly and efficiency produce large data sets for statistically characterizing and fingerprints pollution sources as well as estimating different source contributions is critical to the understanding of air pollution.
In Morocco, air pollution is not well estimated. The existing studies have a local character. These studies were initiated in the beginning of the 90s by the Department of Environment in the cities which suffer significantly from atmospheric pollution (Morocco, 2000; 2001; 2002; 2003). Therefore, the present paper will present the main results of the analyses of particulate matter (coarse and fine particles) samples in Kenitra city. An evaluation of the probable sources of emission in the studied area will also be presented.
2. MATERIAL AND METHODS
2.1. Sampling
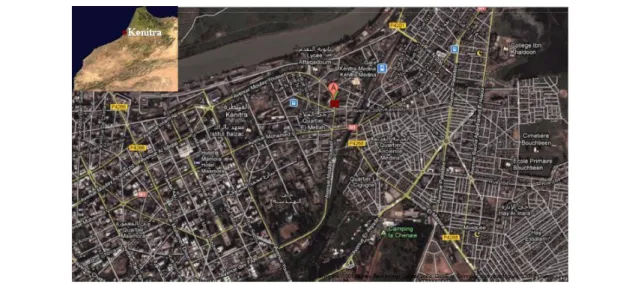
The Gent stacked filter unit sampler (Hopke et al., 1997) has been used for the collection of fine (< 2.5 m) and coarse (2.5 - 10 m) particles on Nuclepore polycarbonate filters of 8 m and 0.4 m pore size, respectively. Samples were collected at an average flow rate of 16 lpm for a sampling period of 24 hours. The sampler was placed near a bus station (Figure 1) located in the center of Kenitra city. There is a very high volume of motor traffic at this site, and it includes a parking for buses and many "big taxis". It is also bordered by railway. The samplers were installed in a courtyard, separated from vehicles by a wall about 3 m high.
Figure 1. Location of the sampling site (noted as ‘A’ in the map) in Kenitra City.
2.2. Sample Preparation and Analysis
Multi-elemental analysis of filter samples was performed by Total X-Ray Fluorescence (TXRF). This technique needs to bring into solution the samples to be analyzed. Accordingly, the loaded filters were decomposed with 10 ml on concentrated HNO3 in a microwave oven during time 30 min. After decomposition and complete cooling of the solutions, 50 µg of Selenium were added to each sample as internal standard, and aliquots of 25 µ l were placed onto quartz carriers for TXRF measurements.
The TXRF system employed is that installed in the National Centre of Energy, Sciences and Nuclear Techniques (CNESTEN) in Morocco. This module is equipped with a 2 kW-power fine-focus X-ray tube with a molybdenum anode usually operating at 30 mA and 50 kV. The X-ray beam is monochromatized by use of a multilayer (W/C) crystal. The fluorescent X- rays of the sample are detected by a Si(Li) detector with a resolution of 165 eV at 5.9 keV and then analyzed by a Canberra S100 multi-channel analyzer card coupled to a computer for data storage and analysis. To complete this study, we used the Atomic Absorption Spectroscopy (AAS), available in the European Centre for Research and Teaching Environmental Geosciences (CEREGE) in Aix en Provenance in France, to evaluate the contents of Al and Na.
2.3. Statistical Analysis
3. RESULTS AND DISCUSSION
3.1. Concentration Level of Particulate Matter
The summary of the coarse and fine particulate matter collected at the sampling site during the studied period is presented in Table 1. The average mass concentration of coarse and fine particulates were 110.42 (g m-3) and 50.73 (g m-3) and the highest concentration was equal to 196 (g m-3) and 86 (g m-3), respectively. The time series plots of the particulates in both size particles are presented in Figures 2 and 3.
Table 1. Statistical summary of the coarse and fine particulate matter mass concentration at Kenitra city during the studied period.
Parameter PM2.5-10 (g m-3) PM2.5 (g m-3)
Mean 110.42 50.73
Median 115.12 51.32
S.D. 37.61 12.33
Maximum 195.79 85.68
Minimum 33.18 30.35
N° of samples 63 63
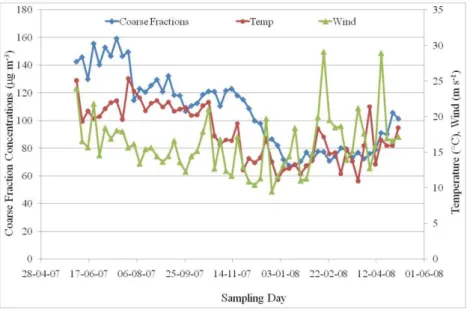
The time series plot indicates that the monthly concentrations of PM2.5-10 during the winter samplings decrease significantly by half from December to January (< 67 g m-3), followed by a large increase at the beginning of the dry season (from 04/06/07 to 04/11/07) with concentrations ranging between 106.8 and 159.24 g m-3. This seasonal trend could be attributed, in part, to the meteorological conditions. In fact, it was found that the higher values of PM2.5-10 correspond to higher temperatures and lower wind speed values and vice versa (Figure 2).
Figure 2. Variations of concentrations of coarse particulates in function of metrological parameters (wind and temperature) at Kenitra site.
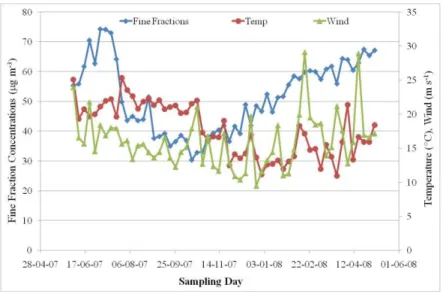
the fine particles show a relatively stable profile with two significant peaks: the first from 10/06/2007 to 22/07/2007 and the second from 30/03/2008 to 11/05/2008 with concentrations of (55.83 - 64.18 g m-3) and (64.34 - 70.47 g m-3), respectively. Nevertheless, no significant correlation was found between the concentrations of PM2.5 and the meteorological conditions as it can be observed in Figure 3.
Figure 3. Variations of concentrations of fine particulates in function of meterological parameters (wind and temperature) at Kenitra site.
3.2. Metal concentrations in particulate matter
The results of elemental concentrations obtained for PM2.5 and PM2.5-10 and their standard deviations are presented in Table 2. The mean values presented in Table 2 are obtained from a data set of 63 samples. Twelve elements were determined for all the samples in coarse and fine particles; average concentrations of various elements range from few ng m-3 (ex. Cd) to thousands of ng/m3 (ex. Ca and Fe).
Table 2. The mean and standard deviations of elemental concentrations of coarse and fine particulate matter at Kenitra site.
Parameter PM2.5-10 (ng m
-3
) PM2.5 (ng m-3)
Mean S.D. Mean S.D.
Al 1848.34 267.48 140.07 51.19
Ca 11300.40 2016.81 1040.32 169.18
Cd 1.98 0.25 2.23 0.29
Cr 60.53 9.75 81.38 10.47
Cu 144.30 27.08 239.53 24.77
Fe 2051.10 183.07 1938.56 227.20
K 1431.52 250.35 397.20 43.43
Mn 70.16 6.95 20.54 3.44
Na 2706.72 225.02 587.91 70.18
Figure 4 shows a comparison of elemental concentrations in fine and coarse particles at Kenitra site. From this diagram , we can observe that, for both fine and coarse particles, Cd is the element with the lowest concentration; however, the highest concentration was recorded for Fe in fine particles and Ca in coarse particles. A comparison of the metal concentrations in both particles indicates that the elements of crustal origin (Ca, Na, K, Al and Mn) are more prevalent in coarse than fine particulates. However, the elements from anthropogenic sources (Cd, Ni, Pb, Cd, Zn and Cr) are more prevalent in fine particulates.
Figure 4. Comparison of metal contents in fine and coarse particles at Kenitra site.
3.3. Multivariate analysis
In order to get some insight about the sources of metals and the main correlations among them, Cluster Analysis (CA) and Principal Component Analysis (PCA) were applied.
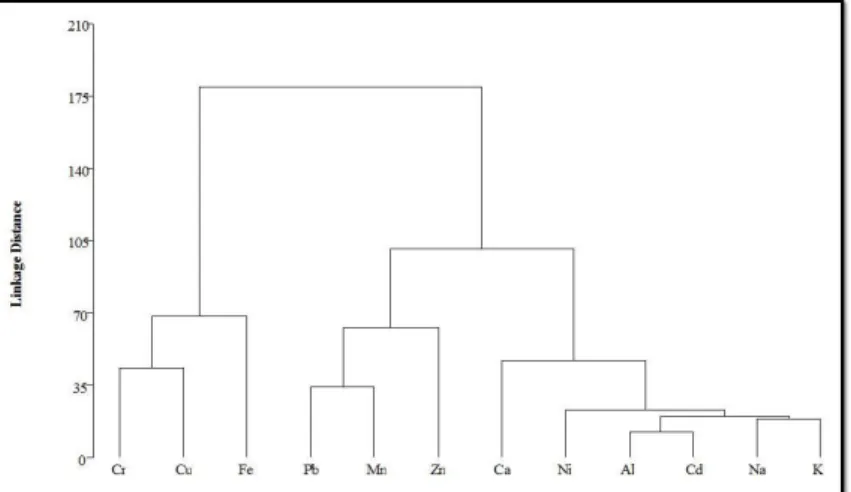
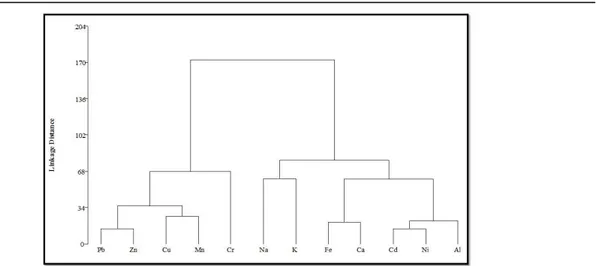
The correlation matrix [63×12] gives four clusters and four significant PCs which explain 76.37% of fine particles and 80.46% of coarse particles. The obtained dendrograms are presented in Figures 5 and 6 for coarse and fine particles.
Figure 6. Dendrogram of CA of metal concentrations in fine fraction at the studied site.
The PCA results obtained by Varimax rotated factor analysis for coarse and fine particles are presented in Tables 3 and 4, respectively.
Table 3. Varimax rotated PCA factor loadings for coarse particles.
Elements Factor 1 Factor 2 Factor 3 Factor 4
Al 0.84 0.10 0.05 -0.11
Ca 0.50 -0.16 0.66 -0.40
Cr -0.64 -0.60 0.01 0.14
Cu -0.58 0.12 0.73 0.17
Fe 0.30 -0.80 0.11 -0.02
Pb 0.37 0.63 0.48 -0.12
Mn 0.22 0.74 0.08 0.32
Ni 0.82 0.27 -0.02 -0.02
Na 0.86 -0.19 0.22 0.13
Cd 0.93 0.05 -0.13 -0.02
Zn 0.05 0.09 -0.05 0.94
K 0.86 0.06 0.10 0.12
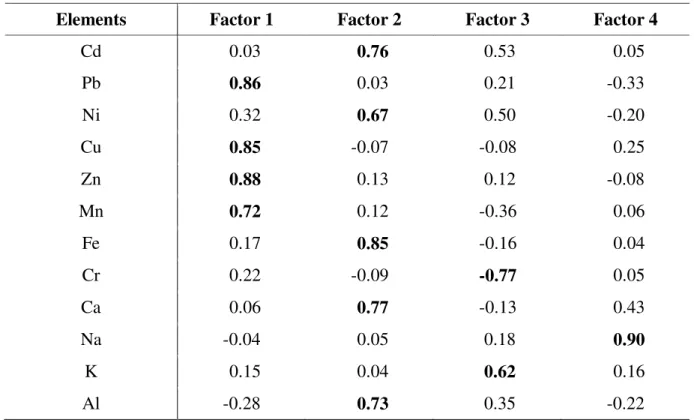
Table 4. Varimax rotated PCA factor loadings for fine particles.
Elements Factor 1 Factor 2 Factor 3 Factor 4
Cd 0.03 0.76 0.53 0.05
Pb 0.86 0.03 0.21 -0.33
Ni 0.32 0.67 0.50 -0.20
Cu 0.85 -0.07 -0.08 0.25
Zn 0.88 0.13 0.12 -0.08
Mn 0.72 0.12 -0.36 0.06
Fe 0.17 0.85 -0.16 0.04
Cr 0.22 -0.09 -0.77 0.05
Ca 0.06 0.77 -0.13 0.43
Na -0.04 0.05 0.18 0.90
K 0.15 0.04 0.62 0.16
Al -0.28 0.73 0.35 -0.22
PCA of fine particulate matter identified four factors with the total variance of 76.37. Factor 1 has high concentrations of Pb (0.86), Cu (0.85), Zn (0.88) and Mn (0.72) which explains 25.40% of the total variance. This factor is associated with elements from traffic emission sources (Veron et al., 1992; Manoli et al., 2002; Samara and Voutsa, 2005; Chang et al., 2009). Thus, factor 1 could be identified as traffic emissions. Factor 2 accounts for 24.41% of the total variance. This factor is a mixture of soil dust (Fe, Ca and Al) and traffic emissions or road dust (Cd and Ni). Therefore, factor 2 could be interpreted as soil/road dust. Factor 3, with 15.79% of the total variance, includes high concentrations for K (0.62) and Cr (-0.77) indicating soil dust origin (Lee and Thi Hieu, 2011). Factor 4 accounts for 10.77% of the total variance. The only dominant element for this factor is Na with a high concentration of 0.79 which clearly indicates its origin from sea salt.
4. CONCLUSIONS
5. REFERENCES
BISWAS, S. K.; TARAFDAR, S. A.; ISLAM, A.; KHALIQUZZAMAN, M.; TERVAHATTU, H.; KUPIAINEN, K. Impact of unleaded gasoline introduction on the concentration of lead in the air of Dhaka, Bangladesh. Journal of Air and Waste Management Association, v. 53, p. 1355-1362, 2003. http://dx.doi.org/ 10.1080/ 10473289.2003.10466299
CHANG, S. H.; WANG, K. S.; CHANG, H. F.; NI, W. W.; WU, B. J.; WONG, R. H. et al. Comparison of source identification of metals in road-dust and soil. Soil Sediment Contamination, v. 18, p. 669–683, 2009. http://dx.doi.org/10.1080/1532038090 3085691
CHUEINTA, W.; HOPKE, P. K.; PAATERO, P. Investigation of sources of atmospheric aerosol at urban and suburban residential areas in Thailand by positive matrix factorization. Atmospheric Environment, v. 34, p. 3319-3329, 2000. http://dx. doi.org/10.1016/S1352-2310(99)00433-1
COHEN, D. D; GORTON, D.; STELCER, E.; HAWAS, O. Accelerator based studies of atmospheric pollution processes. Radiation Physics and Chemistry,v.71, p. 759-767, 2004. http://dx.doi.org/10.1016/j.radphyschem.2004.04.123
HOPKE, P. K.; XIE, Y.; RAUNEMAA, T.; BIEGALSKI, S.; LANDSBERGER, S.; MAENHAUT, W.; ARTAXO, P. et al. Characterization of the Gent Stacked Filter Unit PM10 Sampler. Aerosol Science and Technology, v. 27, p. 726-735, 1997. http://dx. doi.org/10.1080/02786829708965507
HOPKE, P. K. Receptor modeling in environmental chemistry. New York: John Wiley & Sons, 1985.
JACOBSON, M. Z. Atmospheric pollution: history, science and regulation. New York: Cambridge University Press, 2002.
KIM OANH, N. T.; UPADHAYAY, N.; ZHUANG, Y. H.; HAO, Z. P.; MURTHY, D. V. S; LESTARI, P. et al. Particulate air pollution in six Asian cities: spatial and temporal distributions, and associated sources. Atmospheric Environment, v. 40, p. 3367-3380, 2006. http://dx.doi.org/10.1016/j.atmosenv.2006.01.050
LADEN, F.; NEAS, L. M.; DOCKERY, D. W.; SCHWARTZ, J. Association of fine particulate matter from different sources with daily mortality in six U.S. cities. Environment Health Persectives, v. 108, p. 941-947, 2000. http://dx.doi.org/
10.2307/3435052
LEE, B. K.; THI HIEU, N. Seasonal variation and sources of heavy metals in atmospheric aerosols in a residential area of Ulsan, Korea. Aerosol and Air Quality Research, v. 11, p. 679–688, 2011. http://dx.doi.org/10.4209/aaqr.2010.10.0089
LI, W.; BAI, Z.; LIU, A.; CHEN, J.; CHEN, L. Characteristics for major PM2.5 components during winter in Tianjin, China. Aerosol Air Quality Research, v. 9, p. 105-119, 2009.
MARCAZZAN, G. M.; CERIANI, M.; VALLI, G.; VECCHI, R. Source apportionment of PM10 and PM2.5 in Milan (Italy) using receptor models. Science Environment, v. 317,
p. 137-147, 2003. http://dx.doi.org/10.1016/S0048-9697(03)00368-1
MOROCCO. Ministry of Territorial, Urban, Housing and Environment Planning and Ministry of Health. Casa-Airpol: study of air pollution and its impact on population health in Casablanca City, Campaigns of 1998-1999. Rabat, 2000.
MOROCCO. Ministry of Territorial, Urban, Housing and Environment Planning and Ministry of Health. Mohammedia-airpol: Study of air pollution and its impact on the health of asthmatic children in Mohammedia City, 2001-2002 campaigns. Rabat, 2002.
MOROCCO. Ministry of Territorial, Urban, Housing and Environment Planning and Ministry of Health. Report on the state of the environment of Morocco - REEM. Rabat, 2001.
MOROCCO. Ministry of Territorial, Water and Environment Planning, Department of the Air and National Laboratory of Environment, Department of Surveillance and Prevention Risks - MATEE. Air pollution in Morocco, Situation in 2002. Rabat, 2003.
MICHAEL, F. W.; DANIEL, L. C. Air pollution and the respiratory tract. 2. ed. Boca Raton: Taylor and Francis, 2005.
RUZER, L. S.; HARLEY, N. H. Aerosols handbook: measurement dosimetry and health effects. [S.l.]: CRC Press, 2004.
SALVADOR, P.; ARTINANO, B.; DIANA, G. A.; XAVIER, Q.; ANDRES, A. Identification and Characterization of Sources of PM10 in Madrid (Spain) by statistical methods. Atmospheric Environment, v. 38, p. 435-447, 2003. http://dx.doi.org/10.1016/j. atmosenv.2003.09.070
SAMARA, C.; VOUTSA, D. Size distribution of airborne particulate matter and associated heavy metals in the roadside environment. Chemosphere, v. 59, p. 1197-1206, 2005.
http://dx.doi.org/10.1016/j.chemosphere.2004.11.061
SANTOSO, M.; HOPKE, P. K.; HIDAYAT, A.; DWIANA, D. Sources identification of atmospheric aerosol at urban and suburban sites in Indonesia by positive matrix factorization. Science of Total Environment, v. 397, 229-237, 2008. http://dx.doi.
org/10.1016/j.scitotenv.2008.01.057