Vol.55, n. 3: pp.457-464, May-June 2012
ISSN 1516-8913 Printed in Brazil BRAZILIAN ARCHIVES OF
BIOLOGY AND TECHNOLOGY
A N I N T E R N A T I O N A L J O U R N A L
Fast Assessment of Mineral Constituents in Grass by
Inductively Coupled Plasma Optical Emission Spectrometry
Éder José dos Santos
1, Loana Mara Baika
1, Amanda Beatriz Herrmann
1, Suzete Kulik
1,
Charyane Satie Sato
1, Arlene Bispo dos Santos
1and Adilson José Curtius
2*1Instituto de Tecnologia do Paraná; C. P.: 357; 81310-020; Curitiba - PR - Brasil. 2Departamento de Química;
Universidade Federal de Santa Catarina; 880400-900; Florianópolis - SC - Brasil
ABSTRACT
A method for evaluating inorganic constituents in the grass by ICP OES is proposed. The samples were digested with nitric acid plus hydrogen peroxide in a microwave system. Seventeen samples were collected in the metropolitan area of Curitiba and Castro in the Paraná State, Brazil. The following elements were studied: Al, As, Ba, Ca, Cd, Co, Cr, Cu, Fe, K, Mg, Mn, Mo, Na, Ni, P, Pb, Sb, Se and Zn. The linear coefficients of the curves were higher than 0.999 and the precision, expressed as the relative standard deviation, which was below 10%, being considered adequate. The accuracy was validated by using the recovery test (recoveries from 80 to 107%) and by the analysis of botanical certified materials. For one sample, two other digestion procedures, using two different mixtures of nitric and hydrochloric acids, produced results in agreement with the adopted procedure. Eleven out of the twenty studied elements could be quantified in real samples. High concentrations of Ca, K, Mg and P, the essential elements for bovines and other animals, were found. The results were evaluated using the principal component analysis that gathered the samples in three groups, according to the areas where the plants were grown.
Key words: ICP OES, Inorganic constituents, Acid digestion, PCA
*Author for correspondence: eder@tecpar.br
INTRODUCTION
Grass plants are among the main fodder sources for bovines, being considered as a voluminous feed, growing rapidly in favorable conditions and presenting high contents of fibers and water. They also can provide the majority of the required nutrients, depending on the animal species, soil quality, plant fertility and age, among other factors. Efficient pasture management is required to guarantee the availability of the nutrients. Brazil has the biggest cattle herd in the world, with more than 95% of the animals being grown in pastures. Certainly, the milk and meet quality will depend on the grass composition, which should be known (Martuscelo et al.2009; Souza et al. 2007).
continuously by the food. However, deficiency or toxicity symptoms can be verified for low or high constituent concentration, respectively. Selenium, Mo and Cu toxicity can lead to problematic feeding situations. Elements such as As, Cd and Pb can be present in the grass due to environmental pollution. The knowledge of the chemical composition of the grass certainly is very important for the producer and also for the consumer (Azevedo and Chasin 2003; Da silva et al. 2006; Euclides and Medeiros 2003; Nicodemo and Laura 2001; Trevizan et al. 2007). Inductively coupled plasma optical emission spectrometry (ICP OES), in comparison to other atomic spectrometric techniques, can be employed for the determination of a relatively large groups of elements in high or low levels of concentration. Specifically for grass, ICP OES was recommended for analyte detection and quantification (Li and Thornton 1993; Madejón et al. 2002; Alexander et al. 2006; Farfel et al.2005; Melo et al. 2009). In this way, As, Bi and Sb were determined, after sample calcination at 450 oC for 6 h in the presence of Mg(NO3)2, using hydride generation (Li and Thornton 1993). Digestion with nitric acid in a microwave oven (Madejón et al. 2002) or in digestion blocks with controlled temperature were used for the determination of As, Cd, Cu, Ca, Fe,
K, Mn, Mg, Ni, Pb, P, Tl and Zn (Alexander et al. 2006; Farfel et al. 2005). Nitric plus perchloric acids in digestion block were used for the determination of As (Melo et al.2009). The goal of this work is the development of a method for the simultaneous determination of 20 elements in grass from the metropolitan area of Curitiba and Castro, in the State of Paraná, Brazil. The samples will be acid digested in a focused microwave system, prior to the analysis. The principal components analysis (PCA) will used for data interpretation.
MATERIALS AND METHODS
Instrumentation
The emission intensity signals, in peak height, were measured in an ICP OES instrument, model Vista Pro from Varian (Mulgrave, Australia), using the experimental conditions shown in Table 1. A focused microwave system, Star System 2
from CEM (Matthews, NC, USA) was employed for sample digestion. A mechanical Mill, model 3600 from Perten (Huddinge, Switzerland) was used to grind the samples previously dried in a drying oven model 400 ND from Nova Ética (Vargem Grande Paulista, SP, Brazil).
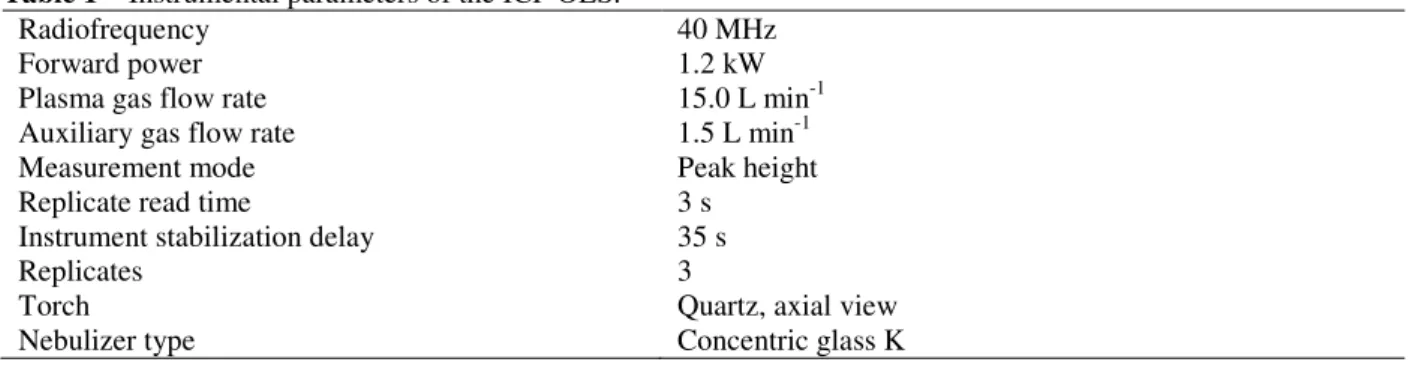
Table 1 – Instrumental parameters of the ICP OES.
Radiofrequency 40 MHz
Forward power 1.2 kW
Plasma gas flow rate 15.0 L min-1
Auxiliary gas flow rate 1.5 L min-1
Measurement mode Peak height
Replicate read time 3 s
Instrument stabilization delay 35 s
Replicates 3
Torch Quartz, axial view
Nebulizer type Concentric glass K
Reagents and materials
All chemicals were of analytical grade, unless otherwise specified. High purity water (resistivity of 18.2 MΩ cm) was de-ionized in a Milli-Q system (Bedford, MA, USA). The following reagents were used: 65% v/v HNO3 Suprapur® (Part no 1.00441.1000); 30% v/v H
2O2 (Part no 1.07210.1000) and 30% v/v HCl Suprapur® (Part no 1.00318.0250), all from Merck (Darmstadt, Germany). Aqua regia (HCl + HNO3 3:1 molar ratio) and inverse aqua regia (HCl + HNO3 1:3 molar ratio) were prepared by mixing the
concentrated acids. Mono-elemental stock standard solutions containing 1000 mg L-1 of the analytes, from AccuStandard (New Haven, USA) were used to compose the multi-elemental standard solutions used for calibration, in the concentration range from 0.1 to 2 mg L-1 of the analytes in 10% v/v HNO3.
Campo Largo and Bateias) and in Castro in the State of Paraná, Brazil. Among the samples, the following varieties were found: Avena strigosa
Schreb, Lolium perenne and Cynodon sp and from
the brachiaria gender. In the field, about 50 g of
the plant was cut close to the root with an inox knife and kept in a plastic bag. In the lab, the plant samples were washed with de-ionized water and dried at 25 ± 2ºC until constant weigh (Li and Thornton 1993). The samples were then cut into small pieces, ground in a mechanical mill and stored in plastic bags, under the names G1 to G17, being G1 to G10 from the Curitiba area and G11 to G17 from the Castro area.
The following reference certified materials were analyzed: SRM 1515 (Apple Leaves) from the National Institute of Standards and Technology (NIST, Gaithersburg, MD, USA) and SRM 1573 (Tomato Leaves) from the National Bureau of Standards (NBS, Washington, DC, USA).
Sample preparation
An aliquot of about 0.5 g of the ground sample was weighed and transferred to the glass tube of the focused microwave system. Then, 5 mL of concentrated HNO3 and 4 mL of concentrated H2O2 were added to the flask that was left standing for 12 h, before being digested in the focused microwave system under reflux, for 5 min at
110 ºC. The resulting solution was filtrated through a filter paper from JProlab, (No JP41, Curitiba, Brazil) and transferred to a 50 ml volumetric flask, before completing the volume with water. For comparison purpose, the G1 sample was also digested using 10 mL of aqua regia or inverse aqua regia.
Statistical program
The statistical program Statgraphics Plus 5.0 (Statgraphics Graphics Corp.,ST.SC., USA) was used for the principal component analysis (PCA).
RESULTS AND DISCUSSION
Sample digestion
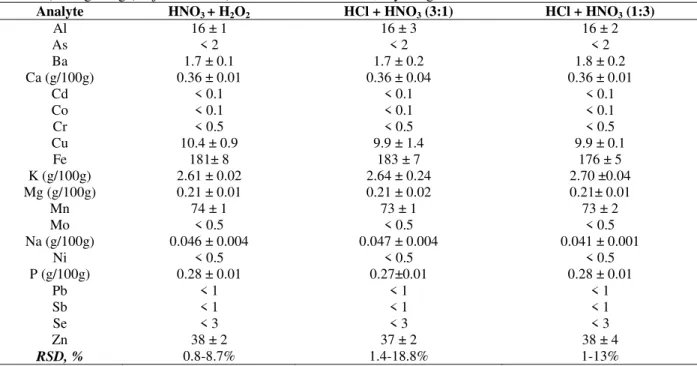
Table 2 shows the obtained results for the analytes concentrations in G1 sample using the three mixtures, above mentioned, in the digestion. According to the pared t-test, at a 95% confidence
level, the three results for each analyte are in agreement. The method using nitric acid plus hydrogen peroxide was adopted, only because the precision, expressed by the relative standard deviation, was somewhat better than for the other two mixtures. This experiment also indicates that the proposed method is accurate.
Table 2 - Obtained concentrations (average ± standard deviation) for the sample G1, mg kg-1 (minor and trace elements) and g/100g (major elements) in different media, n=3, dry weigh basis.
Analyte HNO3 + H2O2 HCl + HNO3 (3:1) HCl + HNO3 (1:3)
Al 16 ± 1 16 ± 3 16 ± 2
As < 2 < 2 < 2
Ba 1.7 ± 0.1 1.7 ± 0.2 1.8 ± 0.2
Ca (g/100g) 0.36 ± 0.01 0.36 ± 0.04 0.36 ± 0.01
Cd < 0.1 < 0.1 < 0.1
Co < 0.1 < 0.1 < 0.1
Cr < 0.5 < 0.5 < 0.5
Cu 10.4 ± 0.9 9.9 ± 1.4 9.9 ± 0.1
Fe 181± 8 183 ± 7 176 ± 5
K (g/100g) 2.61 ± 0.02 2.64 ± 0.24 2.70 ±0.04
Mg (g/100g) 0.21 ± 0.01 0.21 ± 0.02 0.21± 0.01
Mn 74 ± 1 73 ± 1 73 ± 2
Mo < 0.5 < 0.5 < 0.5
Na (g/100g) 0.046 ± 0.004 0.047 ± 0.004 0.041 ± 0.001
Ni < 0.5 < 0.5 < 0.5
P (g/100g) 0.28 ± 0.01 0.27±0.01 0.28 ± 0.01
Pb < 1 < 1 < 1
Sb < 1 < 1 < 1
Se < 3 < 3 < 3
Zn 38 ± 2 37 ± 2 38 ± 4
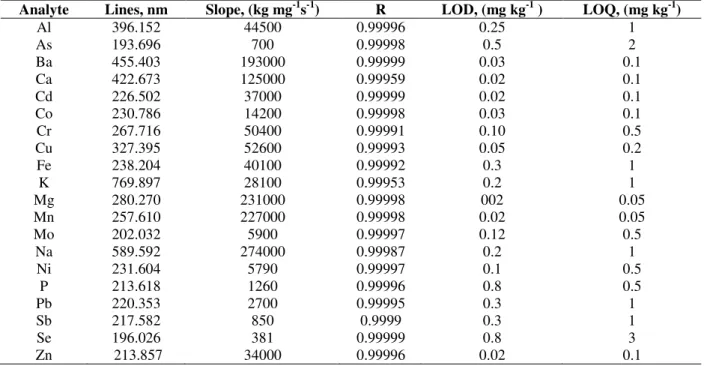
Figures of merit
The figures of merit obtained for sample G1 are shown in Table 3, together with the analytical lines used for the intensity signal measurements. The intensity peaks for the G1 sample, not shown in this paper, were very similar to the intensity peaks for the standard solutions for the different analytes, also indicating absence of interference. Absence of interference was verified also for sample G2, by applying the recovery test and by the analysis of two certified reference materials, as described below. Certainly, the sample digestion and dilution allowed the interference free analysis of grass samples. The linear correlation coefficients of the calibration curves in 10% v/v HNO3 were higher than 0.999, demonstrating good and adequate linearity. The limit of detection (LOD) and the limit of quantification (LOQ) were
defined as the ratios 3s/b and 10s/b, respectively, where s is the standard deviation of 10 measurements of the blank and b is the slope of the calibration curve (Nolte 2003; Miller et al. 2000). The obtained limits, shown in Table 3, demonstrate that the proposed method is adequate for the determination of Al, Ba, Ca, Cu, Fe, K, Mg, Mn, Na, P and Zn in grass, with LOQ values going from 0.05 (Mg and Mn) to 1 mg kg-1 (Al, Fe and K). The linear range for all analytes was from the LOQ values up to 200 mg kg-1. However, the proposed method is not enough sensitive for trace elements such as As, Cd, Co, Cr, Mo, Ni, Pb, Sb and Se, for which the concentrations were below the LOQ values (from 0.1 mg kg-1 for Cd to 3 mg kg-1 for Se), as it will be shown later, in the analytical application.
Table 3 - Figures of merit: slope of calibration curve, correlation coefficient (R), limit of detection (LOD) and quantification (LOQ) for 0.5 g of the sample in a final volume of 50 mL. Linear range up to 200 mg kg-1.
Analyte Lines, nm Slope, (kg mg-1s-1) R LOD, (mg kg-1 ) LOQ, (mg kg-1)
Al 396.152 44500 0.99996 0.25 1
As 193.696 700 0.99998 0.5 2
Ba 455.403 193000 0.99999 0.03 0.1
Ca 422.673 125000 0.99959 0.02 0.1
Cd 226.502 37000 0.99999 0.02 0.1
Co 230.786 14200 0.99998 0.03 0.1
Cr 267.716 50400 0.99991 0.10 0.5
Cu 327.395 52600 0.99993 0.05 0.2
Fe 238.204 40100 0.99992 0.3 1
K 769.897 28100 0.99953 0.2 1
Mg 280.270 231000 0.99998 002 0.05
Mn 257.610 227000 0.99998 0.02 0.05
Mo 202.032 5900 0.99997 0.12 0.5
Na 589.592 274000 0.99987 0.2 1
Ni 231.604 5790 0.99997 0.1 0.5
P 213.618 1260 0.99996 0.8 0.5
Pb 220.353 2700 0.99995 0.3 1
Sb 217.582 850 0.9999 0.3 1
Se 196.026 381 0.99999 0.8 3
Zn 213.857 34000 0.99996 0.02 0.1
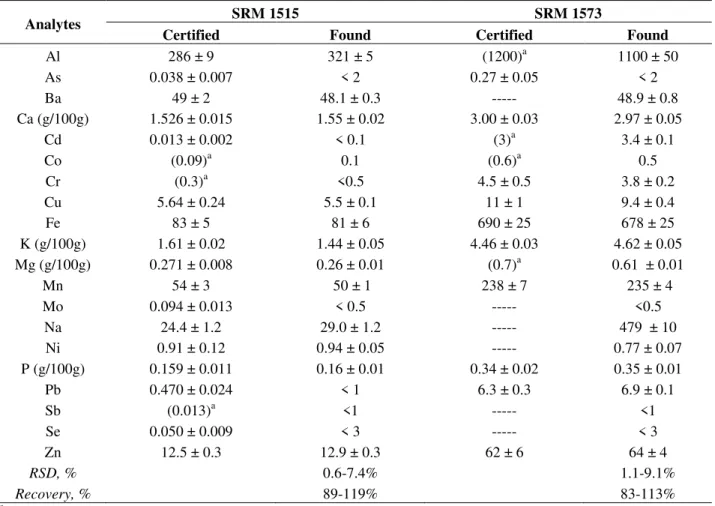
Precision and accuracy were evaluated for the G2 sample, which was enriched with 1% m/m of Ca, K, Mg, Na and P and 100 mg kg-1 of the minor components elements. The obtained concentrations are shown in Table 4. The relative standard deviations (RSD) were below 10%, indicating an adequate precision. The recovery values were from 80% to 107%, demonstrating a good accuracy (Miller and Miller 2000; Okada et al. 2007;
Table 4 - Recovery and RSD values for sample G2, enriched with 1% m/m of Ca, K, Mg, Na and P and 100 mg kg-1 of the minor component elements, n=7.
Analyte Sample (n=3) Enriched sample (n=7) Recovery (%) RSD, %
Al 6.0 ± 0.1 106 ± 1 100 0.9
As < 2 97 ± 2 97 2.1
Ba 18.4 ± 0.4 113 ± 1 94 1.0
Ca (g/100g) 0.58 ± 0.02 1.56 ± 0.03 98 1.9
Cd < 0.1 97.5 ± 1.2 98 1.2
Co < 0.1 93.0 ± 1.3 93 1.4
Cr < 0.5 96.5 ± 0.8 97 0.8
Cu 8.3 ± 0.3 103.0 ± 0.6 95 0.6
Fe 218 ± 5 298 ± 19 80 6.4
K (g/100g) 2.59 ± 0.02 3.67 ± 0.05 107 1.4
Mg (g/100g) 0.36 ± 0.01 1.35 ± 0.02 99 1.5
Mn 79 ± 3 168 ± 3 89 1.8
Mo < 0.5 96.3 ± 1.0 96 1.0
Na (g/100g) 0.101 ± 0.001 1.110 ± 0.010 101 0.9
Ni < 0.5 94.0 ± 1.1 94 1.2
P (g/100g) 0.33 ± 0.01 1.33 ± 0.014 100 1.1
Pb < 1 93 ± 2 93 2.2
Sb < 1 100 ± 1 100 1.0
Se < 3 106 ± 2 106 1.9
Zn 29 130 ± 10 101 7.7
Table 5 - Analysis of botanical certified reference materials, mg kg-1 (minor and trace elements) and g/100g (major elements), n=3.
Analytes SRM 1515 SRM 1573
Certified Found Certified Found
Al 286 ± 9 321 ± 5 (1200)a 1100 ± 50
As 0.038 ± 0.007 < 2 0.27 ± 0.05 < 2
Ba 49 ± 2 48.1 ± 0.3 --- 48.9 ± 0.8
Ca (g/100g) 1.526 ± 0.015 1.55 ± 0.02 3.00 ± 0.03 2.97 ± 0.05
Cd 0.013 ± 0.002 < 0.1 (3)a 3.4 ± 0.1
Co (0.09)a 0.1 (0.6)a 0.5
Cr (0.3)a <0.5 4.5 ± 0.5 3.8 ± 0.2
Cu 5.64 ± 0.24 5.5 ± 0.1 11 ± 1 9.4 ± 0.4
Fe 83 ± 5 81 ± 6 690 ± 25 678 ± 25
K (g/100g) 1.61 ± 0.02 1.44 ± 0.05 4.46 ± 0.03 4.62 ± 0.05
Mg (g/100g) 0.271 ± 0.008 0.26 ± 0.01 (0.7)a 0.61 ± 0.01
Mn 54 ± 3 50 ± 1 238 ± 7 235 ± 4
Mo 0.094 ± 0.013 < 0.5 --- <0.5
Na 24.4 ± 1.2 29.0 ± 1.2 --- 479 ± 10
Ni 0.91 ± 0.12 0.94 ± 0.05 --- 0.77 ± 0.07
P (g/100g) 0.159 ± 0.011 0.16 ± 0.01 0.34 ± 0.02 0.35 ± 0.01
Pb 0.470 ± 0.024 < 1 6.3 ± 0.3 6.9 ± 0.1
Sb (0.013)a <1 --- <1
Se 0.050 ± 0.009 < 3 --- < 3
Zn 12.5 ± 0.3 12.9 ± 0.3 62 ± 6 64 ± 4
RSD, % 0.6-7.4% 1.1-9.1%
Recovery, % 89-119% 83-113%
Analytical application
Table 6 shows the obtained concentrations for the seventeen samples, after digestion using nitric acid and hydrogen peroxide under microwaves. For nine analytes (the non-essential elements As, Cd, Cr, Ni, Pb, Sb, Co, Mo and Se), the concentrations
were below the quantification limits that could indicate that they were grown in non-contaminated environments. Usually, contaminants are more concentrated in the roots than in other parts of the plants, indicating poor translocation (Trevizam et al. 2007; Lamego and Vidal 2007).
Table 6 - Obtained concentrations (average ± standard deviation) for the seventeen samples, after digestion using nitric acid and hydrogen peroxide under microwaves, n=3.
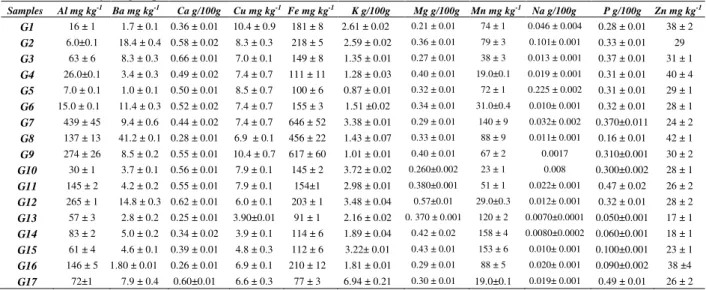
Samples Al mg kg-1 Ba mg kg-1 Ca g/100g Cu mg kg-1 Fe mg kg-1 K g/100g Mg g/100g Mn mg kg-1 Na g/100g P g/100g Zn mg kg-1 G1 16 ± 1 1.7 ± 0.1 0.36 ± 0.01 10.4 ± 0.9 181 ± 8 2.61 ± 0.02 0.21 ± 0.01 74 ± 1 0.046 ± 0.004 0.28 ± 0.01 38 ± 2
G2 6.0±0.1 18.4 ± 0.4 0.58 ± 0.02 8.3 ± 0.3 218 ± 5 2.59 ± 0.02 0.36 ± 0.01 79 ± 3 0.101± 0.001 0.33 ± 0.01 29
G3 63 ± 6 8.3 ± 0.3 0.66 ± 0.01 7.0 ± 0.1 149 ± 8 1.35 ± 0.01 0.27 ± 0.01 38 ± 3 0.013 ± 0.001 0.37 ± 0.01 31 ± 1 G4 26.0±0.1 3.4 ± 0.3 0.49 ± 0.02 7.4 ± 0.7 111 ± 11 1.28 ± 0.03 0.40 ± 0.01 19.0±0.1 0.019 ± 0.001 0.31 ± 0.01 40 ± 4 G5 7.0 ± 0.1 1.0 ± 0.1 0.50 ± 0.01 8.5 ± 0.7 100 ± 6 0.87 ± 0.01 0.32 ± 0.01 72 ± 1 0.225 ± 0.002 0.31 ± 0.01 29 ± 1 G6 15.0 ± 0.1 11.4 ± 0.3 0.52 ± 0.02 7.4 ± 0.7 155 ± 3 1.51 ±0.02 0.34 ± 0.01 31.0±0.4 0.010± 0.001 0.32 ± 0.01 28 ± 1 G7 439 ± 45 9.4 ± 0.6 0.44 ± 0.02 7.4 ± 0.7 646 ± 52 3.38 ± 0.01 0.29 ± 0.01 140 ± 9 0.032± 0.002 0.370±0.011 24 ± 2 G8 137 ± 13 41.2 ± 0.1 0.28 ± 0.01 6.9 ± 0.1 456 ± 22 1.43 ± 0.07 0.33 ± 0.01 88 ± 9 0.011± 0.001 0.16 ± 0.01 42 ± 1 G9 274 ± 26 8.5 ± 0.2 0.55 ± 0.01 10.4 ± 0.7 617 ± 60 1.01 ± 0.01 0.40 ± 0.01 67 ± 2 0.0017 0.310±0.001 30 ± 2 G10 30 ± 1 3.7 ± 0.1 0.56 ± 0.01 7.9 ± 0.1 145 ± 2 3.72 ± 0.02 0.260±0.002 23 ± 1 0.008 0.300±0.002 28 ± 1
G11 145 ± 2 4.2 ± 0.2 0.55 ± 0.01 7.9 ± 0.1 154±1 2.98 ± 0.01 0.380±0.001 51 ± 1 0.022± 0.001 0.47 ± 0.02 26 ± 2
G12 265 ± 1 14.8 ± 0.3 0.62 ± 0.01 6.0 ± 0.1 203 ± 1 3.48 ± 0.04 0.57±0.01 29.0±0.3 0.012± 0.001 0.32 ± 0.01 28 ± 2
G13 57 ± 3 2.8 ± 0.2 0.25 ± 0.01 3.90±0.01 91 ± 1 2.16 ± 0.02 0. 370 ± 0.001 120 ± 2 0.0070±0.0001 0.050±0.001 17 ± 1
G14 83 ± 2 5.0 ± 0.2 0.34 ± 0.02 3.9 ± 0.1 114 ± 6 1.89 ± 0.04 0.42 ± 0.02 158 ± 4 0.0080±0.0002 0.060±0.001 18 ± 1
G15 61 ± 4 4.6 ± 0.1 0.39 ± 0.01 4.8 ± 0.3 112 ± 6 3.22± 0.01 0.43 ± 0.01 153 ± 6 0.010± 0.001 0.100±0.001 23 ± 1
G16 146 ± 5 1.80 ± 0.01 0.26 ± 0.01 6.9 ± 0.1 210 ± 12 1.81 ± 0.01 0.29 ± 0.01 88 ± 5 0.020± 0.001 0.090±0.002 38 ±4
G17 72±1 7.9 ± 0.4 0.60±0.01 6.6 ± 0.3 77 ± 3 6.94 ± 0.21 0.30 ± 0.01 19.0±0.1 0.019± 0.001 0.49 ± 0.01 26 ± 2
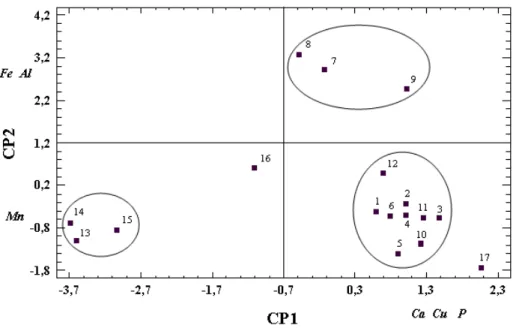
Eleven elements could be measured: Al, Ba, Ca, Cu, Fe, K, Mg, Mn, Na, P and Zn. Certainly, Ca, K, Mg and P are the most important constituents. The PCA for the concentrations of these analytes is represented in Figure 1, where PC1 is the first principal component and PC2 is the second principal component (Dos Santos et al. 2008; Morgano et al. 1999; Yabe and Oliveira 1998). The PC1 is related mainly with Ca, Cu and P, while the PC2 is related to Al, Fe and Mn. As shown in the Figure, the samples are distributed in three groups. One of them gathers the majority of the samples (G1-G6 and G10-G12), being characterized by relative high concentrations of Ca and P, which are essential elements for the living being, and of Cu, important for the immunologic system. The samples from this group, except G11 and G12, were grown in the same Curitiba area, what explains its similarity concerning the elemental composition. The second group contains
Figure 1 - Principal component analysis applied to the obtained concentrations for the seventeen fodder grass samples from the Curitiba and Castro areas.
CONCLUSIONS
The simultaneous determination of several elements in grass by ICP OES, following microwave-assisted sample digestion is proposed. Three different acid digestion mixtures produce results in agreement for a grass sample. The precision of the proposed method, measured by the relative standard deviation, is adequate. The method is accurate, as verified by the analysis of certified reference materials, by the recovery test and also by comparing different acid mixtures in the digestion. Eleven out of 20 studied elements could be determined, including the most important ones, concerning nutrition, such as Ca, K, Mg and P. The concentration of 6 non-essential plus 3 trace elements were below their quantification limits. The principal component analysis, applied to the concentration results for 17 grass samples, gather the samples in 3 groups according to their composition. The groups could be associated to different areas of plant culture. Most probably, the proposed method can be used for the analysis of other botanical samples.
ACKNOWLEDGMENTS
L. M. Baika and A. B. dos Santos have scholarship from Fundação Araucária. A. J. Curtius has a scholarship from Conselho Nacional de Desenvolvimento Científico e Tecnológico.
REFERENCES
Azevedo SA, Chasin AAM. Metais: Gerenciamento da Toxicidade. São Paulo: Atheneu; 2003.
Alexander PD, Alloway BJ, Dourado AM. Genotypic variations in the accumulation of Cd, Cu, Pb and Zn exhibited by six commonly grown vegetables. Environ. Pollution 2006; 44:736-745.
Da Silva S, Siqueira JO, Soares CRFS. Mycorrhizal fungi influence on brachiariagrass growth and heavy metal extraction in a contaminated soil. Pesq. agropec. bras., 2006; 41(12): 1749-1757.
Dos Santos JS, Dos Santos ML, Oliveira E. Study of metal and trace element mobilization in aquatic environments of brazilian semi-arid zones applying principal component analysis. Quím. Nova 2008; 31(5): 1107-1111.
Farfel MR, Orlova AO, Chaney RL, Lees PSJ, Rohde C, Ashley PJ. Biosolids compost amendment for reducing soil lead hazards: a pilot study of Orgro amendment and grass seeding in urban yards. The Sci. of the Total Environ. 2005; 340: 81-95.
Li X, Thornton I. Arsenic, antimony and bismuth in soil and pasture herbage in some old metalliferous mining areas in England. Environ. Geog. and Health. 1993; 15(2/3): 135-144.
Lamego FP, Vidal RA. Phytoremediation: plants like agents of despolution? Ecotoxicol. e Meio Amb. 2007; 17: 9-18.
Martuscello JA, Jank L, Gontijo Neto MM, Laura VA, Da Cunha DNFV. Genus Brachiaria grass yields under different shade levels. R. Bras. Zootec. 2009; 38(7): 1183-1190.
Madejón P, Murillo JM, Marañón T, Cabrera F, López R. Bioaccumulation of As, Cd, Cu, Fe and Pb in wild grasses affected by the Aznalcóllar mine spill (SW Spain). The Sci. of the Total Environ. 2002; 290: 105-120.
Melo RF, Dias LE, Mello JWV, Oliveira JA. Potential of four herbaceous forage species for phytoremediation of a soil contaminated with arsenic. R. Bras. Ci. Solo. 2009; 33: 455-465.
Miller JN, Miller JC. Statistics and Chemometries for Analytical Chemistry. 5th ed. Edinburgh: Pearson Education; 2000.
Morgano MA, Queiroz SCN, Ferreira MMC. Minerals determination in juices by inductively coupled plasma optical emission spectrometry. Ciênc. Tecnol. Aliment. 1999; 19(3): 344-348.
Nicodemo MLF, Laura VA. Minerals in forages: chemical forms, distribution and bioavailability. First ed. Campo Grande: Embrapa Gado de Corte; 2001. Nolte J. ICP Emission Spectrometry: a practical guide.
Owingen: Wiley-VCH; 2003.
Okada IA, Duran MC, Buzzo ML, Dovidauskas S, Sakuma AM, Zenebon O. Validation and application of an analytical method for determining inorganic nutrients in milled rice. Cienc. Tecnol. Aliment. 2007; 27(3): 492-497.
Rocha GP, Evangelista AR, Paiva PCA, Freitas RTF, Garcia E, Rosa B. Mineral composition of three grasses of the Cynodon genus. Ciênc. Anim. Bras. 2000; 1(1): 31-41.
Sousa LF, Maurício RM, Gonçalves LC, Saliba EOS, Moreira GR. Productivity and nutritional value of Brachiaria brizantha cv. Marandu in a silvopastoral system. Arq. Bras. Med. Vet. Zootec. 2007; 59(4), 1029-1037.
Schunke RM. Interaction between Pastures Fertilization and Mineral Supplementation of Cattle. First ed. Campo Grande: Embrapa Gado de Corte; 2001. Rosecrance AE. Quality Assurance. In: Eaton AD,
Clesceri LS, Rice EW, Greenberg AE. Standard Methods for the Examination of Water and Wastewater. 21st ed. Maryland: American Public Health Association; 2005. 1-5.
Trevizam AR, Vitti GC, Silva MLS. Concentration of heavy metals in grain of plants cultivated in soil with different contamination levels. Pesquisa Agropec. Bras. 2007; 42(4): 527-535.
Wenzl P, Mancilla LI, Mayer JE, Albert R, Rao IM. Simulating infertile acid soils with nutrient solutions: the effects on Brachiaria species. Soil Sci. Soc. Am. J. 2003; 67: 1457 –1469.
Yabe MJS, Oliveira E. Heavy metals in fresh waters for evaluation of hydrographic basins. Quím. Nova 1998; 21(5): 551-556.