Article
Printed in Brazil - ©2016 Sociedade Brasileira de Química0103 - 5053 $6.00+0.00
*e-mail: [email protected]
UV-Assisted Digestion of Petrochemical Industry Effluents Prior to the
Determination of Zn, Cd, Pb and Cu by Differential Pulse Anodic Stripping
Voltammetry
Daniela Domingos,a,b Maria de Lourdes S. Ferreira Neta,a Ana Rosa C. G. Massa,a
Marcio V. Reboucasc and Leonardo S. G. Teixeira*,b,d
aBraskem S. A., Unidade de Insumos Básicos Bahia, 42810-000 Camaçari-BA, Brazil
bInstituto de Química, Universidade Federal da Bahia, Campus Universitário de Ondina,
40170-115 Salvador-BA, Brazil
cGranBio, 13069-320 Campinas-SP, Brazil
dInstituto Nacional de Ciência e Tecnologia de Energia e Ambiente (INCT-Energia e Ambiente),
Universidade Federal da Bahia, Campus Universitário de Ondina, 40170-115 Salvador-BA, Brazil
A petrochemical effluent is usually a matrix of very high complexity and composition variability, requiring robust and suitable methods for routine analysis. In this paper, the feasibility of applying a voltammetric technique for the determination of metals species in the petrochemical industry effluent was demonstrated after UV-assisted digestion procedure. Voltammetric (electrolyte volume, deposit time, pulse time, pulse amplitude and scan rate) and digestion variables (hydrogen peroxide volume, nitric acid volume and digestion time) were studied using a 2-level factorial design. The developed voltammetric method using anodic stripping voltammetry (ASV) presented limits of quantification of 11, 5, 15 and 5 µg L−1 for Zn, Cd, Pb and Cu, respectively, and was effective to analyze petrochemical effluents after UV-digestion.
Keywords: petrochemical effluent, voltammetry, determination of metals, experimental design, ultraviolet-digestion
Introduction
The importance of petrochemicals in the modern world has become significant, influencing various commercial sectors due to extensive use of its products to replace traditional raw materials such as paper, steel, glass, leather, wood, cotton, wool, silk, and natural and brass coatings. Moreover, in recent decades environmental issues have been more intensely discussed, creating a growing environmentally conscious society. The industrial economy expanded significantly and environmental impacts associated with inefficient processes gained greater attention because they are no longer accepted by any stakeholder. Whether for environmental awareness or obligation imposed by law, reducing consumption of natural resources and minimizing waste and effluents has become the industry’s focus, resulting in cleaner and more sustainable processes.
The petrochemical industry’s effluents usually have a very complex matrix, intrinsic to that company’s processes. Contaminants present in the effluent may come from the raw material, from the production process reactions and/or plant maintenance. Metals are among the most critical contaminants. Due to their toxicity, even at low concentrations, Pb and Cd are key elements, while Cu and Zn are important because they play a vital role or are toxic, depending on their concentrations and the nature of the considered bodies.1 These metals are present in many industrial chemical processes and water resources are the most affected when the effluents do not receive adequate treatment.
due to the high complexity and variability of the effluent matrix. Besides, those methods usually require high demand for qualified labor to perform the tests, use of high cost reagents and equipment, and generate significant amount of waste.
Voltammetry has been employed in various analytical applications, being an extremely versatile technique for determination of organic analytes,2,3 such as proteins and vitamins; and inorganic analytes, such as metals in different matrices,4,5 including industrial effluents.6-9 Nevertheless, voltammetric techniques have few applications in effluent samples from petrochemical industry.
In the case of metal determination by voltammetry, the organic material present in effluent samples can cause interferences, decreasing the analytical signal. Ultraviolet (UV)-digestion is a procedure for sample pretreatment that can be effectively employed for destruction of dissolved organic matter prior voltammetric metal determination.10,11 Thus, the objective of this paper is to demonstrate the feasibility of using differential pulse anodic stripping voltammetry (ASV) to the determination of metals in petrochemical industry’s effluents after UV-assisted digestion confirming the potential of this technique as analytical tool to be used in the industry.
Experimental
Instrumentation and apparatus
Voltammetric determinations were performed in the processor analyzer 797 VA equipped with a compact auto-sampler model 813 and connected to a microcomputer in which the 797 VA Computrace software version 1.3.1 (Metrohm, Herisau, Switzerland) was installed to control the equipment and to acquire voltammetric data. The voltammetric cell had a conventional configuration composed of three electrodes: the hanging mercury drop electrode (HMDE), as working electrode; the AgCl/KCl 3 mol L−1 electrode, as a reference; and the platinum (Pt), as auxiliary electrode. All experiments were performed in a single electrochemical cell at room temperature (22 ± 1 ºC).
A 705 UV digester (Metrohm, Herisau, Switzerland) equipped with a cooling system and a high-pressure Hg lamp (500 W) was used for sample digestion. The UV digester consists of a sample holder of 12 quartz tubes (capacity 15 mL) fitted with conical Teflon tops. UV-radiation was mirrored into the samples by means of a mirror surface that surrounds the quartz vessels. The fluid cooling oil placed outside the mirroring surface and the lamp cooling fan, permitting the temperature control of the sample compartment.
Inductively coupled plasma optical emission spectrometry (ICP OES) employing a spectrometer model Spectroblue (Spectro, Kleve, Germany) was used as a comparative method, employing argon gas and specific spectral lines (Cd: 226.502/228.802 nm; Cu: 324.700/327.396 nm; Pb: 168.215/220.353 nm; Zn: 202.613/206.200/213.856 nm; and C: 193.025/247.856 nm). The ICP OES operating conditions can be found in Table S1.
Reagents, solutions and samples
The solutions were prepared with ultrapure water obtained in an ion exchange system (Milli-Q, Millipore, Billerica, MA, USA). All reagents used were of analytical grade. The dissolved oxygen in the solutions that were analyzed by voltammetry was removed by a nitrogen purging with a 99.99% minimum purity gas (White Martins, São Paulo, SP, Brazil) for a period of 5 min. Hydrogen peroxide (30% m/m, H2O2) and nitric acid
(65% m/m, HNO3), used in sample digestion, were
obtained from Synth (Diadema, SP, Brazil) and Merck (Darmstadt, Germany), respectively. Standard solutions containing 1000 mg L−1 of ZnII, CdII, PbII and CuII metals were obtained from Titrisol (Merck, Darmstadt, Germany). The working solution containing ZnII 50 mg L−1, CdII 50 mg L−1, PbII 50 mg L−1 and CuII 50 mg L−1 was obtained by diluting 1000 mg L−1 standard solution with ultrapure water and acidified with nitric acid PA (Merck, Darmstadt, Germany). The reagents used to prepare the electrolyte were glacial acetic acid and sodium acetate (Merck, Darmstadt, Germany). The electrolyte used
in the proposed method was composed of 0.5 mol L−1
CH3COOH and 0.5 mol L−1 CH3COONa (Merck,
Method development
The UV-digestion of the effluent samples was studied using a factorial design with the following input variables: hydrogen peroxide volume, nitric acid volume and digestion time. Therefore, a 2-level factorial design with 3 factors (23 = 8 trials) and 3 center points (0) was performed, resulting in a total of 11 trials with the effluent sample. The factorial design showed minimum and maximum values of 30 and 120 min for the digestion time and 0 and 100 µL for the hydrogen peroxide and nitric acid volume factors. Since one of the objectives of the study was to reduce the amount of reagent, the use of the lowest possible values of each variable was tested. Thus, digestion was tested with nitric acid in the absence of hydrogen peroxide and vice versa to check the possibility of achieve adequate UV digestion using less reactant. As response variables, the total residual carbon and zinc concentration obtained in the digested sample were evaluated.
The voltammetric variables (electrolyte volume, deposit time, pulse time, pulse amplitude and scan rate) were also studied using a 2-level factorial design with 5 factors (25 = 32 trials) and 3 center points (0), resulting in a total of 35 trials, using 1 mL of a multielement standard concentration of 0.5 mg L−1 of each metal (zinc, cadmium, lead and copper). The factorial design levels were defined according to some literature references,12-15 having minimum and maximum values of 0.5 and 9.5 mL, 20 and 160 s, 0.02 and 0.06 s, 20 and 70 mV, 30 and 90 mV s−1 for electrolyte volume, deposit time, pulse time, pulse amplitude and sweep rate, respectively. Water was added to the voltammetric cell according to the amount of each electrolyte test to complete a total volume of 11 mL. The factorial design response was the observed metal concentration in the sample.
In both studies, a triplicate was performed at the central point of the experimental design to estimate the experimental error. Each assay was performed individually and randomly, with the obtained data processed in the Statistica® software, version 12.0.16 The optimum condition was defined by the desirability function. This method is very useful for analytical studies containing more than one response variable. The simultaneous optimization of multiple responses was reduced to single value maximization, the overall desirability (D) and, therefore, the optimum was defined by the factor levels which maximize the D value. The advantage of this function is that, being the overall desirability a geometric average of the individual desirabilities of each input variable, it tends to zero whenever one of the responses shows an unacceptable value, no matter how satisfactory the other response values are.17,18
After obtaining the optimized analytical method, a statistical validation was performed, regarding accuracy, precision, linearity, sensitivity, limits of detection and quantification, and interference of concomitants. The set of effluent samples used for method validation had 18 original samples of the petrochemical process, which were previously analyzed by ICP OES for Zn, Cd, Pb and Cu determination. The sample that showed no detectable level of a metal was spiked with a standard solution of the four metals to obtain an equivalent added concentration in the range of 0.1 to 4.5 mg L−1.
Results and Discussion
Sample preparation
In Table 1 is presented the residual carbon and zinc concentration results obtained for real digested effluent sample analysed by ICP OES, according to the experimental design proposed for sample digestion assessment.
In Figure 1 is presented a photo with the effluent samples after digestion for each experiment of the factorial design shown in Table 1. A color difference between the samples can be noticed, especially the higher color intensity of the samples 1 and 5, in which HNO3 and H2O2 were not added; followed by sample 2, in which was only added HNO3 and irradiated with UV for 30 min (factorial design lower level). Thus, it is confirmed that the reactants have significant action in the petrochemical effluent digestion, as well as the irradiation time.
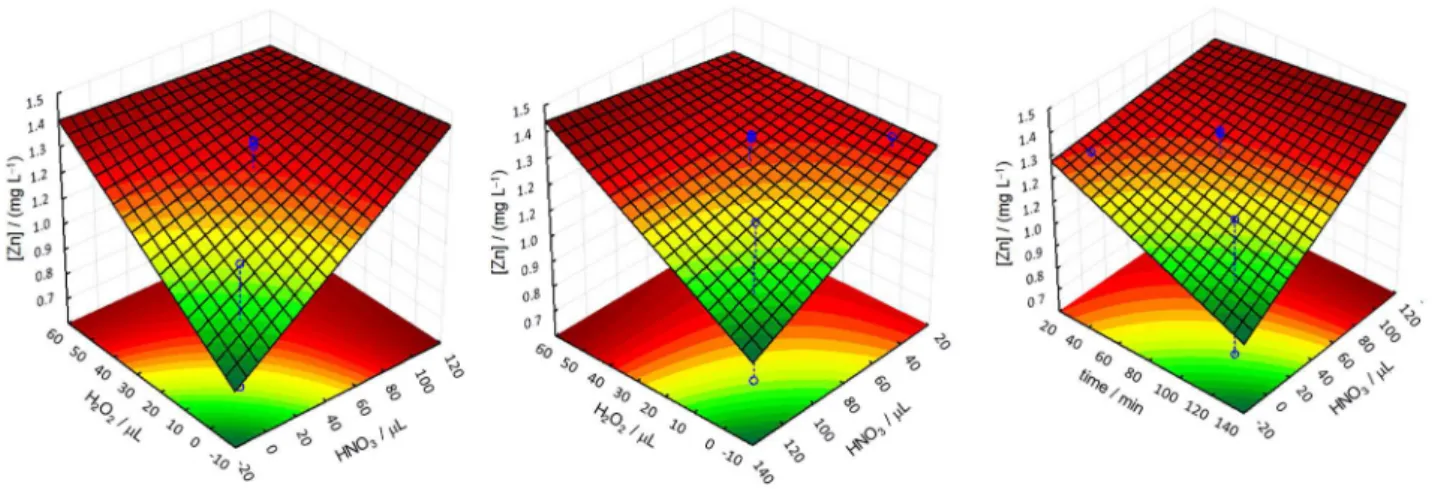
An initial review of the obtained data shows that the experiments at the center point (50 µL of HNO3, 25 µL of H2O2 and 75 min of UV irradiation) and the experiment 8 (100 µL of HNO3, 50 µL of H2O2 and 120 min of UV irradiation) resulted in samples with higher zinc result. The amount of residual carbon in the sample determined from the experiment 8 was an unexpected result, which was assessed and considered an outlier. Given the results, it can be assumed that the ideal digestion for petrochemical effluent samples would be held at experiment 8 or performed at the central point of the experimental design. The result of this preliminary assessment was confirmed by the response surfaces of the experimental design, which were obtained by processing the zinc concentration data (Figure 2).
global optimum point were: 100 µL of nitric acid, 50 µL of hydrogen peroxide and 120 min of UV irradiation. However, it was observed that the maximum desirability value was obtained across the range of 50 to 100 µL of HNO3, 25 to 50 µL of H2O2, and 75 to 120 min of UV irradiation, not only in each of these variables’ maximum values. Since the objective of this study was to reduce the volume of reagents and UV irradiation time, the use of the lowest possible values of each variable was chosen. Thus, the petrochemical effluent samples digestion process was performed with 50 µL of HNO3, 25 µL de H2O2 and 75 min of UV irradiation.
Destruction of dissolved organic matter, prior to voltammetric determination of trace metals in effluent or wastewater samples, is necessary to free trace metals that are complexed and to remove interfering organic species.11 Wet acid digestion are commonly used method for breakdown of dissolved organic matter prior to the application of the voltammetry.19,20 However, when these digestion methods are performed, the use of high levels of chemical oxidants can be necessary, introducing contamination to the samples. Normally, these digestions are time consuming and performed under aggressive conditions, requiring the use of heating. The application of ozone as a digestion agent can also be an effective strategy to destroy dissolved organic matter prior to the determination of trace metal by voltammetry.21,22 However, depending on sample organic load, dilution can be necessary to complete ozonolysis in a suitable time of digestion,22 affecting the detectability of the determination. Thus, the proposed UV-digestion of the effluent samples can be used as an alternative sample pretreatment procedure, reducing the volume of reagents and the time of pretreatment. Considering that the UV digester Table 1. Sample preparation experimental design: residual carbon (Cresidual) and zinc (Zn) concentration in the digested samples of the petrochemical effluent
Experiment Order HNO3 / µL H2O2 / µL time / s Cresidual / (mg L−1) Zn / (mg L−1)
1 5 0 0 30 1435 1.18
2 1 100 0 30 1742 1.33
3 7 0 50 30 1736 1.28
4 3 100 50 30 1197 1.31
5 4 0 0 120 1756 0.71
6 9 100 0 120 < LOQ 1.32
7 6 0 50 120 786 1.30
8 2 100 50 120 1905 1.35
9 11 50 25 75 725 1.34
10 8 50 25 75 848 1.35
11 10 50 25 75 884 1.36
LOQ: Limit of quantification.
Figure 1. Effluent samples after digestion for each experiment defined by the factorial design.
can process 12 samples simultaneously, the pretreatment can be performed with a good sample throughput.
Voltammetric variables study
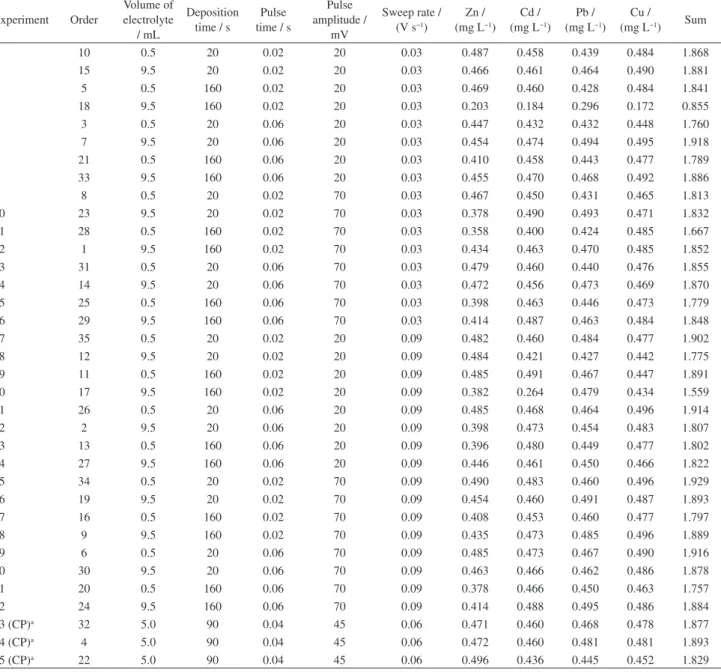
Table 2 shows the experimental design matrix. The execution order is also presented, in addition to the experimental results obtained for Zn, Cd, Pb and Cu. The sum of the concentration results of the four metals was used as a grouped response variable to assess the significance of the input variables. After evaluating the data and deleting the outlier resulting from experiment 4, the model showed no significant lack of fit in the analysis
of variance (ANOVA), being suitable for prediction in this experimental domain. It was observed from ANOVA that the deposit time and electrolyte volume, and scan rate interaction were significant, since the p-value obtained was less than 0.05 for 95% of confidence level. Individual analysis of each metal led to similar results.
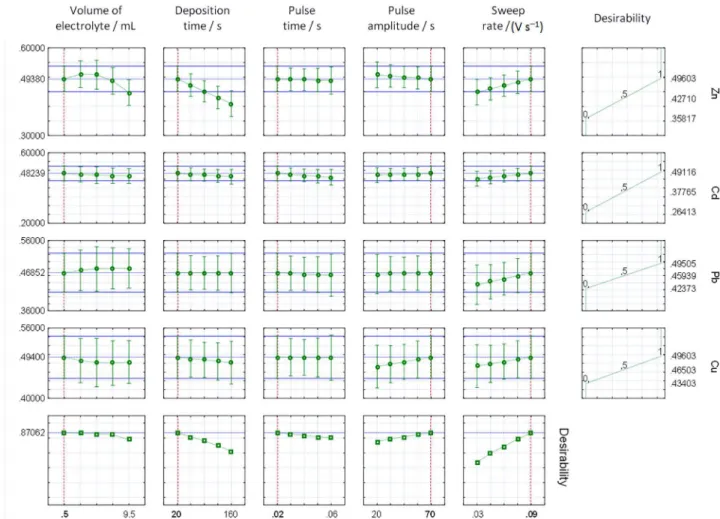
From analysis of the desirability graph (Figure 3), it was possible to observe that, within the studied range, the smaller the electrolyte volume values, deposition time, and pulse time, the greater the desirability value. The variables scan rate and pulse amplitude showed the opposite behavior. Given these results, the global optimum of the input variables of the voltammetric determination of Zn,
Table 2. Experimental matrix design for the voltammetric determination of Zn, Cd, Pb and Cu
Experiment Order
Volume of electrolyte
/ mL
Deposition time / s
Pulse time / s
Pulse amplitude /
mV
Sweep rate / (V s−1)
Zn / (mg L−1)
Cd / (mg L−1)
Pb / (mg L−1)
Cu /
(mg L−1) Sum
1 10 0.5 20 0.02 20 0.03 0.487 0.458 0.439 0.484 1.868
2 15 9.5 20 0.02 20 0.03 0.466 0.461 0.464 0.490 1.881
3 5 0.5 160 0.02 20 0.03 0.469 0.460 0.428 0.484 1.841
4 18 9.5 160 0.02 20 0.03 0.203 0.184 0.296 0.172 0.855
5 3 0.5 20 0.06 20 0.03 0.447 0.432 0.432 0.448 1.760
6 7 9.5 20 0.06 20 0.03 0.454 0.474 0.494 0.495 1.918
7 21 0.5 160 0.06 20 0.03 0.410 0.458 0.443 0.477 1.789
8 33 9.5 160 0.06 20 0.03 0.455 0.470 0.468 0.492 1.886
9 8 0.5 20 0.02 70 0.03 0.467 0.450 0.431 0.465 1.813
10 23 9.5 20 0.02 70 0.03 0.378 0.490 0.493 0.471 1.832
11 28 0.5 160 0.02 70 0.03 0.358 0.400 0.424 0.485 1.667
12 1 9.5 160 0.02 70 0.03 0.434 0.463 0.470 0.485 1.852
13 31 0.5 20 0.06 70 0.03 0.479 0.460 0.440 0.476 1.855
14 14 9.5 20 0.06 70 0.03 0.472 0.456 0.473 0.469 1.870
15 25 0.5 160 0.06 70 0.03 0.398 0.463 0.446 0.473 1.779
16 29 9.5 160 0.06 70 0.03 0.414 0.487 0.463 0.484 1.848
17 35 0.5 20 0.02 20 0.09 0.482 0.460 0.484 0.477 1.902
18 12 9.5 20 0.02 20 0.09 0.484 0.421 0.427 0.442 1.775
19 11 0.5 160 0.02 20 0.09 0.485 0.491 0.467 0.447 1.891
20 17 9.5 160 0.02 20 0.09 0.382 0.264 0.479 0.434 1.559
21 26 0.5 20 0.06 20 0.09 0.485 0.468 0.464 0.496 1.914
22 2 9.5 20 0.06 20 0.09 0.398 0.473 0.454 0.483 1.807
23 13 0.5 160 0.06 20 0.09 0.396 0.480 0.449 0.477 1.802
24 27 9.5 160 0.06 20 0.09 0.446 0.461 0.450 0.466 1.822
25 34 0.5 20 0.02 70 0.09 0.490 0.483 0.460 0.496 1.929
26 19 9.5 20 0.02 70 0.09 0.454 0.460 0.491 0.487 1.893
27 16 0.5 160 0.02 70 0.09 0.408 0.453 0.460 0.477 1.797
28 9 9.5 160 0.02 70 0.09 0.435 0.473 0.485 0.496 1.889
29 6 0.5 20 0.06 70 0.09 0.485 0.473 0.467 0.490 1.916
30 30 9.5 20 0.06 70 0.09 0.463 0.466 0.462 0.486 1.878
31 20 0.5 160 0.06 70 0.09 0.378 0.466 0.450 0.463 1.757
32 24 9.5 160 0.06 70 0.09 0.414 0.488 0.495 0.486 1.884
33 (CP)a 32 5.0 90 0.04 45 0.06 0.471 0.460 0.468 0.478 1.877
34 (CP)a 4 5.0 90 0.04 45 0.06 0.472 0.460 0.481 0.481 1.893
35 (CP)a 22 5.0 90 0.04 45 0.06 0.496 0.436 0.445 0.452 1.829
Cd, Pb and Cu was defined as electrolyte volume = 0.5 mL, deposition time = 20 s, pulse time = 0.02 s, pulse amplitude = 70 mV and sweep rate = 0.09 V s−1. Therefore, an improvement in the total analysis time can be observed, compared to the method proposed for aqueous matrices by the equipment supplier, due to optimization of the deposit time and scan rate method, which were reduced from 90 to 20 s, and from 0.06 to 0.09 V s−1, respectively. Another relevant result obtained in this step was a 50% reduction in the electrolyte volume used in the analysis.
Interferences
The possible interference of some chemical species in the determination of the metals Zn, Cd, Pb and Cu was evaluated analyzing a real sample doped with the potential interfering components after sample pretreatment by the proposed UV-assisted digestion. The concentration values for the interfering component were defined considering the maximum value ever found in the historical data for effluent samples of the petrochemical company in which they were collected. The concomitants were evaluated in two separate
groups: the first being composed of anions (700 mg L−1 chloride, 20 mg L−1 phosphate, 5000 mg L−1 sulfate and 10 mg L−1 sulfide) and organic compounds (60 mg L−1 benzene, 60 mg L−1 toluene, 60 mg L−1 p + m + o-xylene and 1 mg L−1 phenol); and the second consisting of cations (5 mg L−1 ammonium, 8.5 mg L−1 barium, 5.7 mg L−1 iron, 5.1 mg L−1 manganese, 0.005 mg L−1 mercury, 1 mg L−1 nickel, 1 mg L−1 silver and 1 mg L−1 vanadium). Metal concentration values obtained with and without addition of the studied concomitants were evaluated using statistical F- and t- tests. The results showed no significant difference for any of the studied metals and, also, the added compounds did not cause significant interference in the current intensity and peak resolution. However, in the analysis of the contaminated sample group 1 (anions and organics), an elevation from the baseline in the zinc peak potential region was observed, although this change did not cause impact on the determination of this metal.
inter-metallic compounds (Cu-Zn) causing interference in the current intensity thereof. However, there is no information describing at which concentration ratio this interference starts to occur; so the ratio between zinc and copper were tested at 1:1, 1:5, 1:10, 1:25 and 1:50 levels. The Zn recovery percentage in the petrochemical effluent after contamination with copper ranged from 87 to 107%, and, therefore, it was considered within an acceptable range at this concentration level. Such result indicates that the interference of the intermetallic compounds formation was not significant under the conditions described in this study. In a nutshell, all the results presented in the statistical validation of the Zn, Cd, Pb and Cu voltammetric determination method demonstrate the analytical reliability and robustness necessary for deployment in the petrochemical effluent analytical monitoring.
Analytical performance and application
Calibration curves were obtained under the optimized experimental conditions and the following equations were found, confirming the excellent linearity of the method:
y = 211.46x + 18.86, r = 0.9997 (for zinc) (1)
y = 165.03x + 11.41, r = 0.9997 (for cadmium) (2)
y = 114.27x + 7.87, r = 0.9996 (for lead) (3)
y = 60.35x + 4.51, r = 0.9997 (for copper) (4)
where y is value of current (nA) and x is the concentration of metal (mg L−1). The limits of detection, calculated as the metal concentrations corresponding to three times the standard deviation for ten independent measurements of the blank divided by the slope of the calibration curve, were 3.2, 1.5, 4.4 and 1.5 µg L−1 for Zn, Cd, Pb and Cu, respectively. Precision was evaluated at three metal concentration levels, from ten analyses of spiked petrochemical effluent samples, resulting in a final concentration of approximately 0.03, 0.30 and 3.00 mg L−1. The relative standard deviation values were in the range of 9.3 to 12.9%, and 3.3 to 4.5% for the µg L−1 and mg L−1 levels, respectively.
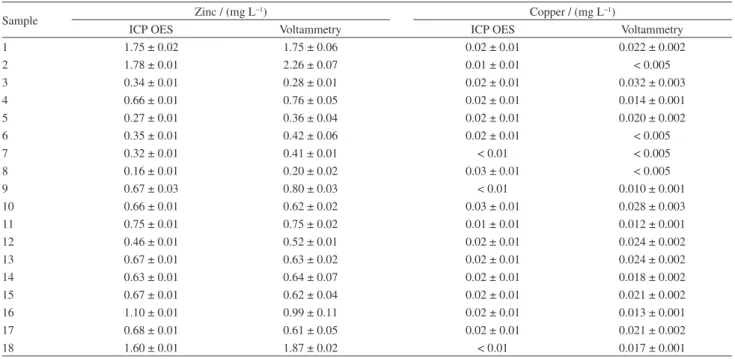
The voltammetric method was used for Zn, Cd, Pb and Cu determination in petrochemical effluents samples. Initially, recovery tests were performed by spiking sixteen effluent petrochemical samples with metals from 0.1 to 4.5 mg L−1. Recovery values in the range of 80 to 117% for Zn, 86 to 105% for Cd, 80 to 118% for Pb and 82 to 120% for Cu, were observed. Samples collected over a period of time were analyzed. Cadmium and lead were not present at concentrations above the limit of quantification of the method in the effluent samples that were analyzed. The results found for zinc and copper concentration are presented in Table 3. Accuracy was evaluated by comparison of the voltammetric determination with ICP OES analysis. From the statistical analysis (two-sample Table 3. Determination of Zn and Cu in petrochemical effluent samples analyzed by inductively coupled plasma optical emission spectrometry (ICP OES) and voltammetry
Sample Zinc / (mg L
−1) Copper / (mg L−1)
ICP OES Voltammetry ICP OES Voltammetry
1 1.75 ± 0.02 1.75 ± 0.06 0.02 ± 0.01 0.022 ± 0.002
2 1.78 ± 0.01 2.26 ± 0.07 0.01 ± 0.01 < 0.005
3 0.34 ± 0.01 0.28 ± 0.01 0.02 ± 0.01 0.032 ± 0.003
4 0.66 ± 0.01 0.76 ± 0.05 0.02 ± 0.01 0.014 ± 0.001
5 0.27 ± 0.01 0.36 ± 0.04 0.02 ± 0.01 0.020 ± 0.002
6 0.35 ± 0.01 0.42 ± 0.06 0.02 ± 0.01 < 0.005
7 0.32 ± 0.01 0.41 ± 0.01 < 0.01 < 0.005
8 0.16 ± 0.01 0.20 ± 0.02 0.03 ± 0.01 < 0.005
9 0.67 ± 0.03 0.80 ± 0.03 < 0.01 0.010 ± 0.001
10 0.66 ± 0.01 0.62 ± 0.02 0.03 ± 0.01 0.028 ± 0.003
11 0.75 ± 0.01 0.75 ± 0.02 0.01 ± 0.01 0.012 ± 0.001
12 0.46 ± 0.01 0.52 ± 0.01 0.02 ± 0.01 0.024 ± 0.002
13 0.67 ± 0.01 0.63 ± 0.02 0.02 ± 0.01 0.024 ± 0.002
14 0.63 ± 0.01 0.64 ± 0.07 0.02 ± 0.01 0.018 ± 0.002
15 0.67 ± 0.01 0.62 ± 0.04 0.02 ± 0.01 0.021 ± 0.002
16 1.10 ± 0.01 0.99 ± 0.11 0.02 ± 0.01 0.013 ± 0.001
17 0.68 ± 0.01 0.61 ± 0.05 0.02 ± 0.01 0.021 ± 0.002
18 1.60 ± 0.01 1.87 ± 0.02 < 0.01 0.017 ± 0.001
t-paired test, 95% confidence level), it could be confirmed that the methods are equivalent. Among the metals found in the petrochemical effluent samples in this study, zinc is the most relevant, being present in the samples more often and at higher concentration. Typical concentration of copper in the effluent samples is lower than the standards required by law (0.3 mg L−1), with values below the limit of quantification of the method for most samples. Normally, the presence of these metals in the petrochemical industry effluents is associated with corrosive processes, water treatment, cooling towers or raw material, and thus, they are not commonly found in the processes’ effluents.
Conclusions
The proposed voltammetric method using anodic stripping voltammetry was adequate to analyze petrochemical effluent samples after UV-digestion, confirming the potential of the voltammetric technique as analytical tool to be used in the industry. The use of a multivariate optimization technique was effective to establish the main voltammetric variables and sample digestion conditions for determining Zn, Cd, Pb and Cu. The sample pretreatment method developed in this study provided an improvement, regarding the reagents consumption and the sample throughput and, hence, its response speed and analytical costs, important factors for successful application of analytical methods. This way, this application demonstrates that the industry needs can be met by voltammetry, making it an appropriate and promising technique for routine analysis in the petrochemical industry.
Supplementary Information
Supplementary data are available free of charge at http://jbcs.sbq.org.br as PDF file.
Acknowledgments
The authors thank Braskem S. A. for supplying technical resources required for this work. The authors are grateful to Fundação de Amparo a Pesquisa do Estado da Bahia (FAPESB), Conselho Nacional de Desenvolvimento Científico e Tecnológico (CNPq) and Coordenação de Aperfeiçoamento de Pessoal de Nível Superior (CAPES) for providing grants, fellowships and financial support.
References
1. Buffle, J.; Tercier-Waeber, M. L.; TrAC, Trends Anal. Chem.
2005, 24, 172.
2. Catrinck, M. N.; Okumura, L. L.; Silva, A. A.; Saczkb, A. A.; Oliveira, M. F.; J. Braz. Chem. Soc. 2015, 26, 1751.
3. Lima, A. B.; Torres, L. M. F. C.; Guimarães, C. F. R. C.; Verly, R. M.; da Silva, L. M.; Carvalho Júnior, A. D.; dos Santos, W. T. P.; J. Braz. Chem. Soc. 2014, 25, 478.
4. Arancibia, V.; Zúñiga, M.; Zúñiga, M. C.; Segura, R.; Esteban, M.; J. Braz. Chem. Soc. 2010, 21, 255.
5. Dadda, A. S.; Teixeira, A. C.; Feltes, P. K.; Campos, M. M.; Leite, C. E.; Moriguchi-Jeckel, C. M.; J. Braz. Chem. Soc. 2014, 25, 1621.
6. Banks, C. E.; Hyde, M. E.; Tomcik, P.; Jacobs, R.; Compton, R. G.; Talanta2004, 62, 279.
7. Senthilkumar, S.; Saraswathi, R.; Sens. Actuators, B2009, 141, 65.
8. Chakraborty, P.; Chakrabarti, C. L.; Anal. Chim. Acta2006, 571, 260.
9. Desmond, D.; Lane, B.; Alderman, J.; Hill, M.; Arrigan, D. W. M.; Glennon, J. D.; Sens. Actuators, B1998, 48, 409. 10. Lambert, D. F.; Turoczy, N. J.; Anal. Chim. Acta2000, 408, 97. 11. Achterberg, E. P.; van Den Berg, C. M. G.; Anal. Chim. Acta
1994, 291, 213.
12. Locatelli, C.; Torsi, T.; J. Electroanal. Chem.2001, 509, 80. 13. Prestes, E. C.; dos Anjos, V. E.; Sodré, F. F.; Grassi, M. T.;
J. Braz. Chem. Soc.2007, 17, 53.
14. Achterberg, E. P.; Herzl, V. M. C.; Braungardt, C. B.; Millward, G. E.; Environ. Pollut.2003, 121, 283.
15. Lau, O.; Cheng, O.; Anal. Chim. Acta1998, 376, 197. 16. StatSoft, Inc.; Statistica: Data Analysis Software System, version
12.0; StatSoft: Oklahoma, 2013.
17. Derringer, G.; Suich, R.; J. Qual. Technol.1980, 12, 214. 18. Reboucas, M. V.; Santos, J. B.; Pimentel, M. F.; Teixeira,
L. S. G.; Chemom. Intell. Lab. Syst.2011, 107, 185.
19. dos Santos, A. C. V.; Masini, J. C.; Anal. Bioanal. Chem.2006, 385, 1538.
20. Brett, C. M. A.; Fungaro, D. A.; J. Braz. Chem. Soc.2000, 11, 298.
21. Clem, R. G.; Hodgson, A. T.; Anal. Chem.1978, 50, 102. 22. Filipovic-Kovacevic, Z.; Sipos, L.; Talanta1998, 45, 843. 23. Siriangkhawut, W.; Grudpan, K.; Jakmunee, J.; Talanta2011,
84, 1366.
Submitted: October 16, 2015
Published online: February 3, 2016