Ana Lucia Lovadino de LimaI,II
Ana Carolina Feldenheimer da SilvaI
Silvia Cristina KonnoI,II
Wolney Lisboa CondeI,II
Maria Helena D’Aquino BenicioI,II
Carlos Augusto MonteiroI,II
I Núcleo de Pesquisas Epidemiológicas em Nutrição e Saúde da Universidade de São Paulo (USP). São Paulo, SP, Brasil II Departamento de Nutrição. Faculdade de
Saúde Pública. Universidade de São Paulo. São Paulo, SP, Brasil
Correspondence:
Carlos Augusto Monteiro Departamento de Nutrição Faculdade de Saúde Pública da USP Av. Dr. Arnaldo, 715
01246-904 São Paulo, SP, Brasil E-mail: [email protected] Received: 9/8/2009 Revised: 11/5/2009 Approved: 11/7/2009
Causes of the accelerated
decline in child undernutrition
in Northeastern Brazil
(1986-1996-2006)
ABSTRACT
OBJECTIVE: To describe changes in prevalence of child undernutrition in Northeastern Brazil in two successive time periods, identifying, in each period, the major factors responsible for these changes.
METHODS: Data analyzed are from probabilistic samples of underives from three Demographic Health Surveys carried out in 1986 (n=1,302), 1996
(n=1,108), and 2006 (n=950). Identiication of factors responsible for temporal
changes in child undernutrition (height-for-age below < -2 z) took into account
time changes in ive potential determinants of child nutritional status, statistical
modeling of the independent association between determinants and risk of undernutrition, and calculation of attributable fractions.
RESULTS: Prevalence of child undernutrition fell by one-third between 1986 and 1996 (from 33.9% to 22.2%) and by almost three-quarters between 1996 and 2006 (from 22.2% to 5.9%). Improvements in maternal schooling and in the coverage of water and sewage services were particularly important for the
decline in child undernutrition in the irst period, while increasing purchasing
power of the poorest families and, again, maternal schooling were more relevant in the second period.
CONCLUSIONS: The acceleration of the decline in child undernutrition between the two periods was consistent with accelerated improvement of maternal schooling, water supply and sewage, health care, and maternal reproductive antecedents, as well as with the outstanding increase in purchasing power among the poor during the second period. If the rate of decline in growth
deicits is kept at around the rate of the most recent period, child undernutrition
will be controlled in the Brazilian Northeast in less than ten years. Achieving this will depend on sustaining the increase in purchasing power among the poor and on ensuring public investment in completing the universalization of access to essential services such as education, health, and sanitation.
Childhood undernutrition, as diagnosed by growth
deicits, is one of the most important health problems
faced by developing countries. It is associated with higher risk of infectious disease and early mortality, impaired psychomotor development, lower academic achievement, and lower reproductive capacity in adulthood.2,14 Reducing prevalence of anthropometric
deicits in underives by half is one of the Millennium
Development Goals established by the United Nations in the year 2000.13
Anthropometric surveys based on probabilistic samples
of the Brazilian underive population carried out in the
1970’s, 1980’s, and 1990’s showed a systematic concen-tration of undernutrition in the country’s Northeast Region. In 1974/75, the National Family Budget Survey
showed that stunting (height-for-age deicit) was two
times more frequent in the Northeast than in the Center-West, Southeast, and South Regions (Center-South).6 In 1989, the National Survey of Health and Nutrition, despite reporting a reduction in undernutrition in all of the country’s regions, showed that such decline was relatively less intense in the Northeast, making the prevalence of stunting three times higher in that region than in the Center-South.6 In 1996, the Demographic Health Surveys(DHS) program indicated a further decline in undernutrition, which this time was equi-valent in the Northeast and Center-South, maintaining the three-fold difference in risk of stunting between these regions.7
An initial analysis of the data from the most recent
Brazilian DHS survey, carried out in 2006/07, ratiied
the declining trend in infant undernutrition across all Regions, but this time showing a particularly intense
reduction in height-for-age deicit in the Northeast. This
reduction virtually eliminated the disadvantage of this Region with respect to the rest of the country.8
The aim of the present study was to describe the temporal variation in prevalence of child undernutrition in the Northeast Region of Brazil across two periods (1986-1996 and 1996-2006) and to identify major factors contributing towards the evolution seen in each of these periods.
METHODS
We analyzed data on the Northeast Region obtained from the Brazilian DHS surveys carried out between
May and September 1986 (DHS 1986), February and
July 1996 (DHS 1996), and between November 2006 INTRODUCTION
a Institute for Resource Development. Sociedade Civil Bem-Estar Familiar no Brasil. Brasil: Pesquisa nacional sobre saúde materno-infantil e planejamento familiar 1986.[cited 2009 Nov 24]. Available from: http://www.bemfam.org.br/up/01Capitulo1%20metodologia%20da%20 pesquisa.pdf
b Sociedade Civil Bem-Estar Familiar no Brasil. Pesquisa Nacional sobre Demografia e Saúde 1996: relatório da pesquisa. Rio de Janeiro; 1997.[cited 2009 Nov 24]. Available from: http://www.bemfam.org.br/up/01Capitulo1%20introducao.pdf
and April 2007 (DHS 20063,4). The DHS are probabi-listic household surveys that are part of an international research initiative aimed at obtaining country-wide information on fertility, infant and maternal mortality, contraception, and woman and child health.
The three surveys used similar complex sampling
procedures involving regional stratiication of census
tracts (one stratum of which was the Northeast Region), random selection of clusters of tracts within each stratum, and random selection of households within each tract. In the selected households, all women aged 15-49 years and all of their biological children under
ive years of age were eligible to participate in the
survey.4,a,b
The total number of children in the Northeast Region aged zero to 59 months was 1,302 in the 1986 DHS, 2,108 in the 1996 DHS, and 950 in the 2006 DHS. The proportion of children in this region that did not undergo anthropometric evaluation (usually for not being home at the time of the interview) in the three surveys was 9.4%, 10.3%, and 7.9%, respectively. Children who were measured and children who were not measured
did not differ signiicantly in terms of family purchasing
power and maternal schooling in any of the surveys. In addition to children not measured, we also excluded from the analysis any child whose height, weight, or weight/height values were biologically implausible.15
This criterion disqualiied less than 1% of measured
children in all three surveys. The final sample of children for the Northeast Region with valid values for height (the central anthropometric variable in the present study) was 1,177 children in 1986, 1,872 in 1996, and 870 in 2006. The sample of children with valid weight and height comprised 1,170 children in 1986, 1,845 in 1996, and 862 in 2006.
In the three surveys, weight and length (up to age 23 months) or height (24 months and older) were obtained by pairs of interviewers previously trained and standar-dized, using scales with 100 g precision and stadiome-ters with 1mm precision. The remaining data analyzed in present study were obtained using questionnaires adapted from the DHS model.
Temporal variation in risk of childhood undernutrition across the three surveys was determined by comparing
prevalence estimates (and their respective 95% coni
-dence intervals) for stunting (height-for-age deicit) and wasting (weight-for-height deicit). Stunting and wasting were deined, respectively, as height more than
for the child’s age and sex, and weight more than two standard-deviations below the expected median for the child’s height and sex.15 In both cases, we based our measurements on the World Health Organization’s anthropometric reference curves, built using the distribution of measurements of children in optimal conditions of nutrition.16
Variables that could potentially “explain” the temporal variation in risk of undernutrition in the 1986-1996 and 1996-2006 periods were selected based on the United Nations Children’s Fund (UNICEF) causality model for child undernutrition12 and on the availability of
informa-tion collected in the three surveys. We considered ive
determinants of child nutritional status: family purcha-sing power, maternal schooling, water supply/sewage, health care, and maternal reproductive indicators.
We evaluated family purchasing power using the
Classiicação Econômica Brasil.a This system divides
subjects into ive classes of decreasing purchasing
power (A,B,C,D, and E) based on intervals of the total score attained by the family on a scale where points are attributed to ten items (type and number of assets in the household, characteristics of the home, and years of schooling of the head of household). Scoring for the different items is carried out so as to maximize the correlation between total score and monthly income. In the 1996 DHS, information on one item in the scale was absent (presence of freezer in the household), and was therefore imputed based on a regression model of the other items over the missing one (model based on the DHS 2006 database). In the 1986 DHS, given that information was available on only six of the ten
classiication items, we deined new intervals for the
scale to characterize the five classes, maintaining proportionality with the original ten-item scale. To
make adjacent surveys comparable, the classiication
of purchasing power in the 1996 DHS was done accor-ding to the original intervals of the ten-item score of the Classiicação Econômica Brasil and according to intervals derived from the six-item score. Given the low proportion of children in the upper three purchasing power classes (A, B, and C) in the three surveys, we divided subjects into only three classes of purchasing power: classes A, B, and C grouped into a single cate-gory, class D, and class E.
Schooling of the mothers of children from the three
surveys was classiied into intervals of completed years
of education. The analysis of water supply and sewage coverage considered the access of the household to the public water supply and public sewage services. For health service coverage, we considered antenatal care (at least one appointment, since no information on number of appointments was available in the 1986
DHS) and hospital delivery. Maternal reproductive
indicators evaluated included birth order, birth spacing, and mother’s age at birth. Due to the high correlation between the investigated components of both services coverage and maternal reproductive indicators, we chose to create unique categorical variables combi-ning the information obtained for each component. For example, water supply and sewage coverage were described by a single variable composed of three cate-gories: access to water and sewage services, access to one of these two services, and no access to any of these services.
Since prevalence of wasting was very low in all three
surveys, the analysis of factors inluencing the temporal
variation in prevalence of child undernutrition in the two periods was restricted to prevalence of stunting (from now on referred to as prevalence of undernutri-tion). This analysis was conducted in four stages. In the
irst stage, we analyzed the evolution in the distribution of each of the ive potential determinants of nutritional
status in the 1986-1996 and 1996-2006 periods. We used tests based on the chi-squared distribution to
deter-mine the statistical signiicance of temporal variation
in each period.
In the second stage, we examined, at the beginning of each period, the association between determinants of nutritional status and prevalence of undernutrition. This analysis was carried out using Poisson multiple regres-sion models applied to the 1986 and 1996 surveys. These models, which we refer to as the 1986 and 1996 models, produced adjusted relative risks of undernutri-tion that estimated, at the beginning of each period, the intensity and direction of the independent association between each explanatory variable in the model (deter-minant of nutritional status) and the presence of child
undernutrition. The statistical signiicance of the asso
-ciation was evaluated using the regression coeficient
associated with the explanatory variable (expressed as a continuous variable).
In the third stage, we estimated the effect that changes
in the distribution of the ive determinants may have had
on the evolution of prevalence of undernutrition in each of the periods. This effect was estimated for the 1986-1996 period by comparing mean predicted values for the probability of undernutrition arrived to by applying the 1986 risk model to the DHS 1986 dataset itself and subsequently to the DHS 1996 dataset. Analogously, we estimated the effect of changes occurred in the 1996-2006 period by applying the 1996 model sequentially to the DHS 1996 and DHS 2006 datasets.
In the fourth stage, we attempted to estimate, in each period, the effect which isolated evolution in each of the determinants would have had on prevalence of
undernutrition. This effect was estimated by calculating the “generalized attributable fraction.” This measure corresponds to the proportional reduction in a given disease that would result from a change in the distribu-tion of one or more of its determinants. The generalized attributable fraction is essentially an extension of the “population attributable fraction” applicable to situa-tions in which there are changes in the distribution of risk factors, and not necessarily their elimination. Given that the studied determinants are highly correlated among themselves, we used adjusted estimators of the generalized attributable fraction.1
The following equation below estimates the generalized attributable fraction (Gaf) associated with a change in the distribution of each of the determinants of nutri-tional status under scrutiny:
Gaf = N
N
N
where RRi represents the relative adjusted risk esti-mated for each ith possible combination of the
cate-gories of the ive determinants of nutritional status at
the beginning of the period of interest (1986 or 1996), and Ai and Bi represent the proportion of children in each ith combination, respectively, at the beginning of
the period and in a hypothetical distribution deined by ixing the marginal distribution of the determinant
of interest as observed at the end of the period (1996 or 2006) and the marginal distribution of the other determinants as observed at the beginning of the period. It should be noted that there are 324 possible combinations (N) among the categories of the ive
determinants investigated.
Thus calculated, the generalized attributable fraction estimates the effect of temporal variation in each of the determinants on prevalence of undernutrition. However, the estimated effects for each determinant are not additive, tending to add up to more than the joint effect previously calculated for the changes
observed simultaneously on the ive determinants. This
scenario, which prevents the perfect decomposition of
the set of changes into the ive determinants, results from the artiicial assumption that a change in a given
determinant precedes the changes in the other determi-nants. In any case, the estimate obtained for each of the
determinants is indicative of its relative importance in the evolution of undernutrition in each period.
Statistical analysis, carried out using Stata software, version 10, took into account the individual weighting factors of each survey and the effect of the complex sampling design on the standard error of the estimates.
RESULTS
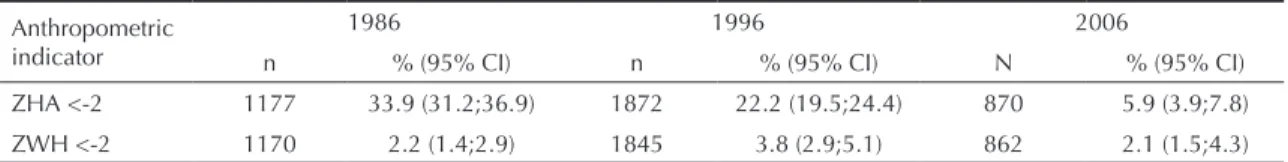
Table 1 presents estimates of the prevalence of
anthropometric deicit in the underive population of
Northeastern Brazil in 1986, 1996, and 2006. Prevalence
of wasting did not vary signiicantly across the three
surveys, remaining at around 2-3%, which is compatible with the expected level for a healthy, well-nourished population. Prevalence of stunting, which was high in 1986 (33.9%), fell in 1996 (22.2%) and even further in
2006 (5.9%), a relative reduction of 34.3% in the irst
period and 73.4% in the second.
Table 2 presents the frequency of determinants of childhood nutritional status in each of the three
surveys. Though evolution of all ive determinants investigated was favorable and signiicant in the two
periods, temporal variations tended to be more marked in the most recent period, especially those relating to family purchasing power and maternal schooling. Regarding family purchasing power, evolution was only marginally favorable between 1986 and 1996, but was exceptionally favorable between 1996 and 2006. Children in the lowest purchasing power class (class E) represented more than half of the child population in 1996, but only one-quarter of this population in 2006. Despite improvements in water supply and sewage, in 2006, only slightly over a quarter of the child population in the Northeast lived in homes with access to the public water supply and sewage services.
Table 3 presents the results of multiple regression models for the association, at the beginning of each period (1986 or 1996), between determinants of nutritional status and occurrence of undernutrition.
Signiicant associations, after adjustment for the remai -ning factors, were found for all determinants in 1996 and for all but health services in 1986.
Table 4 describes the joint effect on undernutrition of
the favorable changes in the ive determinants in each
Table 1. Evolution of the prevalence (%) of anthropometric deficits among children aged zero to 59 months. Northeastern Brazil; 1986, 1996, and 2006.
Anthropometric indicator
1986 1996 2006
n % (95% CI) n % (95% CI) N % (95% CI)
ZHA <-2 1177 33.9 (31.2;36.9) 1872 22.2 (19.5;24.4) 870 5.9 (3.9;7.8)
ZWH <-2 1170 2.2 (1.4;2.9) 1845 3.8 (2.9;5.1) 862 2.1 (1.5;4.3)
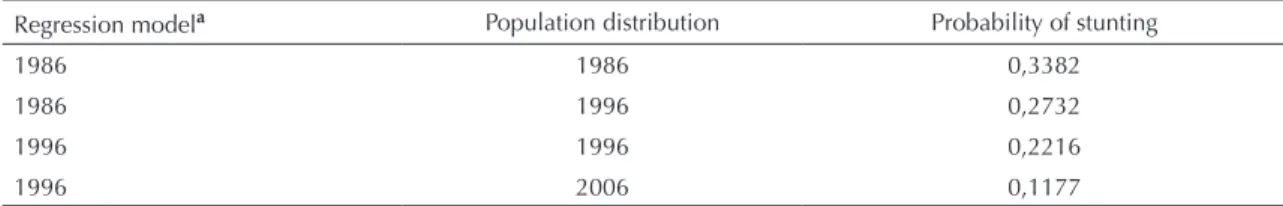
period. These estimates were obtained based on predic-tions regarding the mean probability of undernutrition in which the 1986 risk model is applied in succession to the distribution of determinants in 1986 and 1996, and the 1996 risk model is applied in succession to these distributions in 1996 and 2006.
As expected, the predicted mean probability using the risk model and distribution from a same year was very similar to the actual prevalence of undernutrition in that year. The small differences that exist are the result of the exclusion of children without valid data for all determinants.
Replacing the distribution of determinants observed at the beginning of each period with that of the end of the period “explains” a substantial part of the reduction in prevalence of undernutrition in both periods. For
1986-1996, the mean probability of undernutrition would decline from 33.8% to 27.3%, a relative decrease of roughly 20%, equivalent to a little over half of the decline actually registered in the period (34.5%). For 1996-2006, the mean probability of undernutrition would fall from 22.2% to 11.8%, a relative decrease of almost 50%, or almost two-thirds of the decline actually registered in the period (73.4%). In short, the simultaneous favorable evolution of family purchasing power, maternal schooling, water supply and sewage, health care, and maternal reproductive indicators would account for a little over half of the decline in prevalence of child undernutrition between 1986 and 1996, and almost two-thirds of this decline between 1996 and 2006.
The Figure displays estimates for the decline in preva-lence of undernutrition expected for each period based Table 2. Distribution (%) of children aged zero to 59 months according to family purchasing power, maternal schooling, water supply/sewage and health care services coverage, and maternal reproductive indicators. Northeastern Brazil; 1986, 1996, and 2006.
Variable 1986
(n=1,177)
1996a
(n=1,872)
2006a
(n=870) Family purchasing power class (based on a 5-item scale)
A, B, C 9.1 11.2
-D 16.7 22.0
-E 74.3 66.8
-Family purchasing power class (based on a 10-item scale)
A, B, C - 14.8 34.1
D - 24.5 40.7
E - 60.7 25.2
Maternal schooling (years)
11 or + 8.9 11.6 26.4
8 to 10 6.6 10.9 22.0
4 to 7 22.9 33.1 34.6
0 to 3 61.6 44.3 16.9
Water supply/sewage
Public water and sewage services 8.2 9.8 27.7
One of the above services 20.6 42.3 50.5
None of the above services 71.2 47.9 21.8
Health care
Antenatal care and hospital delivery 46.7 70.1 97.0
One of the above 34.8 20.5 2.3
None of the above 18.5 9.4 0.7
Maternal reproductive indicatorsb
Very unfavorable 18.4 8.4 2.4
Unfavorable 41.8 36.6 25.3
Favorable 39.8 54.9 72.3
a All studied variables varied significantly in relation to the previous period (p<0.01).
b Very unfavorable indicators: birth spacing < 24 months and birth order ≥ 5 or mother’s age at birth < 18 years; unfavorable
on the favorable evolution of each of the determinants investigated, maintaining the distribution of the remaining determinants at the levels observed at the beginning of the period. As explained previously, these estimates, obtained by calculating the generalized attri-butable fraction, are indicative of the relative impor-tance of each determinant on the temporal variation in prevalence of child undernutrition in the period.
Improvements in maternal schooling and in water supply and sewage coverage seem to have driven most of the decline in undernutrition in the 1986-1996 period, each accounting for a relative reduction of approxima-tely 10% in prevalence of undernutrition. Improvement in maternal reproductive indicators occupies an inter-mediate position, and increases in family purchasing power were only marginally relevant. The effect of the
favorable evolution of health care coverage was not estimated for the earlier period since no association was detected between this factor and undernutrition.
The most relevant factor for the decline in undernutri-tion between 1996 and 2006 was the improvement in family purchasing power. This factor alone accounts for a 24.9% decrease in prevalence of undernutrition. Family purchasing power is followed, in order of decreasing contribution, by improvements in maternal schooling, water supply and sewage , reproductive antecedents, and health care.
DISCUSSION
Our analysis of data from three household surveys span-ning a period of 20 years showed a rapid improvement in Table 3. Prevalence (%) and relative risk (RR) of stunting (height-for-age deficit) among children from age zero to 59 months according to potential determinants of nutritional status. Northeastern Brazil; 1986, 1996, and 2006.
Variable
1986 1996
RR RR
% Adjusteda % Adjusteda
Family purchasing power class (based on a 5-item scale) p=0.000 p=0.078
A, B, C 12.3 1
-D 20.9 1.25
-E 39.5 1.54
-Family purchasing power class (based on a 10-item scale) - p=0.000 p=0.000
A, B, C - - 6.6 1
D - - 12.8 1.52
E - - 29.7 2.3
Maternal schooling (years) p=0.000 p=0.000 p=0.000 p=0.002
11 or + 9.7 1 6.4 1
8 to 10 18.4 1.7 10.8 1.43
4 to 7 23.5 1.69 19.4 1.92
0 to 3 42.7 2.44 31.1 2.15
Water supply/sewage p=0.000 p=0.008 p=0.000 p=0.055
Public water and sewage services 13.9 1 9.2 1
One of the above services 20.7 1.06 15.9 1.52
None of the above services 40 1.54 30.2 1.75
Health care p=0.000 p=0.280 p=0.000 p=0.057
Antenatal care and hospital delivery 27.2 1 17 1
One of the above 39.9 0.97 31 1.17
None of the above 39.1 0.87 42.3 1.36
Maternal reproductive indicatorsb p=0.000 p=0.000 p=0.000 p=0.000
Very unfavorable 47.9 1.56 46.1 2.09
Unfavorable 37.9 1.3 29.3 1.6
Favorable 23.4 1 14.3 1
a Adjuisted for all variables in the table.
b Very unfavorable indicators: birth spacing < 24 months and birth order ≥ 5 or mother’s age at birth < 18 years; unfavorable
child nutrition in the Brazilian Northeast. Prevalence of stunting, an indicator of chronic childhood undernutri-tion, fell by roughly one-third between 1986 and 1996, and by almost three-quarters between 1996 and 2006.
Simultaneous improvements in family purchasing power, maternal schooling, water supply, sewage and health care services coverage, and maternal reproduc-tive indicators could account for a little over half the decline in prevalence of child undernutrition in 1986-1996, and for almost two thirds of this decline in 1996-2006. Improvements in maternal schooling and sanita-tion coverage were especially important for the decline
seen in the irst period, whereas increased purchasing
power and, again, improved maternal schooling were decisive in the second period. The acceleration of the
decline between the irst and second periods was consis -tent with the increased intensity of improvements in maternal schooling, water supply/sewage, health care, maternal reproductive indicators, and, especially, the exceptional increase in family purchasing power, seen only in the more recent period.
The probabilistic character of the three surveys, their comparability with regard to the collection and analysis of anthropometric data, and the use of inclusive indi-cators for evaluating nutritional status (stunting and wasting), strengthen the internal and external validity of our present results on the evolution of child under-nutrition. Furthermore, independent health and nutri-tion surveys carried out in the states of Pernambucoa and Alagoasb in periods close to 1996 and 2006 have documented similar reductions in prevalence of stun-ting to those reported in the present study for the entire
underive population of the Brazilian Northeast. The
Chamada Nutricional survey, conducted in 2005 in the 1,133 municipalities of the Brazilian semiarid, most of
which are located in the Northeast Region, estimated the prevalence of stunting at 6.6%,c which is close to the 5.9% prevalence estimated for the Northeast Region in the 2006 DHS.
The recent evolution of the prevalence of growth
deicits in the Brazilian Northeast indicates that the United Nations Millennium Development Goal for
child undernutrition (50% reduction between 1990 and 2015)13 will be widely exceeded, as previously shown for the child population of Brazil as a whole.8
Regarding the causes behind the improvements in nutrition in each of the periods, our results should be understood as an approximation to reality, be it due to the analytical challenges associated with this esti-mation or to the limited availability of inforesti-mation on determinants of nutritional status in the three surveys. One of these limitations is the relative weakness of the indicator used to evaluate health service availability. This indicator was restricted to antenatal care and hospital delivery, and therefore did not include any direct indicator of the care provided to children in their
irst ive years of life. We originally intended to include
in this indicator the extent to which children were compliant with the immunization schedule followed by the primary health care network. However, this proved unviable in light of the inconsistency of the information contained in the 2006 DHS. The number of antenatal care appointments, which could provide a better estimate of the quality of health care provided, was only available for the 1996 and 2006 surveys. Thus, though access to antenatal care is likely to be correlated to a certain degree with access to other health care interventions, it is possible that part of the “impact” of global improvements in health service coverage was not captured by our data.
Table 4. Predicted probability of stunting (height-to-age deficit) based on two multiple regression models and alternative “scenarios” for the distribution of the underfive population according to explanatory variables. Northeastern Brazil; 1986,1996, and 2006.
Regression modela Population distribution Probability of stunting
1986 1986 0,3382
1986 1996 0,2732
1996 1996 0,2216
1996 2006 0,1177
a1986, 1996, and 2006 refer to the survey year based on which the models were constructed and/or from which
distributions were extracted. Explanatory variables in the 1986 model: family purchasing power, maternal schooling, water supply/sewage coverage, and maternal reproductive variables; the same variables plus health service coverage are included in the 1996 model.
a Pesquisa pioneira revela estado de saúde e nutricional do pernambucano. Notícias, Universidade Federal de Pernambuco, 27/08/2008. [cited 2009 Nov 24] Available from: http://www.ufpe.br/new/visualizar.php?id=8834
b Luciano SCM. Transição nutricional: perfil antropométrico das crianças menores de cinco anos do estado de Alagoas. [dissertação de mestrado] Maceió: Faculdade de Nutrição da Universidade Federal de Alagoas; 2008. [cited 2009 Nov 24]. Available from: http://bdtd.ufal.br/ tde_busca/arquivo.php?codArquivo=683
In a previous study of the causes of the decline in
underive nutrition in Brazil, we identiied increases
in maternal schooling, family purchasing power, health care, and sanitation, in this order, as the most relevant factors contributing to the decline in the national prevalence of undernutrition between 1996 and 2006.8 The lack of detailed information on these variables in the national surveys carried out in 1975 and 1989 prevented us from analyzing the determinants of child undernutrition prior to 1996, which we accomplished
for the irst time in the present study.
The marked reduction in the frequency of Northeastern children in class E between 1996 and 2006 is consistent with estimates of family income based on the 2001 and 2007 Brazilian Household Budget Surveys. These estimates indicate that there was in the Northeast a substantial displacement of the population from the lowest to the intermediate income stratum.a Experts on the subject tend to agree that recent improvements in income distribution and reduction of poverty in Brazil are a consequence of the recovery of economic growth and the consequent reduction in unemployment,
higher-than-inlation raises in the minimum wage, and of a
vigorous expansion of income transfer programs.9
The rapid improvement in maternal schooling in the
Northeast Region between 1996 and 2006 relects the
virtual universalization of access to elementary scho-oling and improvements in some of its performance indicators seen across the entire country throughout the 1990’s.5 It is worth noting that most mothers of children surveyed in 2007 either were in elementary school – or were old enough to be in elementary school – in the 1990’s, whereas the reference period for elementary schooling was the 1980’s for mothers studied in 1996 and the 1970’s for those studied in 1986.
The virtual universalization of antenatal care in the Northeast seen between 1996 and 2006 coincides with the expansion, in the entire country, of the Programa
de Saúde da Família (PSF – Family Health Program), a program that emphasizes preventative and educational measures and the promotion of equity in health service supply.11,b In 1998, 1,230 PSF teams were operating in 21.9% of Northeastern municipalities, covering roughly four million people, or 9.3% of the population of Northeastern Brazil.c In 2006, 11,150 PSF teams were operating in 98% of Northeastern municipalities, covering 35 million people, or 67.2% of the population of the Northeast Region.d
0 5 10 15 20 25 30
Poder aquisitivo familiar
Escolaridade materna
Saneamento
Antecedentes reprodutivos
Assistência à saúde
Percentual de declínio 4,1
24,9
10,6
18,7
10
12,9
7,6
11,7
8,7
1996-2006
1986-1996
Figure. Relative reduction (%) in prevalence of stunting (heigh-for-age deficit) attributable to the evolution of selected factors in two periods. Northeastern Brazil; 1986-1996 and 1996-2006.
a Instituto de Pesquisa Econômica Aplicada. PNAD 2007: primeiras análises. Pobreza e mudança social. Brasília; 2008.v.1. (Comunicados da Presidência, 9). Available from: http://www.ipea.gov.br/sites/000/2/comunicado_presidencia/08_09_21_Pnad2007AnalisesPobreza.pdf b Ministério da Saúde. Secretaria de Atenção à Saúde. Departamento de Atenção Básica. Saúde da família no Brasil: uma análise de indicadores selecionados: 1998-2004. Brasília; 2006. [Série C. Projetos, Programas e Relatórios]. Available from: http://dtr2002.saude.gov.br/ caadab/arquivos/Pesquisa_Saude%20da%20Familia%20no%20Brasil.pdf
c Ministério da Saúde. Departamento de Atenção Básica. Consolidado histórico de cobertura da saúde da família - 1998. Brasília; 1998. Available from: http://dtr2004.saude.gov.br/dab/docs/abnumeros/historico_1998.pdf
The modest improvement in water supply and sewage is a result of a slow expansion in the coverage of these public services. Between 2001 and 2007, the proportion of homes in the Northeast connected to the sewage network increased from 22.0% to 29.7%. In the same period, coverage of the water supply network increased from 69.2% to 75.7%.a Brazilian social scientists have drawn attention to the lower visibility and political attractiveness of basic sanitation, highlighting the need to raise the priority of this issue in the Brazilian public policy agenda.10
The progressive reduction in the frequency of unfavorable maternal reproductive indicators is consis-tent with the also progressive reduction in fertility in the Brazilian Northeast, from 5.2 children per woman in 1986 to 3.1 in 1996 and 1.75 in 2006.b,c,d Moreover, the fertility rate in the Northeast in 2006 is no longer higher
than the national average (1.77 children per woman),l as is the case with prevalence of child undernutrition.8
If the annual rate of decline in prevalence of stunting – over 7% – is maintained, the proportion of children in the Northeast Region with height more than two standard deviations below the expected median for their age will reach 2.3% in less than ten years, which would mean equaling the expected proportion (genetically) of low-stature children under optimal conditions of diet, health, and nutrition.16 However, achieving this goal will require the maintenance of initiatives that have favored an increase in purchasing power among the poor in the Brazilian Northeast and – no less importantly – ensuring public investments aiming at completing the process of universalization of access to essential education, health, and water supply and sewage services.
a Instituto Brasileiro de Geografia e Estatística. Sistema IBGE de recuperação automática. Brasília; c2009[cited 2009 Sep 4]. Available from: http://www.sidra.ibge.gov.br
b Institute for Resource Development. Sociedade Civil Bem-Estar Familiar no Brasil. Brasil: Pesquisa nacional sobre saúde materno-infantil eplanejamento familiar 1986.[cited 2009 Nov 24]. Available from: http://www.bemfam.org.br/up/03Capitulo3%20Fecundidade.pdf c Sociedade Civil Bem-Estar Familiar no Brasil. Pesquisa Nacional sobre Demografia e Saúde 1996: relatório da pesquisa. Rio de Janeiro; 1997.[cited 2009 Nov 24]. Available from: http://www.bemfam.org.br/up/10Tabelas.pdf
1. Benichou J. A review of adjusted estimators of attributable risk. Stat Methods Med Res. 2001;10(3):195-216. DOI:10.1191/096228001680195157
2. Black RE, Allen LH, Bhutta ZA, Caulfield LE, Onis M, Ezzati M, et al. Maternal and child under nutrition: global and regional exposures and health consequences. Lancet. 2008;371(9608):243-60. DOI:10.1016/S0140-6736(07)61690-0
3. Ministério da Saúde. Pesquisa Nacional de Demografia e Saúde da criança e da mulher – PNDS 2006: Dimensões do processo reprodutivo e da saúde da criança. Brasília; 2009. Available from: http://bvsms. saude.gov.br/bvs/publicacoes/pnds_crianca_mulher.pdf
4. Cavenaghi S. Aspectos metodológicos e comparabilidade com pesquisas anteriores. In: Ministério da Saúde. Pesquisa Nacional de Demografia e Saúde da criança e da mulher – PNDS 2006: Dimensões do processo reprodutivo e da saúde da criança. Brasília; 2009. [cited 2009 Nov 24] Available from: http://bvsms.saude.gov.br/bvs/publicacoes/pnds_ crianca_mulher.pdf
5. Draibe S. A política social no período de FHC e o sistema de proteção social. Tempo Soc. 2003;15(2):63-101. DOI:10.1590/S0103-20702003000200004
6. Monteiro CA, Benicio MH, Iunes RF, Gouveia NC, Taddei JA, Cardoso MA. Nutritional status of Brazilian children: trends from 1975 to 1989. Bull World Health
Organ. 1992;70(5):657-66.
7. Monteiro CA, Benicio MHD’A, Freitas ICM. Evolução da mortalidade infantil e do retardo de crescimento nos anos 90: causas e impacto sobre desigualdades regionais. In: Monteiro CA, organizador. Velhos e novos males da saúde no Brasil: a evolução do país e de suas doenças. 2. ed. São Paulo: Hucitec; 2000. p.393-420.
8. Monteiro CA, Conde WL, Konno SC, Lima ALL, Silva ACF, Benicio MHD’A. Avaliação antropométrica do estado nutricional de mulheres em idade fértil e crianças menores de cinco anos. In: Ministério da
Saúde. Pesquisa Nacional de Demografia e Saúde da criança e da mulher: PNDS 2006: Dimensões do processo reprodutivo e da saúde da criança. Brasília; 2009. p. 211-28. [cited 2009 Nov 24] Available from: http://bvsms.saude.gov.br/bvs/publicacoes/pnds_ crianca_mulher.pdf
9. Neri MC, coordenador. Miséria, desigualdade e políticas de renda: o Real do Lula. Rio de Janeiro: Centro de Políticas Sociais e Instituto Brasileiro de Economia da Fundação Getulio Vargas; 2007.
10. Neri MC, coordenador. Trata Brasil: saneamento e saúde. Rio de Janeiro: Centro de Políticas Sociais e Instituto Brasileiro de Economia da Fundação Getulio Vargas; 2007.
11. Santana ML, Carmagnani MI. Programa de saúde da família no Brasil: um enfoque sobre seus pressupostos básicos, operacionalização e vantagens. Saude Soc. 2001; 10(1):33-54. DOI:10.1590/S0104-12902001000100004
12. UNICEF Policy Review. Strategy for Improved Nutrition of Children and Women in Developing Countries. New York: United Nations Children’s Fund; 1990. p. 5-36. (Policy Review Paper, E/CEF/1990/1.6).
13. United Nations. The Millennium Development Goals Report 2007. New York; 2007.
14. Victora CG, Adair L, Fall C, Hallal PC, Martorell R, Richter L, et al. Maternal and child undernutrition: consequences for adult health and human capital.
Lancet. 2008; 371(9609): 340-57. DOI:10.1016/
S0140-6736(07)61692-4
15. World Health Organization. Physical status: the use and interpretation of anthropometry. Geneva; 1995. (Report of a WHO Expert Committee. Technical Report Series, 854).
16. World Health Organization. WHO child growth standards: length/height-for-age, for-age, weight-for-length, weight-for-height and body mass index-for-age: methods ad development. Geneva; 2006. REFERENCES