Genetic differentiation and geographical Relationship of Asian barley
landraces using SSRs
Rehan Naeem
1, Lynn Dahleen
2and Bushra Mirza
11
Faculty of Biological Sciences, Department of Biochemistry, Quaid-i-Azam University,
Islamabad, Pakistan.
2
USDA-ARS, Cereal Crops Research Unit, Fargo, ND, USA.
Abstract
Genetic diversity in 403 morphologically distinct landraces of barley (Hordeum vulgare L. subsp. vulgare) originating from seven geographical zones of Asia was studied using simple sequence repeat (SSR) markers from regions of medium to high recombination in the barley genome. The seven polymorphic SSR markers representing each of the chromosomes chosen for the study revealed a high level of allelic diversity among the landraces. Genetic richness was highest in those from India, followed by Pakistan while it was lowest for Uzbekistan and Turkmenistan. Out of the 50 alleles detected, 15 were unique to a geographic region. Genetic diversity was highest for landraces from Paki-stan (0.70±0.06) and lowest for those from Uzbekistan (0.18±0.17). Likewise, polymorphic information content (PIC) was highest for Pakistan (0.67±0.06) and lowest for Uzbekistan (0.15±0.17). Diversity among groups was 40% compared to 60% within groups. Principal component analysis clustered the barley landraces into three groups to predict their domestication patterns. In total 51.58% of the variation was explained by the first two principal compo-nents of the barley germplasm. Pakistan landraces were clustered separately from those of India, Iran, Nepal and Iraq, whereas those from Turkmenistan and Uzbekistan were clustered together into a separate group.
Key words:cluster analysis, genetic diversity, geographical differentiation,Hordeum vulgare, principal component analysis.
Received: April 28, 2010; Accepted: December 9, 2010.
Cultivated barley is one of the oldest known domesti-cated crops suggested to have multiple origins (Molina-Canoet al., 2005). Archaeological studies indicate that it was first domesticated in the Fertile Crescent about 10,000 yeas ago (Zohary and Hopf, 1993). This is assumed to have taken place from two-rowed wild barleyHordeum vulgare
L. subsp.spontaneumin the Near East (Harlan and Zohary, 1966). The research of Badr et al. (2000) supported a monophyletic-barley origin, based on allele frequencies at 400 polymorphic loci. Tibetan wild barley is the proposed progenitor of cultivated barley in the Oriental region (Aberg, 1940). Nevertheless, domestication also occurred in other parts of the world, apart from the Fertile Crescent (Molina-Canoet al., 1999). Recently, Morrell and Clegg (2007) proposed that the domestication of the cultivated form started in the Indus valley, at the site of Mehrgarh (Pa-kistan) at about 7,000 B.C.
Microsatellite markers have been regularly used to evaluate domestication patterns and genetic relationships among barley landraces. Microsatellites, also known as simple sequence repeats (SSRs), are short (1-6 bp) tan-demly repeated DNA sequences that are highly
polymor-phic as a result of frequent variation in the number of times the core sequence is repeated (Tautz, 1989). SSR technol-ogy is useful for evaluating genetic diversity and phylogen-etic relationships within different populations of the genus
Hordeum(Saghai-Maroofet al., 1994).
In the present investigation, 403 landraces of culti-vated barley, originally collected from Pakistan, India, Iran, Nepal, Iraq, Turkmenistan, and Uzbekistan, were as-sessed with a panel of mapped SSRs to estimate regional genetic diversity, phylogenetic relationships and popula-tion structure. The 403 six-rowed and two-rowed landraces were chosen for genetic characterization according to their origin, spike characteristics and growth habits (Table 1). Representative numbers of landraces from each eco-geo-graphical population were collected, except for Uzbekistan, since these were underrepresented in the germplasm bank. The seeds were provided by the Institute of Plant Genetic Resource Program, N.A.R.C., Islamabad.
Genomic DNA was isolated from young barley leaves of 403 individual plants (one representing each land-race) using the CTAB procedure of Doyle and Doyle (1990), with certain modifications, including treatment with RNase A at 37 °C for 45 min. The DNA was purified by phenol: chloroform: isoamyl alcohol extraction and di-ethyl ether treatment. The final pellet was dissolved in Genetics and Molecular Biology, 34, 2, 268-273 (2011)
Copyright © 2011, Sociedade Brasileira de Genética. Printed in Brazil www.sbg.org.br
Send correspondence to Lynn Dahleen. USDA-ARS, NCSL, 1605 Albrecht Blvd. Fargo, ND, 58102, USA. E-mail: [email protected].
Tris-EDTA buffer. The DNA was diluted with deionized water to obtain a working concentration of 25 ng/mL and the quality analyzed by 1% agarose gels.
The landraces were genotyped using seven mapped barley SSRs, one for each chromosome (Table 2). The SSR marker on chromosome 3H was located in a region of me-dium recombination (1.0-4.4 Mb/cM), whereas the other six SSRs were located in regions of high recombination (< 1.0 Mb/cM; Künzelet al., 2000). The SSR assay fol-lowed the procedures of Ramsayet al.(2000), with some modifications, in 25mL of reaction solutions containing 1x reaction buffer, 100 ng of genomic DNA, 1 UTaq polymer-ase (Fermentas Life Sciences, Glen Burnie, MD, USA), 0.15 mM dNTP, and 0.2mM of each primer. Amplification was carried out in a thermal cycler (T1, Biometra, Goet-tingen, Germany) under the following condition: 94 °C for 5 min, 35 cycles of 94 °C 30 s, annealing 1 min, 72 °C 1 min, and a final extension of 10 min at 72 °C. Both an-nealing temperature and MgCl2concentration depended on
the primer pair (Ramsay et al., 2000; Macaulay et al., 2001). Polymorphism was detected under UV light after running on 6% PAGE and staining with ethidium bromide (0.5mg/ mL).
The alleles of each SSR locus were sized (bp) with reference to a known size-standard (O-RangeRuler 20 bp DNA ladder, Fermentas), followed by transformation to bi-nary codes, as presence (1) or absence (0) of the respective fragment size, based on electrophoretic mobility using the procedure of Pau and Southern (1982). Allele frequencies, genetic diversities and homogeneity of allele frequencies were calculated. The number of alleles per locus was counted as the combination of polymorphic bands (Struss and Plieske, 1998). Estimates of the gene diversity index (H), the proportion of polymorphic loci (P), and the mean number of alleles per locus (A) were calculated for each SSR locus and population. Polymorphism information con-tent (PIC) was calculated for each SSR, according to Weber (1990). The genetic diversity index (DI) was estimated as the mean genetic diversity over the loci and adjusted for sample size, according to Nei (1978):
DI= 2na(1/n1S(1-Sxij2))/(2na- 1)
wherexijis the frequency of theithallele of locusj,n1is the
number of genetic loci andnathe number of landraces. All the calculations described above were carried out using the software POPGENE version 1.32 (Yehet al., 1999). The distribution of variability between and within groups was calculated according to Nei (1973) for each microsatellite
Naeemet al. 269
Table 1- Qualitative characteristics of 403 barley landraces used for studying diversity
Origin Sample size Spike type Hull type Awns
2-rowed 6-rowed Covered Hulless Awned Awnless
Pakistan 160 2 158 137 23 159 1
India 76 18 58 70 6 70 6
Iran 56 19 37 56 0 56 0
Nepal 51 9 42 49 2 45 6
Iraq 38 17 21 36 2 37 1
Turkmenistan 17 6 11 14 3 17 0
Uzbekistan 5 2 3 2 3 4 1
Table 2- Total number of alleles and unique alleles for mapped SSR markers in different barley groups.
Locus† Chrom. Number of alleles
Pakistan India Iran Nepal Iraq Turkmenistan Uzbekistan
Bmag0382 1H 4(2)* 3 4(1)* 3 4(1)* 2 2
HVM54 2H 5(3)* 5 5 3 3 4 1
Bmac0023 3H 5(2)* 7(1)* 5(1)* 5 4 3 2
Bmag0490 4H 4 5 4 4 3 3 2
HvLOX 5H 4(1)* 6(1)* 4(1)* 4 3(1)* 2 1
Bmag0500 6H 3 4 4 1 2 1 1
HVID 7H 4 5 3 5 3 4 2
Total 29 35 29 25 22 19 11
*Unique alleles.
locus. The total observed diversity estimate (HT) was parti-tioned into within-group diversity (HS) and between-group diversity (DST) components, whereHT =HS +DST. Gene diversity between groups, in relation to total population di-versity, was expressed asGST =DST/HT. Principal Com-ponent Analysis (PCA) was applied to allele frequencies and implemented with the software package SPSS 11 (SPSS Inc., Chicago, IL, USA), so as to obtain a graphic representation of the relationship structure among the dif-ferent barley groups.
Allelic diversity was evident in all the seven groups of lines, with most markers detecting two or more alleles per group (Table 2). The main exception was the small group of five lines from Uzbekistan, in which three of the markers revealed only one allele. The Indian group pre-sented the highest number of alleles for the seven markers (Table 2), even though the Pakistani had more than twice as many lines. Allelic diversity in the Pakistani and Iranian groups was similar, although unique alleles were more common in the Pakistani. As expected, groups with the fewest members had the fewest alleles. Allelic diversity also varied among the seven markers tested. The highest number (11) of alleles was detected with the chromosome 3H marker, whereas only 5 were with chromosome 4H, 6H and 7H markers in all the 403 lines tested. Furthermore, the latter three revealed no unique group-specific allele. Thirty percent of the alleles were unique to a location.
Allele size diversity, across all the barley accessions, ranged from 26 bp for Bmag0500 on chromosome 6H to 69 bp for HvLOX on chromosome 5H (Table S1), the larg-est size differences by markers generally occurring in the groups with the highest number of alleles. Overall allele frequency ranged from 0.00 to 1.00. In all the groups, ex-cept the Pakistani, there was at least one landrace with a unique marker phenotype. In the latter, the lowest number of landraces with the same marker genotype was five (Bmag0023, 120 bp allele). The most frequent allele in the Pakistani group (Bmag0500, 67 bp allele) was present in only 49% of the lines, whereas in the others, maximum al-lele frequency ranged from 62%-100%.
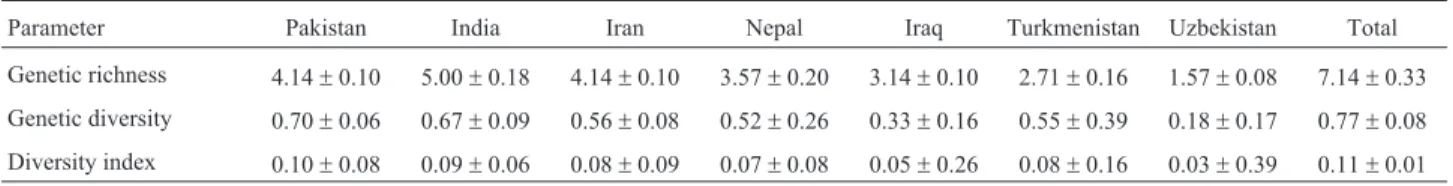
Polymorphism-information content for the seven markers (Table S2) varied from 0.45 (Bmag0500, 6H) to 0.66 (Bmag0023, 3H), with an average of 0.58. Measure-ments of genetic richness (Table 3) followed the same pat-tern as the number of alleles (Table 3), with India having the highest and Uzbekistan the lowest. Genetic diversity was the highest in Pakistan and India, and the lowest in
Uzbekistan. These measurements showed significant differences among the groups, although standard deviation increased to more than half the mean value as the size of the group decreased. The diversity index was not a useful mea-surement for this material, as standard deviations were mostly higher than mean values. Total gene diversity (Ht) across mapped SSR markers was 0.68. Within-group diver-sity (Hs = 0.41) was substantially higher than among popu-lation diversity (Dst = 0.27).
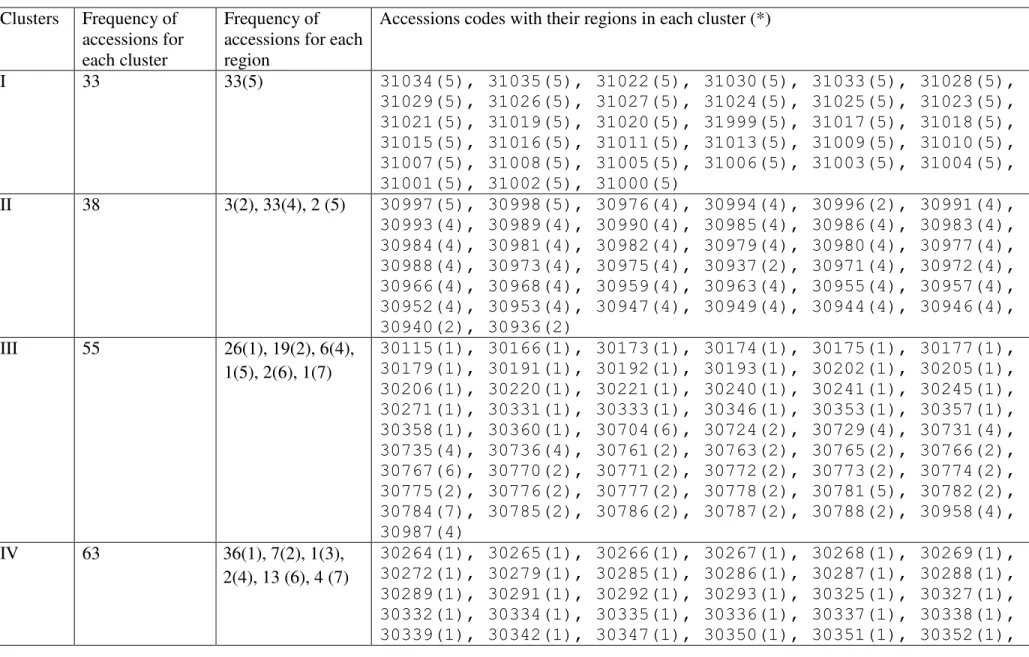
Cluster analysis divided the 403 lines into ten groups (Figure 1, Table S3). The landraces from Pakistan were di-vided into five clusters, not always in accordance with their regional origins. Thus, clusters V and VIII were solely composed of Pakistani landraces, whereas clusters III, IV, and X all had large numbers of landraces from this country. The Indian landraces were spread across seven clusters, with more lines in clusters III, VI, and VII than in the re-mainder. Most Iranian landraces were in clusters IX and VI, with only one in cluster VII and three in cluster X, whereas most from Nepal were in cluster II, most from Iraq in clus-ter I, and most of the Turkmenistani and Uzbekistani land-races in cluster IV.
Principal component analysis based on allele fre-quencies among the groups across mapped SSR markers clustered the barley landraces into three groups (Figure S1). All told, 51.58% of the variation could be attributed to the first two principal components, 33.31% to the first and 18.27% to the second. Group 1 was comprised of acces-sions belonging exclusively to Pakistan, group 2 to India, Iran, Nepal and Iraq, and group 3 only to Turkmenistan and Uzbekistan.
The estimation of genetic diversity is important for the conservation of germplasm. The seven SSRs analyzed in the present study were located in high-recombination chromosomal regions, detecting 50 alleles in the 403 lines including 15 that were unique to a geographic group. Allelic diversity is essential for revealing the potential of germplasm for further conservation studies and plant breeding. The Asian germplasm in our study presented a similar range in number of alleles and alleles per locus, to that detected in previous studies of cultivated barley (Becker and Heun, 1995; Struss and Plieske, 1998; Ivandic
et al., 2002; Matus and Hayes, 2002; Sjaksteet al., 2003; Hamzaet al., 2004; Fenget al., 2006; Malysheva-Ottoet al., 2006; Yahiaouiet al., 2008). In general, as the number of lines included in a diversity study increased, so did the number of alleles/locus (r = .579, p = .0793). As more
270 Barley landrace diversity
Table 3- Genetic richness, genetic diversity, and diversity index for different barley groups across mapped SSR markers.
Parameter Pakistan India Iran Nepal Iraq Turkmenistan Uzbekistan Total
Genetic richness 4.14±0.10 5.00±0.18 4.14±0.10 3.57±0.20 3.14±0.10 2.71±0.16 1.57±0.08 7.14±0.33
Genetic diversity 0.70±0.06 0.67±0.09 0.56±0.08 0.52±0.26 0.33±0.16 0.55±0.39 0.18±0.17 0.77±0.08
Naeemet al. 271
markers were tested, more alleles were detected (r = .758, p = 0.011). Diversity in our survey of 403 landraces from seven regions of Asia was similar to that in 65 naked barley accessions (Fenget al., 2006), and the 163 wild barley land-races and old cultivars tested by Struss and Plieske (1998).
Several studies, including this one, have identified high frequencies of alleles that were unique to a specific re-gion or group of genotypes. We found that 30% of the al-leles were specific for landraces from a single country. Similar studies (Matus and Hayes, 2002; Feng et al.2006; Yahiaoui et al.,2008) detected 15.7%-52% unique alleles inH. vulgarespecific to a germplasm group. Matus and Hayes (2002) suggested that the presence of so many unique alleles could indicate a relatively high rate of muta-tion at SSR loci. Unique alleles may be diagnostic of partic-ular inbred lines or for genotype-specific regions of the genome (Senior et al., 1998). The occurrence of a high number of unique alleles in the present study was an indica-tion of the diversity present in this Asian germplasm, as well as its potential as a reservoir of novel alleles required for crop improvement.
Nevo (1998) showed that allelic distribution at micro-satellite loci is non-random and associated with habitats. He suggested that populations dwelling in drier habitats have higher genetic diversities at microsatellite loci. Chen
et al.(2006) partitioned the total diversity of each locus into average diversity within and among zones. Of the total ge-netic diversity, 17% was attributable to differences among and 83% to differences within the zones. We also found more variability within groups (60%) than between groups (40%).
Ecogeographical diversity analysis is typically ap-plied to identify “centers of diversity”. However, these cen-ters can change over time, as breeding and germplasm exchange continues (Peeters, 1988). The landraces evalu-ated in this study belong to the Mediterranean (India, Paki-stan), Mid-Asian (Iran, Iraq, Turkmenistan, Uzbekistan) and East Asian (Nepal; Knüpffer et al., 2003) Centers. Peeters (1988) evaluated 12 qualitative and 18 quantitative traits in several thousand accessions from around the world. Mean diversity in their germplasm samples was highest in the Indian lines and lowest in the Nepalese. The mean di-versity in germplasm from Iran and Pakistan was similar and intermediate to that from India and Nepal. In our study, the same pattern of genetic richness was apparent (Table 3), thereby indicating that the seven SSR markers used gave a reliable representation of the diversity in these lines.
According to principal component analysis (PCA), the barley landraces could be clustered into three groups, Pakistan in one, India, Iran, Nepal and Iraq in a second, and Turkmenistan and Uzbekistan in a third. Genetic distances indicated greater similarity of Iranian, Nepalese and Iraqi landraces with those from Pakistan and India than with those from Turkmenistan and Uzbekistan. Clustering based on individual landraces reflected the results of group PCA,
with the Pakistani landraces clustering separately from those originating from other countries. These results are in agreement with Ordonet al.(1997), who observed a clear differentiation between East Asian and German cultivars. Similarly, Hamzaet al.(2004) clearly differentiated barley genotypes by UPGMA, according to their geographic re-gions, row number and end use. In another report, Fenget al.(2006) revealed the genetic relationships of 65 acces-sions collected from different regions in China. They ob-served that at a genetic similarity level of about 0.76, the accessions were clearly clustered into two large groups, all the Tibetan accessions being located in one cluster and those from Qinghai and Ganzi in a second.
In conclusion, landraces from Pakistan had a high fre-quency of unique alleles (8/29) and formed a separate group by principle component analysis. Turkmenistan and Uzbekistan landraces grouped together and were distinct from the landraces from the other five countries. Landraces from India showed the highest genetic richness, with the most alleles for the seven SSR markers. Overall, our SSR survey of 403 Asian landraces revealed high levels of allelic variation that could be exploited for barley improve-ment.
References
Aberg E (1940) The taxonomy and phylogeny ofHordeumL. sect. Cerealia Ands., with special reference to Tibetan bar-leys. Symbolae Botan Upsalienses 4:1-156.
Badr A, Müller K, Schäfer-Pregl R, El-Rabey H, Effgen S, Ibra-him HH, Pozzi C, Rohde W and Salamini F (2000) On the origin and domestication history of barley (Hordeum vulgare). Mol Biol Evol 17:499-510.
Becker J and Heun M (1995) Barley microsatellites: Allele varia-tion and mapping. Plant Mol Biol 27:835-845.
Chen X, Guo S, Chen D, Liu P, Jia X and Sun L (2006) Assessing genetic diversity of Chinese cultivated barley by STS mark-ers. Genet Resour Crop Evol 53:1665-1673.
Doyle JJ and Doyle JL (1990) Isolation of plant DNA from fresh tissue. Focus 12:13-15.
Feng ZY, Zhang LL, Yi-Zhang and Hong-Qing L (2006) Genetic diversity and geographical differentiation of cultivated six rowed naked barley landraces from the Qinghai-Tibet pla-teau of China detected by SSR analysis. Genet Mol Biol 29:230-238.
Hamza S, Hamida WB, Rebai A and Harrabi M (2004) SSR-based genetic diversity assessment among Tunisian winter barley and relationship with morphological traits. Euphytica 135:107-118.
Harlan JR and Zohary D (1966) Distribution of wild wheats and barley. Science 153:1074-1080.
Ivandic V, Hackett CA, Nevo E, Keith R, Thomas WTB and Forster BP (2002) Analysis of simple sequence repeats (SSRs) in wild barley from the Fertile Crescent: Associa-tions with ecology, geography and flowering time. Plant Mol Biol 48:511-527.
Knüpffer H, Terentyeva I, Hammer K, Kovaleva O and Sato K (2003) Ecogeographical diversity-a Vavilovian approach. In: Von-Bothmer R, Van-Hintum T, Knüpffer H and Sato K
(eds) Diversity in Barley (Hordeum vulgare). Elsevier, Am-sterdam, pp 53-76.
Künzel G, Korzun L and Meister A (2000) Cytologically inte-grated physical restriction fragment length polymorphism maps for the barley genome based on translocation break-points. Genetics 154:397-412.
Macaulay M, Ramsay L, Powell W and Waugh R (2001) A repre-sentative, highly informative ‘genotyping set’ of barley SSRs. Theor Appl Genet 102:801-809.
Malysheva-Otto LV, Ganal MW and Roder MS (2006) Analysis of molecular diversity, population structure and linkage dis-equilibrium in a worldwide survey of cultivated barley germplasm (Hordeum vulgareL.). BMC Genetics 7:e6. Matus IA and Hayes PM (2002) Genetic diversity in three groups
of barley germplasm assessed by simple sequence repeats. Genome 45:1095-1106.
Molina-Cano JL, Moralejo MIE and Romagosa I (1999) Further evidence supporting Morocco as a centre of origin of barley. Theor Appl Genet 98:913-918.
Molina-Cano JL, Russell JR, Moralejo MA, Escacena JL, Arias G and Powell W (2005) Chloroplast DNA microsatellite anal-ysis supports a polyphyletic origin for barley. Theor Appl Genet 110:613-619.
Morrell PL and Clegg MT (2007) Genetic evidence for a second domestication of barley (Hordeum vulgare) east of the Fer-tile Crescent. Proc Natl Acad Sci USA 104:3289-3294. Nei M (1973) Analysis of gene diversity in subdivided
popula-tions. Proc Natl Acad Sci USA 70:3321-3323.
Nei M (1978) Estimation of average heterozygosity and genetic distance from a small number of individuals. Genetics 89:583-590.
Nevo E (1998) Molecular evolution and ecological stress at glo-bal, regional and local scales: The Israeli perspective. J Exp Zool 282:95-119.
Ordon F, Schimann A and Friedt W (1997) Assessment of the ge-netic relatedness of barley accessions (Hordeum vulgareL.) resistant to soil-borne mosaic-inducing viruses (BaMMV, BaYMV, BaYMV-2) using RAPDs. Theor Appl Genet 94:325-330.
Pau G and Southern EM (1982) Electrophoresis of DNA. In: Rickwood D and Hames BD (eds) Gel Electrophoresis of Nucleic Acids: A Practical Approach. IRL Press Ltd, Ox-ford and Washington DC, pp 39-75.
Peeters JP (1988) The emergence of new centres of diversity: evi-dence from barley. Theor Appl Genet 76:17-24.
Ramsay L, Macaulay M, Ivanissevich SD, Maclean K, Cardle L, Fuller J, Edwards KJ, Tuvesson S, Morgante M, Massari A
et al., (2000) A simple sequence repeat-based linkage map of barley. Genetics 156:1997-2005.
Saghai-Maroof MA, Biyashev RM, Yang GP, Zhang Q and Allard RW (1994) Extraordinarily polymorphic
microsa-tellite DNA in barley: Species diversity, chromosomal loca-tions, and population dynamics. Proc Natl Acad Sci USA 91:5466-5470.
Senior ML, Murphy JP, Goodman MM and Stuber CW (1998) Utility of SSRs for determining genetic similarities and rela-tionships in maize using an agarose gel system. Crop Sci 38:1088-1098.
Sjakste TG, Rashal I and Roder MS (2003) Inheritance of micro-satellites alleles in pedigrees of Latvian barley and related European ancestors. Theor Appl Genet 107:539-549. Struss D and Plieske J (1998) The use of microsatellite markers
for detection of genetic diversity in barley populations. Theor Appl Genet 97:308-315.
Tautz D (1989) Hypervariability of simple sequences as a general source for polymorphic DNA markers. Nucleic Acids Res 17:6463-6471.
Weber JL (1990) Informativeness of human (dC-dA)n(dG-dT)n
polymorphisms. Genomics 7:524-530.
Yahiaoui S, Igartua E, Moralejo M, Ramsay L, Molina-Cano JL, Ciudad FJ, Lasa JM, Gracia MP and Casas AM (2008) Pat-terns of genetic and eco-geographical diversity in Spanish barleys. Theor Appl Genet 116:271-282.
Yeh FC, Yang RC, Boyle TBJ, Ye ZH and Mao JX (1999) POPGENE, The user-friendly shareware for population ge-netic analysis. Molecular Biology Biotechnology Centre, University of Alberta Canada.
Zohary D and Hopf M (1993) Domestication of plants in Old World. The origin and spread of cultivated plants in West Asia, Europe and the Nile Valley. Clarendon Press, Oxford, pp 59-68.
Supplementary Material
The following online material is available for this article:
Table S1 - Allele sizes and frequencies of mapped SSR markers for different barley groups.
Table S2 - Polymorphism Information Content for barley groups using mapped SSR markers.
Table S3 - Clustering of 403 accessions of barley landraces using Un-Weighted Pair Group Arithmetic aver-ages (UPGMA) on the basis of SSRs.
Figure S1 - Principal component analysis of barley landraces based on allele frequencies across mapped SSR markers.
This material is available as part of the online article from http://www.scielo.br/gmb.
Associate Editor: Dario Grattapaglia
License information: This is an open-access article distributed under the terms of the Creative Commons Attribution License, which permits unrestricted use, distribution, and reproduction in any medium, provided the original work is properly cited.