Article
Printed in Brazil - ©2016 Sociedade Brasileira de Química0103 - 5053 $6.00+0.00
*e-mail: [email protected]
Principal Component Analysis of Commercial Tannin Extracts Using Digital Images
on Mobile Devices
Fábio S. Grasel,*,a,b Marco F. Ferrão,b Gilson A. Helferc and Adilson B. Costad
aTANAC S/A, Rua Torbjorn Weibull, 199, 95780-000 Montenegro-RS, Brazil
bInstituto de Química, Universidade Federal do Rio Grande do Sul, Avenida Bento Gonçalves,
9500, 91501-970 Porto Alegre-RS, Brazil
cDepartamento de Computação and dDepartamento de Biologia e Farmácia, Universidade de Santa
Cruz do Sul, Avenida Independência, 2293, 96815-900 Santa Cruz do Sul-RS, Brazil
Tannins from trees are an abundant renewable resource. The use of tannins is safe for the environment and human health, making it possible to develop environmentally friendly products, such as adhesives, flocculant agents for water treatment, flame retardant foams and anticorrosives. In this study, a methodology was developed for the identification of six commercial tannin extracts (chestnut, valonea, tara, myrobalan, quebracho and black wattle) using digital images on mobile devices. The identification of the extracts was based on principal component analysis using the PhotoMetrix® mobile application. In the evaluation of the principal components, it was possible
to define the separation between the six classes of extracts by color evaluation, according to the extract origin. In the analysis of PC1 × PC2, black wattle was very close to quebracho and chestnut was close to valonea; these extracts are chemically similar. The methodology developed for the analysis of tannin extracts obeys the principles of green chemistry requiring no reagents, and is fast, non-destructive and inexpensive.
Keywords: natural tannin, multivariate analysis, mobile application, digital image
Introduction
Tannins are polyphenolic extracts widely found in the plant kingdom; they are synthesized by plants during growth and in response to stress conditions.1 Tannins
are regarded as one of the most significant groups of secondary metabolites in plant defense.2,3 Because they
are widely and abundantly produced in the plant kingdom, these compounds are considered to be a cheap defensive commodity against herbivores and infection.3-7
These compounds have a heterogeneous chemical structure with molecular mass of 500-3000 Da and are soluble in water and polar organic solvents. Traditionally, they have been used in the tanning industry. Tanning is an important process in leathermaking where the hides or skins are treated with tanning agents to convert them into leather. It is estimated that, worldwide, 6,500,000 tons of raw hides or skins are processed annually; metals salts and vegetable tannin extracts are commonly used as tanning agents.8-10
Vegetable leather obtained by tanning with natural extracts is an environmentally friendly, totally natural product. The development of new materials derived from bio-based sources has become a necessity.11,12 When searching for
new and better materials, all relevant ecological guidelines (requiring the replacement of petroleum-based products), have to be taken into consideration.12,13 Tannins from trees,
an abundant resource that is safe for the environment and human health, are one option.13-15
In addition to products being derived from natural sources, the production and characterization processes also need to be environmentally friendly. Multivariate analyses have helped in this process. The use of multivariate analysis enables a faster and precise identification methodology based on statistical methods that simultaneously analyze multiple measurements on each individual or object under investigation.16-19 Recently, a method was developed using
Fourier transform infrared spectroscopy (FTIR) associated with multivariate analysis to identify commercial tannins.16
separation between condensed and hydrolysable tannins can be observed. Among the tannins, chestnut and valonea samples showed the greatest similarity, indicating that these extracts have an equivalent chemical composition, in agreement with the literature.20-24
In another study near infrared spectroscopy (NIRS) was used with partial least squares-discriminant analysis (PLS-DA) for the classification of tannin extracts.17 The
method provided 100% sensitivity and specificity. In another work, a methodology was developed to directly determine the tannin content in Acacia mearnsii bark using near infrared spectroscopy (NIRS) and multivariate calibration methods.16 The results of the prediction
were compared to those obtained through the reference methodology (NBR 11131),25 showing values for the
root mean square error of prediction (RMSEP) between 2.11 and 2.42% for dried and milled bark samples, and 2.31 and 2.54% for in natura samples. The methodology proposed in this work presents an analytical frequency of 10 determinations per hour (including sample preparation procedures), which is significantly higher than the reference methodology (20 hours for each determination).
The analysis of digital images associated with multivariate analysis allows the development of analytical proceedings cheaper, simple, faster and nondestructive, without requiring the use of the equipment such as FTIR, NIR or UV-Vis spectrometers. Moreover, the intrinsic advantages such as requiring no reagents, quick analysis and a noteworthy reduction (the avoidance of chemical characterization) in waste generation all contribute towards the primary objectives of green chemistry.26 Using digital
images obtained by scanners, digital cameras and webcams provides results as accurate as instruments when associated with multivariate analysis.26-28
Digital images of a given scene are a large source of data, through the extraction of picture elements, called pixels, where each pixel is characterized by a variable number of channels. The color system most commonly used for color images is Red Green Blue (RGB). Once extracted the RGB pixel information, Gonzales and Woods29
describe formulas to convert them to other color systems as hue, saturation, value (HSV), hue, saturation, lightness (HSL) and hue, saturation, intensity (HSI), all used in computer vision.In this system, hue is what most people mean by color, for instance the distinction between red and yellow. Saturation is the amount of the color that is present, for instance the distinction between red and pink. Value, lightness or intensity is the amount of light, the distinction between a dark red and light red or between dark gray and light gray.30
Nowadays, smartphones have become a common part of our lives and have changed how we look at life, science
and technology. In this regard, many applications have been developed for different purposes which are related to information delivery. Indeed, these applications can play an important role in chemistry, especially in analytical chemistry.31 Choodum et al.31 developed a methodology
using the digital camera of a smartphone (iPhone) to capture the results a rapid quantitative colorimetric test for trinitrotoluene (TNT) in soil. The authors demonstrated that the iPhone provides the potential use as an ideal novel platform for the development of a rapid on site semi-quantitative field test for the analysis of explosives.
Jia et al.32 presented a novel methodology to determine
glucose in urine using a cell phone camera. The variations in ambient light conditions, imaging positions and even cell phone brands were tested and considered in the calibration. The proposed calibration approach was successfully applied to the detection of glucose in urine by a colorimetric sensor array. In another work, Parastar and Shaye33 developed a novel
smartphone application called the “MVC app” to perform different multivariate calibration methods, such as multiple linear regressions (MLR), principal component regression (PCR) and partial least squares (PLS).
In the present work, a new methodology is proposed based on digital images taken on a smartphone, using the new PhotoMetrix®34,35 application for the identification
of tannins according the source type (chestnut, valonea, quebracho, black wattle, tara and myrobalan). The PhotoMetrix® application in the module “Multivariate
Analysis” captures images using the main camera of the mobile device. The images can be analyzed using their RGB histograms or by a combination of individually selected color channels. Color histograms in the RGB and HSI channels are extracted from the digital images and used as analytical information, and then the principal components are analyzed. It is important to highlight that this app was developed to universal use, in different material, using univariate and multivariate methods to material analysis. But, in this study was used the principal component analysis to segregate commercial tannin extracts using digital images on mobile devices.
Experimental
Samples
analyzed, resulting in a matrix of 30 samples. The extracts were provided by Tanac (Brazil), Silvateam (Argentina), Exandal (Peru), Tannin Sevnica (Slovenia), Samrat Chemical (India) and Air-tu Kymia (Turkey). These products are commercialized in powder form, with a maximum particle size of 210 µm and humidity range of 4 to 8%.
Digital images
To obtain the images, the PhotoMetrix® application
version 1.0.5 in Multivariate Analysis module was used on a Samsung cell phone, model Galaxy Grand Duos GT-19082L.34,35 The images were acquired in
64 × 64 pixels. The PhotoMetrix® application in the module
“Multivariate Analysis” captures images using the main camera of the mobile device. The images can be analyzed using their histograms (R, G, B only) or by a combination of individually selected color channels (R, G, B, H, S, V, L, I) as the pixel color average. The digital images are used as analytical information, and then the main components are analyzed. The phone was mounted on an apparatus made from a cardboard box (16.5 × 29.5 and 9.5 cm in height) with a hole for the phone camera with an ultraviolet lamp (25 W, 220 V), as shown in Figure 1. The UV lamp is usually used to illuminate the environment without interfering with the picture quality. Approximately 12.5 g of each sample were placed in a polyethylene bottle (57 mm diameter and 15 mm height) and compressed, obtaining a flat and straight surface.
PCA analysis
PCA is a classic method for reducing the dimensionality of the original data set, without the relationships between
the samples being modified. This reduction results in a new set of variables called principal components, also called factors or eigenvectors latent variables. This analysis allows us to detect outlier samples compared to the dataset.36 In the PhotoMetrix® application, the PCA is
calculated by a singular value decomposition algorithm (SVD), where X = USVt.37,38 The X matrix is composed
of n rows and m columns corresponding to the number of samples and independent variables, respectively. These variables correspond to the color levels of 1 to 256 for each RGB channel in the histograms, totaling 768 variables. When the channels are used separately (Red, Green, Blue, Hue, Saturation, Value, Lightness, Intensity), then the variables are represented by the average of the pixels in these channels. The matrices U and V are orthogonal to each other and the product of matrices U and S is called the score. The V matrix (transposed) is called the matrix of loadings, with its columns corresponding to the eigenvectors. As a result of principal component analysis, the original data set is grouped on the basis of correlations between the variables, generating a new set of coordinates (PCs-principal components). The PCs are orthogonal to each other, wherein the first principal component (PC1) accounts for most of the variance of the original data; the second principal component (PC2) explains the second greatest variance, and so on.39 In order to optimize the
calculations involving histogram matrices, a feature was developed that excludes variables that contain a zero value for all samples.
Results and Discussion
The pixel segregation model that provided the best results in this work considered the following parameters: hue (H), saturation (S) and brightness (V), further including the information on intensity (I) and luminance (L). Figure 2 illustrates the digital image of tannin extracts for each type captured by a cell phone.
It is observed that each sample has a brownish color with a tendency to different shades of red (a, d) or yellow (c, e) and also some extracts are visually more similar to each other (b, f).
Analyzing the results of the decomposition of the data through PCA (Figures 3-5), it can be seen that 100% of the total variance was explained in the first 3 PCs.
Figure 3 shows the graph of the PC1 scores (66.31%) versus those of PC2 (18.48%). In the graph, it is shown that PC1 separates tara and myrobalan (negative scores) from chestnut and valonea (positive scores). Quebracho and black wattle had scores around zero. Using PC1, it was possible to verify that the tannins with lighter colors were
more negative and the darker tannins were more positive. PC2 separates quebracho and black wattle (positive scores) from myrobalan, chestnut, and valonea (negative scores) and tara (around zero). It can be observed that tannins with similar properties were very close; black wattle with quebracho and valonea with chestnut.
The black wattle and quebracho tannins are formed of oligomers and polymers of flavan-3-ol. The quebracho extract consists of a catechin starter and ent-fisetinidol extender units. The black wattle contains, in addition to catechin starter and fisetinidin extender units, gallocatechin starter and robinetinidin extender units as well.40,41 The
valonea and chestnut tannins are compounds mainly formed by pentagalloylglucose clusters linked to each other. The other main constituents of these commercial tannin extract are castalagin and vescalagin derived from the hydrolysis of polypentagalloylglucose chains. The valonea and chestnut tannins have similar structural configuration, except by tridimensional macromolecular chains.20,42
Figure 4 shows the graph of the PC1 scores (66.31%) versus those of PC3 (15.21%). In the graph, PC3 separates
myrobalan, quebracho and valonea (positive scores) from tara, black wattle and chestnut (negative scores). Contrary to Figure 3, the Figure 4 shows a more definite separation between the black wattle with quebracho and valonea with chestnut.
Figure 5 shows the graph of the PC2 scores (18.48%) versus those of PC3 (15.21%). Analyzing Figure 3 through 5, it can be seen that the three PCs separated and the extracts according to the parameters hue (H), saturation (S), brightness (V), intensity (I) and luminance (L). Analyzing Figure 5, a greater separation between valonea and chestnut can be observed than from Figures 3 and 4. A well-defined separation between the six classes of extracts can be seen in analyzing PC1 to 3.
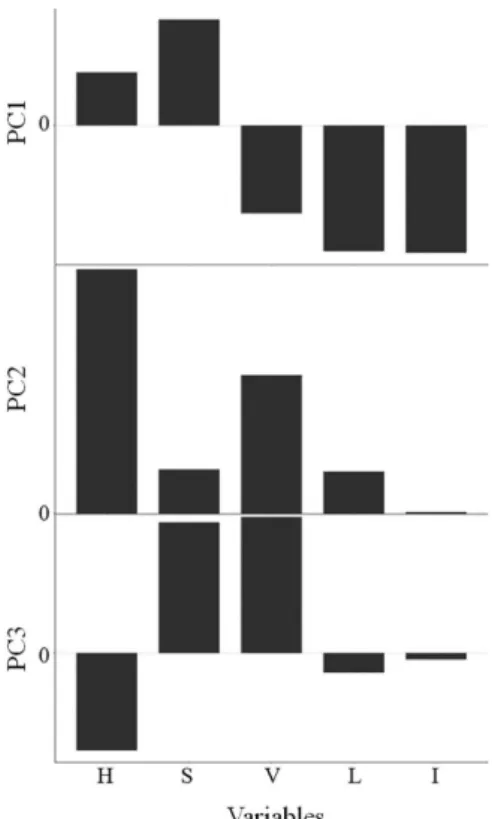
Figure 6 shows the loadings of PC1, PC2, and PC3, in relative scale. It is important to emphasize that the formation of groups as well as their separation observed in Figures 3 through 5 are directly related to the signals observed in their loadings.
In Figure 6, it can be seen that the variables with the greatest influence on the separation of samples on PC1
Figure 2. Digital images for each type of tannin extract captured by a cell phone. (a) Black wattle; (b) chestnut; (c) myrobalan; (d) quebracho; (e) tara; (f) valonea.
Figure 5. Score plots of principal component 2 versus principal component 3.
Figure 4. Score plots of principal component 1 versus principal component 3.
are V, L and I, influencing separation on the negative side of the PC. On the positive side, the variables H and S were less influential. The analysis of loading of PC2 was not conclusive because all variables are on the positive side. What can be noted is that the S and L variables had little influence due to low intensity and the variable I is practically nil in this evaluation. In the loading analysis of PC3, it can be seen that the variables with the greatest influence on the separation of the samples are S and V, which influence separation on the positive side of the PC. On the negative side, the variable H has less influence. The L and I variables are practically nil in the evaluation of PC3.
In relation to the results of the spectroscopic techniques, the color results from PCA were very similar to those observed in the multivariate analysis of structural data by FTIR, but rather than a grouping by chemical similarity, it was by colorimetric similarity. At the analysis by FTIR, the result has shown that PC1 separates the black wattle and quebracho (positive scores) from the tara, myrobalan, chestnut, and valonea (negative scores), the former being condensed tannins and the latter hydrolysable tannins. The principal component 2 separates the tara, myrobalan, and black wattle (positive scores) from the quebracho, chestnut, and valonea (negative scores). The PC3 separates the tara, myrobalan, and quebracho (positive scores) from the black wattle, chestnut, and valonea (negative scores).16
Conclusions
In this study, 30 samples of polyphenolic extracts representing six commercially available types were analyzed by digital images using the PhotoMetrix® mobile application.
In the evaluation of the principal components, a well-defined separation was observed between the classes of the extracts by the color evaluation, according to the extract origin. Principal component analysis of vegetable tannin extracts using digital images offer equivalent results to those obtained by ultraviolet, FTIR and NIR spectroscopy without the need to invest in expensive and sophisticated equipment. The new mobile app presents an efficient PCA of images; moreover, it is easy to handle, has a friendly interface, does not destroy the sample and provides immediate results. The methodology developed for the analysis of tannin extracts obeys the principles of green chemistry as it requires no reagents and can be performed in a fast, non-destructive and inexpensive manner.
Acknowledgments
The authors would like to thank to Conselho Nacional de Desenvolvimento Científico e Tecnológico (CNPq), to Fundação de Amparo à Pesquisa do Estado do Rio Grande do Sul (FAPERGS), to Coordenação de Aperfeiçoamento de Pessoal de Nível Superior (CAPES), to TANAC S/A and to Fundo de Apoio a Pesquisa da UNISC (FAP-UNISC) for supporting this study.
References
1. Natale, A.; Nardiello, D.; Palermo, C.; Muscarella, M.; Quinto, M.; Centonze, D.; J. Chromatogr. A2015, 1420, 66.
2. Clausen, T.; Reichardt, P.; Bryant, J.; Provenza, F. In Plant Polyphenols; Hemingway, R.; Laks, P., eds.; Springer: New York, USA, 1992, p. 639.
3. Furlan, C. M.; Motta, L. B.; Santos, D. Y. A. C.In Tannins: Types, Foods Containing, and Nutrition; Petridis, G. K., ed.; Nova Science Publishers, Inc.: New York, USA, 2010, p. 1. 4. Barbehenn, R. V.; Constabel, C. P.; Phytochemistry2011, 72,
1551.
5. Coley, P. D.; Barone, J. A.; Annu. Rev. Ecol. Syst.1996, 27, 305. 6. Lattanzio, V.; Lattanzio, V. M.; Cardinali, A.; Role of Phenolics in the Resistance Mechanisms of Plants against Fungal Pathogens and Insects-Phytochemistry: Advances in Research; Imperativo, F., ed.; Research Signpost: Kerala, India, 2006, p. 23.
7. Robil, J. L. M.; Tolentino, V. S.; Flora2015, 217, 82. 8. Dixit, S.; Yadav, A.; Dwivedi, P. D. M.; J. Cleaner Prod. 2015,
87, 39.
9. Ramasami, T.; Rao, J. R.; Babu, N. K. C.; Parthasarathi, K.; Rao, P. G.; Saravanan, P.; Gayathri, R.; Sreeram, K. J.; J. Soc. Leather Technol. Chem.1999, 83, 39.
10. Teng, B.; Jian, X.; Gao, Y.; Chen, W.; J. Cleaner Prod.2016,
112, 972.
11. Mohanty, A. K.; Misra, M.; Drzal, L. T.; J. Polym. Environ.
2002, 10, 19.
12. Čop, M.; Lacoste, C.; Conradi, M.; Laborie, M. P.; Pizzi, A.; Sernek, M.; Ind. Crops Prod. 2015, 74, 158.
13. Bozell, J. J.; Petersen, G. R.; Green Chem.2010, 12, 539. 14. Raquez, J. M.; Deléglise, M.; Lacrampe, M. F.; Krawczak, P.;
Prog. Polym. Sci.2010, 35, 487.
15. Sánchez-Martín, J.; Beltrán-Heredia, J.; Delgado-Regaña, A.; Rodríguez-González, M. A.; Rubio-Alonso, F.; Chem. Eng. J.
2013, 228, 575.
16. Grasel, F. S.; Ferrão, M. F.; Wolf, C. R.; Spectrochim. Acta, Part A 2016, 153, 94.
17. Grasel, F. S.; Ferrão, M. F.; Anal. Methods 2016, 8, 644. 18. Menezes, C. M.; Costa, A. B.; Renner, R. R.; Bastos, L. F.;
Ferrão, M. F.; Dressler, V. L.; Anal. Methods 2014, 6, 8299. 19. Tondi, G.; Petutschnigg, A.; Ind. Crops Prod. 2014, 65, 422. 20. Ozgunay, H.; Sari, O.; Tozan, M.; J. Am. Leather Chem. Assoc.
2007, 102, 154.
21. Afsar, A.; Sekeroglu, O.; Afr. J. Biotechnol.2008, 7, 3737. 22. Hassanat, F.; Benchaar, C.; J. Sci. Food Agric.2013, 93, 332. 23. Wischer, G.; Boguhn, J.; Steingaß, H.; Schollenberger, M.;
Rodehutscord, M.; Animal2013, 7, 1796.
24. Wischer, G.; Greiling, A. M.; Boguhn, J.; Steingass, H.; Schollenberger, M.; Hartung, K.; Rodehutscord, M.; Animal
2014, 8, 938.
25. ABNT NBR 11131: Insumos-Tanantes-Determinação do Teor de Constituintes Não-Tanantes e Tanantes, ABNT: Rio de Janeiro, 2008.
26. Costa, G. B.; Fernandes, D. D. S.; Almeida, V. E.; Araújo, T. S. P.; Melo, J. P.; Diniz, P. H. G. D.; Véras, G.; Talanta 2015,
139, 50.
27. Santos, P. M.; Pereira-Filho, E. R.; Anal. Methods2013, 5, 3669. 28. Vilar, W. T. S.; Aranha, R. M.; Medeiros, E. P.; Pontes, M. J.
C.; J. Braz. Chem. Soc.2015, 26, 102.
29. Gonzalez, R. C.; Woods, R. E.; Image Processing-Digital Image Processing, vol. 2; Ed. Pearson Education: New Jersey, USA, 2008.
30. Russ, J. C.; The Image Processing Handbook, 6th ed.; CRC Press: New York, USA, 2011.
31. Choodum, A.; Kanatharana, P.; Wongniramaikul, W.; Daeid, N. N.; Talanta2013, 115, 143.
32. Jia, M. Y.; Wu, Q. S.; Li, H.; Zhang, Y.; Guan, Y. F.; Feng, L.;
Biosens. Bioelectron. 2015, 74, 1029.
33. Parastar, H.; Shaye, H.; Chemom. Intell. Lab. Syst. 2015, 147, 105.
34. http://www.photometrix.com.br/, accessed in April 2016. 35. https://play.google.com/store/apps/details?id=com.ghelfer.
photometrix&hl=pt_BR, accessed in April 2016.
36. Ferreira, M. M. C.; Quimiometria: Conceitos, Métodos e Aplicações, vol. 1, 1a ed.; Editora da Unicamp: Campinas, Brasil, 2015.
37. Damasceno, D.; Toledo, T. G.; Godinho, M. S.; da Silva, C. P.; de Oliveira, S. B.; de Oliveira, A. E.; Quim. Nova2015, 38, 836.
38. Geladi, P.; Kowalski, B. R.; Anal. Chim. Acta1986, 185, 1. 39. Bro, R.; Smilde, A. K.; Anal. Methods 2014, 6, 2812. 40. Venter, P. B.; Senekal, N. D.; Kemp, G.; Amra-Jordaan, M.;
Khan, P.; Bonnet, S. L.; Westhuizen, J. H.; Phytochemistry
2012, 83, 153.
41. Reid, D. G.; Bonnet, S. L.; Kemp, G.; Westhuizen, J. H.;
Phytochemistry2013, 94, 243.
42. Pasch, H.; Pizzi, A.; J. Appl. Polym. Sci.2002, 85, 429.
Submitted: January 27, 2016 Published online: May 4, 2016