Article
J. Braz. Chem. Soc., Vol. 26, No. 2, 224-232, 2015. Printed in Brazil - ©2015 Sociedade Brasileira de Química 0103 - 5053 $6.00+0.00
A
*e-mail: [email protected]
Upgrade of Biofuels Obtained from Waste Fish Oil Pyrolysis by Reactive Distillation
Alberto Wisniewski Jr.,*,a Lorena Wosniak,b Dilamara R. Scharf,b Vinicyus R. Wiggers,c Henry F. Meierc andEdesio L. Simionattob
aChemistry Department, Federal University of Sergipe (UFS), 49100-000 São Cristóvão-SE, Brazil
bChemistry Department and cChemical Engineering Department,
University of Blumenau (FURB), 89030-000 Blumenau-SC, Brazil
Bio-oil is classified as second-generation biofuel and it is produced mainly through the pyrolysis of a waste lignocellulosic biomass base. The application of this product is still very limited, due to some of its chemical characteristics. This paper presents a proposal for the reduction of the acidity of bio-oil obtained from waste fish oil, previously produced and characterized as described in the literature, applying the reactive distillation process. This process is primarily based on the conversion of carboxylic acids into their corresponding esters by adding a widely available alcohol and a simple and cheap catalyst in the process for the fractional distillation of crude bio-oil to obtain light and heavy bio-oil, that is, fractions which are equivalent to the fossil fuels gasoline and diesel, respectively. The alcohols tested were methanol and ethanol and the catalysts were H2SO4, H3PO4, NaOH and Na2CO3, in proportions of 10 and 0.5 wt.%, respectively. The light bio-oil was obtained within a temperature range of 42 to 198 ºC with yields of 27.0 to 43.1% and the heavy bio-oil was recovered at 93 to 230 ºC with yields of 42.6 to 49.2%. The greatest acidity reduction was observed employing methanol+H2SO4 (95% and 43% for light and heavy bio-oils, respectively). The fractions produced were characterized by gas cromatography/mass spectrometry (GC-MS) and gas chromatography with flame ionization detector (GC-FID), applying the compound classification process PIONA (Paraffins, Iso-paraffins, Olefins, Naphtenes and Aromatics), revealing a homologous series of 1-alkenes and
n-alkanes along with some aromatic compounds. The 1H and 13C NMR analysis showed that the process had no significant influence in relation to the carbons and hydrogens associated with the methyl, methylene, methyne and olefinic groups.
Keywords: bio-oil, waste fish oil, pyrolysis, biofuels, reactive distillation, acidity index, bio-oil upgrade
Introduction
Biofuels represent a concrete and promising solution for reducing the dependence on fossil fuels and the greenhouse gas emissions. Most of the production technologies are in the early stages of development and improvements are still required. Advanced biofuels are expected to become cost-competitive with conventional fossil fuels around 2030 and experts have indicated a possible ceiling in relation to the diffusion of vehicles running on biofuels in the private market being reached by 2050.1 Based on the
raw materials and technology used for their production, biofuels are classified as follows: (i) first generation, where the biomass is processed and produced in the form of solids (e.g. charcoal), liquids (e.g. ethanol, biodiesel and bio-oil)
or gases (e.g. biogas); (ii) second generation, produced following two fundamentally different approaches, that is, biological or thermochemical processing, from agricultural
lignocellulosic biomass; and (iii) third generation,
specifically derived from microbes and microalgae. Second generation biofuels are characterized by the pyrolysis of waste material, leading to a lower cost being associated with the raw materials and limiting the competition
between fuel and food.2 According to the Food and
Agriculture Organization, world production of fish in 2011 was 154 million tonnes, almost 131 million tonnes being directed toward human consumption. Around 50% of processed fish becomes waste material, in which the
amount of oil ranges from 40 to 65%.3
bio-oils obtained from the TAG pyrolysis process are alkanes, as in the case of petroleum-based diesel fuels, alkenes, alkadienes, aromatics and carboxylic acids.4 This
characteristic chemical composition is commonly found in bio-oils obtained from TAG pyrolysis and the proposed mechanism for the formation of these chemical constituents was discussed in 1947.5 Bio-oils are viscous liquid biofuels
with low pH, containing more than 300 compounds some of which are unstable and degrade over time and this hinders their use directly as diesel fuel or in diesel blends.6
Some requirements for the use of bio-oil for industrial equipment like burners not intended for use in residential heating, small commercial boilers, and motor or marine applications, are detailed in ASTM D7544 - 2009.7 Prior to
their use as a substitute for fuels and chemicals derived from petroleum, bio-oils require considerable improvements in their features.8 More recently, the international standard
ASTM D7566 - 2014a and Resolution No. 20/2013 of the Brazilian National Agency of Petroleum, Natural Gas and Biofuel (ANP) have defined the specifications for synthesized paraffinic kerosene (SPK) produced from hydroprocessed esters and fatty acids (HEFA) for use as a synthetic blending component in aviation turbine fuels for civil aircraft and engines.9,10 This results in a very promising
perspective for the use and application of new biofuels for transport purposes.11
Techniques to improve the quality of the bio-oil should involve modifying the chemical composition and some properties, such as the viscosity, pH and thermal stability.12
In this regard, the technologies available include catalytic cracking,13,14 emulsification,8 hydrodeoxygenation,15
catalytic esterification,16-20 molecular distillation,21 catalytic
hydrothermolysis22 and reactive distillation.8,23 All of these
processes have advantages and disadvantages as upgrading techniques for bio-oil.24 Reactive distillation is a separation
process where fractional distillation is accompanied by chemical reactions in some or all stages of the distillation column. These reactions are triggered by the introduction of a reactive solvent which will react selectively with one of the components of the mixture inside the column. The products formed are removed from the column with relative ease.25
In previous studies,26,27 some physico-chemical
properties of the waste fish oil, crude bio-oil, light bio-oil and heavy bio-oil were determined and on evaluating the results the acidity index was found to be high considering the Brazilian fuel specifications.26 Therefore, in this study,
the reactive distillation of crude bio-oils obtained from the thermal cracking of waste fish oil was investigated as a method to upgrade these biofuels. The physico-chemical characteristics of upgraded biofuels were evaluated.
Material and Methods
Crude bio-oil
The raw material for this study was obtained from the thermal cracking of waste fish oil in a continuous pilot plant at 525 °C with a mass flow of up to 3.2 kg h−1 and
characterized in terms of its physico-chemical properties.27
Upgrading of the bio-oil
A glass fractional distillation apparatus equipped with 14/20 joints, a round bottom flask (125 mL), a fraction distillationcolumn (10 × 190 mm), a thermometer adapter, condenser and a heating mantle were used. A mass of 25 g of crude bio-oil (CBO) was added to the round bottom flask with 2.5 g of alcohol, methanol or ethanol (MeOH or EtOH) and 0.125 g of catalyst (H2SO4, H3PO4, NaOH or Na2CO3).
The reactive distillation was started and the temperature of the vapor phase was measured at the top of fraction distillation column. The light bio-oil was removed with the condenser operating at 8 °C and at atmospheric pressure. The heat was turned off when the temperature of the vapor reached 200 °C and the fractionation distillation column was removed changing the system to a simple distillation apparatus. The distillate flask was replaced and the heat turned on again with the condenser now operating at ambient temperature. The heavy bio-oil (HBO) was then removed at a temperature of below 230 °C. The reagents used were of analytical grade. The experiments (Exp) carried out to obtain the light bio-oil (LBO) and HBO are shown in Table 1.
Physico-chemical characterization
The physical and chemical properties of the light and heavy bio-oils were determined using ASTM standard methods, including density (ASTM D 4052), acidity and
iodine values (ASTM D 974 and pr EN 14111) and sulfur
residue (ASTM D 4294).
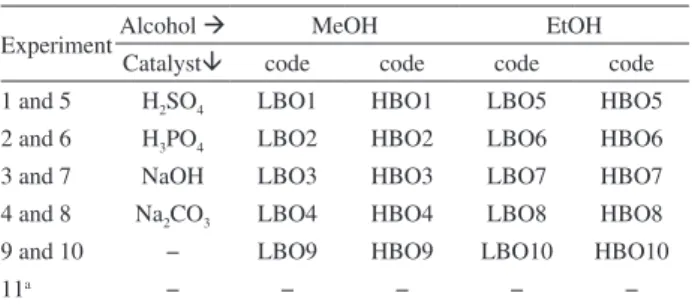
Table 1. Experimental planning for reactive distillation
ExperimentAlcohol MeOH EtOH
Catalyst code code code code 1 and 5 H2SO4 LBO1 HBO1 LBO5 HBO5 2 and 6 H3PO4 LBO2 HBO2 LBO6 HBO6
3 and 7 NaOH LBO3 HBO3 LBO7 HBO7
4 and 8 Na2CO3 LBO4 HBO4 LBO8 HBO8
9 and 10 − LBO9 HBO9 LBO10 HBO10
11a − − − − −
1H and 13C NMR analysis of biofuels
The NMR spectra for the upgraded light and heavy
bio-oil samples were recorded at 22 oC using a Bruker
AC-300 spectrometer at 300.13 MHz (1H) and 75.47 MHz
(13C). Chemical shifts were referenced in parts per million
(ppm) relative to the signal of tetramethyl silane (TMS). The concentration of the samples was ca. 5 wt.%.
Gas chromatography conditions
The PIONA (Paraffins, Iso-paraffins, Olefins, Naphtenes and Aromatics) classification of the compounds of the light bio-oil into chemical classes and gas cromatography/mass spectrometry (GC-MS) analysis of the heavy bio-oil were carried out as described
previously.26 The gas chromatography with flame
ionization detector (GC-FID) analysis of the heavy bio-oil was carried out on a Shimadzu GC-2010 chromatograph, equipped with a Rtx-1 (100% dimethyl polysiloxane, 30 m × 0.32 mm; film thickness 3 µm), using helium (99.999%) as the carrier gas with a constant flow of 1.2 mL min−1, oven temperature of 150 °C (1 min) ramping
at 5 °C min–1 to 280 °C (23 min), injector temperature
of 250 °C, FID temperature of 280 °C and injection
volume of 1.0 µL. The aqueous phase, produced only
in the case of some upgraded light bio-oil samples, was analyzed for carboxylic acid determination in a Shimadzu GC-14B chromatograph with a Stabilwax column (100% polyethylene glycol, 30 m × 0.25 mm; film thickness 0.25 µm), using nitrogen (99.996%) as the carrier gas with a constant pressure of 100 kPa, oven temperature of
80 °C (3 min) ramping at 8 °C min−1 to 150 °C (5 min),
injector temperature of 150 °C, FID temperature of 300 °C and injection volume of 0.3 µL.
Results and Discussion
Reactive distillation
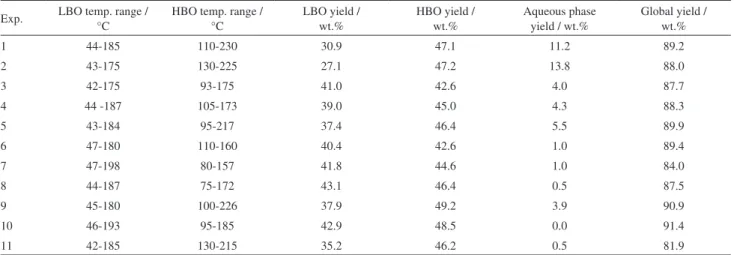
The reactive distillation of crude bio-oil (CBO) produced upgraded light bio-oil (LBO) and heavy bio-oil (HBO). After leaving the LBO to stand, an aqueous phase separated out spontaneously. The distillation ranges and the mass balances are given in Table 2. The yields were determined considering the mass of alcohol and catalyst and the difference in global yields was attributed to a crude oil waste present in the final stage of the distillation process.
The LBO was obtained as a light yellow to green liquid and the HBO as a dark brown fraction within the boiling ranges of gasoline and diesel, respectively. The main influence of the proposed reactive distillation processes observed was slight changes in the initial boiling point of the HBO fractions, and this could not be attributed to a specific type of catalyst or alcohol used. The global yields were around 89%; however, in the experiments with methanol catalyzed by sulfuric acid and phosphoric acid an aqueous phase was observed. Considering that in the reactive distillation the esterified carboxylic acid produces water as a sub-product, in Table 2 Exp1 and Exp2 show the highest water content values, which leads us to conclude that a greater amount of acids was converted into esters, decreasing the acidity of the final product. All of the aqueous phases were analyzed by GC-FID employing a polar column (Stabilwax) to investigate mainly the presence of residual unesterified carboxylic acids. The aqueous phase of the fraction obtained in the absence of alcohol and catalyst, LBO11, contained 59.5% (v/v) of acetic acid. The aqueous phase of the LBO fractions obtained from the reactive distillation process contained 3.4-7.8% (v/v) of
Table 2. Boiling point range and mass balance for reactive distillation
Exp. LBO temp. range / °C
HBO temp. range / °C
LBO yield / wt.%
HBO yield / wt.%
Aqueous phase yield / wt.%
Global yield / wt.%
1 44-185 110-230 30.9 47.1 11.2 89.2
2 43-175 130-225 27.1 47.2 13.8 88.0
3 42-175 93-175 41.0 42.6 4.0 87.7
4 44 -187 105-173 39.0 45.0 4.3 88.3
5 43-184 95-217 37.4 46.4 5.5 89.9
6 47-180 110-160 40.4 42.6 1.0 89.4
7 47-198 80-157 41.8 44.6 1.0 84.0
8 44-187 75-172 43.1 46.4 0.5 87.5
9 45-180 100-226 37.9 49.2 3.9 90.9
10 46-193 95-185 42.9 48.5 0.0 91.4
acetic acid, showing the efficiency of the acidity reduction achieved with the esterification process. The fingerprint chromatograms of the aqueous phases also revealed the presence of many other compounds which cannot be identified by GC-FID due to the limitations of carboxylic acid standards. Considering the initial mass of waste fish oil and the conversion efficiency for the production of the crude bio-oil (CBO),27 the yields for the upgraded biofuels
were converted and reported based on the initial waste fish oil mass, to determine the yield expected from the raw material source. The results were 27.8% of LBO and 33.5% of HBO, which are close to the results obtained for the samples produced without treatment with an alcohol and a catalyst (Exp11), where the yields were 25.6% of LBO and 33.6 % of HBO.
Light bio-oil
The light bio-oils were characterized according to their physico-chemical properties (acidity index, iodine value, sulfur content and density) and the results are shown in Table 3.
The values for the acidity index shown in Table 3 were determined for all samples immediately after the reactive distillation, before the spontaneous separation of the aqueous phase, when the LBO presented a single homogeneous phase. The acidity of this fraction is attributed to the presence of carboxylic acids formed during the TGA pyrolysis. It is clear that the process with methanol and sulfuric acid (Exp1) provided the greatest reduction in acidity (around 94.3%) followed by Exp2 with the same alcohol and phosphoric acid as the catalyst (56.4% acidity decrease). It was observed that the acidity of the LBO samples decreased with better aqueous phase separation, for example, in the case of LBO5 it changed
from 50.6 to 11.5 mg KOH g −1, which can be explained
by the strong affinity of polar carboxylic acids for the aqueous phase. The main problem found in relation to the product with the greatest acidity decrease was the increase in the sulfur content of the final product, which is attributed to the catalyst (H2SO4). All of the LBO samples
obtained from the acid catalysis process were washed with a 0.1 mol L−1 solution of Na
2CO3 in the proportion of 3:5
(LBO:Na2CO3) to remove the residual catalyst and the
final acidity values were 0.8, 28.7, 1.7, and 52.0 mg KOH
g−1, respectively, for LBO1, LBO2, LBO5, and LBO6. As
previously mentioned, the main objective of this study was to apply the distillation process employed to refine the crude product, in the form of a reactive process, to convert the residual carboxylic acids present in the crude bio-oil into their respective esters and decrease the acidity of the final products. In these experiments it was clear that the purpose was reached employing methanol as the reactant, for all catalysts (acid or basic, weak or strong). However, our proposed use of ethanol as the reactant, which is a less toxic alcohol and more abundant in Brazil, showed a significant reduction when sulfuric acid was used as the catalyst. The final sulfur contents are reported in Table 3. The density showed a slight improvement with a decrease in the values when compared to those for the fraction LBO11 obtained without any treatment. The iodine value did not show any significant difference after the processes, indicating that the unsaturated compounds were not modified.
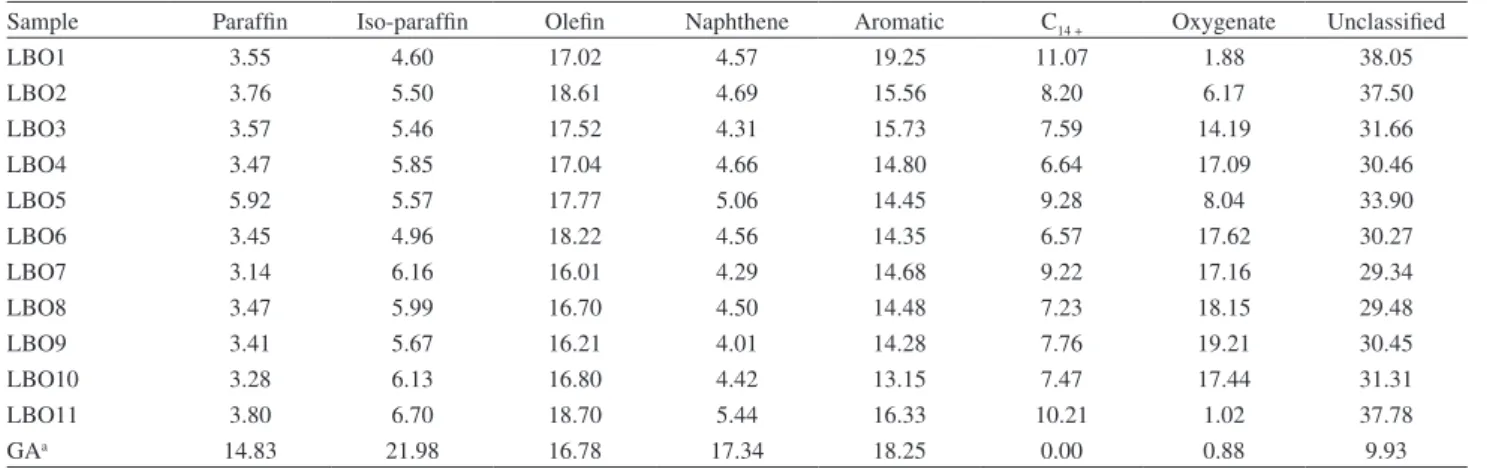
PIONA (Paraffins, Iso-paraffins, Olefins, Naphtenes and Aromatics)
All LBO fractions were submitted to Detailed Hydrocarbon Analysis (DHA), where the constituents of light biofuels are grouped into their respective chemical classes and, using the detector response factor, the
Table 3. Physico-chemical properties of LBO
Fraction Acidity index / (mg KOH g−1) Iodine value / (cg I
2 g −1) Density / (kg m−3) Sulfur content / wt.%
LBO1 7.6 127.3 843.8 0.05
LBO2 57.8 143.0 842.5 0.01
LBO3 85.9 140.6 844.7 −
LBO4 88.3 142.8 848.7 −
LBO5 50.6 128.0 835.5 0.05
LBO6 114.6 117.4 842.0 0.01
LBO7 140.2 125.7 842.2 −
LBO8 137.8 120.8 844.4 −
LBO9 130.4 138.5 844.4 −
LBO10 136.5 144.3 842.2 −
LBO11 172.7 121.1 857.0 0.01
relative peak area on the chromatogram is converted into a theoretical v/v percentage, as shown in Table 4.26,28,29 The
predominance of aromatics and olefins is characteristic of products obtained from the thermal cracking of triglycerides and the contents present in the LBO fractions are equivalent to those in Brazilian gasoline (petroleum-based fuel). The presence of oxygenates was more evident in the LBOs obtained from poor reactive processes, as a
residue of the alcohols used in the reactive distillation, and the other chemical classes of the upgraded LBO samples did not differ notably from those observed for the LBO11 obtained with no reactive process.
LBO1 showed the best physico-chemical aspects and contained more than 450 compounds, with 44 major compounds representing 50% of the total composition of this sample. The main compounds are listed in Table 5.
Table 4. Hydrocarbon classification (%) for LBO fractions (DHA)
Sample Paraffin Iso-paraffin Olefin Naphthene Aromatic C14 + Oxygenate Unclassified
LBO1 3.55 4.60 17.02 4.57 19.25 11.07 1.88 38.05
LBO2 3.76 5.50 18.61 4.69 15.56 8.20 6.17 37.50
LBO3 3.57 5.46 17.52 4.31 15.73 7.59 14.19 31.66
LBO4 3.47 5.85 17.04 4.66 14.80 6.64 17.09 30.46
LBO5 5.92 5.57 17.77 5.06 14.45 9.28 8.04 33.90
LBO6 3.45 4.96 18.22 4.56 14.35 6.57 17.62 30.27
LBO7 3.14 6.16 16.01 4.29 14.68 9.22 17.16 29.34
LBO8 3.47 5.99 16.70 4.50 14.48 7.23 18.15 29.48
LBO9 3.41 5.67 16.21 4.01 14.28 7.76 19.21 30.45
LBO10 3.28 6.13 16.80 4.42 13.15 7.47 17.44 31.31
LBO11 3.80 6.70 18.70 5.44 16.33 10.21 1.02 37.78
GAa 14.83 21.98 16.78 17.34 18.25 0.00 0.88 9.93
aGA: gasoline (petroleum-based fuel).
Table 5. Chemical composition LBO1 (main compounds)
Peak RT / min RIa Compound DHA%b
1 6.675 390.84 Methanol 1.60
13 9.142 510.17 cis-2-pentene 0.67
24 12.409 583.41 1-hexene 1.45
40 17.334 640.17 Benzene 0.92
57 21.935 685.12 1-heptene 2.31
80 31.239 748.64 Toluene 1.29
95 37.384 788.74 1-octene 2.00
96 37.942 791.83 trans-1,2-dimethylcyclohexane 0.50
100 39.414 800.00 n-octane 0.52
121 48.480 837.38 Ethylbenzene 0.82
133 54.859 863.74 3-ethylheptane 0.70
135 56.127 868.99 o-xylene + 1,1,2-trimethylcyclohexane 0.49
140 60.092 885.30 1-nonene 2.38
146 63.340 900.00 n-nonane 0.59
150 65.247 910.14 Isopropylbenzene 0.60
161 71.668 944.30 n-propylbenzene 0.49
192 80.442 990.94 1-decene 2.33
204 83.090 1007.67 1-methyl-3-isopropylbenzene 1.31
251 93.225 1090.04 1-undecene 2.45
260 95.132 1106.99 1,2,3,5-tetramethylbenzene 1.33
280 98.956 1146.17 n-pentylbenzene 0.85
288 100.657 1163.61 Naphthalene 0.89
301 103.207 1189.73 1-dodecene 2.14
346 111.748 1277.25 2-methylnaphthalene 1.23
389 119.415 1355.80 n-hepthylbenzene 1.78
Total 31.64
Figure 1 shows the chromatogram for LBO1 with the numbered identification of the main compounds, such as aromatics and olefins, revealing the presence of 1-alkanes as well as monoaromatics and naphthalene derivatives (as shown in Table 5). Aromatics and olefins are known for their high octane numbers (anti-knocking properties) and these results verify the possibility of applying the LBO fraction directly as a biofuel or blended with gasoline fuel and/or other biofuel derivatives.30
It can be noted from the C14+ content and the high
concentration of compounds above peak 192 that this fraction needs to be improved, perhaps with the use of a more efficient fractional distillation column for possible use as a gasoline additive.
Heavy bio-oil
The physico-chemical properties of the upgraded HBOs are shown in Table 6. It is clear that there were no significant changes in the parameters investigated, with the exception of the acidity. The best result was obtained for a sample too rich for the methanol/sulfuric acid process, with an acidity decrease of 42.5%. The value of 86.9 mg KOH g−1 differed considerably from the
legally stipulated values (for example, 0.5 mg KOH g−1)
for the acidity of Brazilian biodiesel blended with diesel (5%). This high acidity value was attributed to residual fatty acids (C14:0 and C16:0) present in the HBO
fractions.
A further test was performed applying 0.5 g of an ion exchange resin (mixed cationic/anionic) to 2, 4, 8, 12 and 16 mL of HBO11 at 23 °C for 30 min. This procedure was previously tested for biodiesel purification and no effect on the acidity was noted.31 However, for HBO11, reductions
in the acidity of 4% for a ratio of 0.5 g:16 mL and 8% for 0.5 g:4 mL were observed.
HBO chemical composition
The GC-FID analysis of the HBO fractions revealed that the major compounds were a homologous series of 1-alkene and n-alkanes. Figure 2 shows the chromatograms for HBO1 and diesel. The HBO1 sample obtained by fractional reactive distillation showed a lower amount of fatty acid residues, in contrast to previously reported results obtained applying a simple distillation process.26
This optimization of the distillation process, together with the reactive process, contributed to decreasing the acidity of the heavy bio-oils.
The distribution of the HBO fractions according to the relative area on the GC-FID spectra into hydrocarbon ranges shows a high content (around 22%) of n-C4 to n-C10
for all fractions. This is a high level when compared with diesel (ca. 8%). All other homologous hydrocarbon ranges Figure 1. Detailed hydrocarbon analysis of LBO1.
Table 6. Physico-chemical properties of HBO samples
Sample Acidity index / (mg KOH g−1)
Iodine value / (cg I2 g−1)
Density / (kg m−3)
Sulfur content /
wt.%
HBO1 86.9 75.6 881.9 0.02
HBO2 108.1 76.8 873.7 −
HBO3 109.4 81.4 862.7 −
HBO4 122.6 83.8 869.3 −
HBO5 123.6 81.6 863.0 −
HBO6 94.8 79.4 865.2 −
HBO7 116.3 77.0 861.7 −
HBO8 122.9 82.8 867.9 −
HBO9 134.8 75.0 882.1 −
HBO10 135.9 75.9 876.2 −
HBO11 151.1 67.0 872.1 0.01
above n-C10 presented contents of around 5%, with the
exception of n-C15 due to the presence of average levels of
10% in the HBO fractions. The baseline drift near n-C20
observed on the chromatogram for the HBO1 fraction (Figure 2) and for all other HBO fractions was investigated with a hard methanolic/sulfuric acid esterification process and the fatty acid residue was identified as tetradecanoic and hexadecanoic acids.
1H and 13C NMR analysis of upgraded and non-upgraded
light bio-oil and heavy bio-oil
The 1H NMR spectra for all samples of light and heavy
bio-oils showed spectral similarities, except in the case of the mol% hydrogen distribution. The data for the unreacted and upgraded fractions are given in Table 7. It is clear from the results that for the light fraction of the bio-oil the reactive distillation decreased the presence of olefins and increased significantly the presence of type 3 and 4 hydrogens correlated with esters that affect the acidity of the upgraded bio-oil.
The 1H and 13C NMR spectra for LBO1 are shown in
Figure 3. A simple analysis of the three distinct chemical classes (aliphatic, olefins and aromatics) shows that the
light fractions have less aliphatic hydrogens than the heavy fractions. The LBO1 data and spectrum clearly revealed the effect of esterification, observed in the shift at 3.0-5.0 ppm, and this influence was not observed for the heavy fractions of the bio-oil. This indicates that the major acid contribution in these bio-oils originates from small carboxylic acids, as verified in the analysis of the aqueous phase separated from the light fractions.
The significant changes observed in the 13C NMR
spectra (Figure 3) were the disappearance of a common signal at 180 ppm (characteristic of the carbonyl carbon of carboxylic acids) and the appearance of the signals at 51 and 174 ppm, attributed to the methoxyl carbon and C=O of esters, respectively, as a consequence of the esterification during the reactive distillation. The other signals confirm the presence of olefins (ca.114 and 139 ppm), aromatics (125-130 ppm) and methylene/methyl carbons (10-40 ppm) as previously reported.26
Conclusions
Figure 3. 1H and 13C NMR spectra for LBO1.
Table 7.1H NMR of LBO and HBO
Hydrogen type 1H Chemical
shift / ppm
mol% / % of total hydrogen
LBO11 LBO1 HBO11 HBO1
1) Aromatics 7.0-9.0 3.77 4.45 3.11 3.14
2) Olefins (–HC=CH–) 5.0-6.5 8.23 5.22 2.43 2.06
3) CH3, CH2 and CH, adjacent to –OH
3) CH3, CH2 and CH, adjacent to –OC(=O)R 3.0-5.0 − 4.40 − −
4) CH2, adjacent to –C=C 4) CH3, adjacent to –Ph
4) CH3, CH2 and CH, bound to –(C=O)OR; –(C=O)OH; –(C=O)H
2.0-2.5 11.11 18.08 14.72 15.12
5) CH, adjacent to –C–C=C 5) CH, adjacent to –C–CH2 5) CH3, adjacent to –C=C
1.5-2.0 12.87 10.13 10.22 8.97
6) CH2 and CH, adjacent to –CH2R 6) CH2, adjacent to –C–CH2 6) CH2, adjacent to –C–C=C
1.0-1.5 47.33 43.20 57.18 58.38
7) CH3, adjacent to –CH2R 7) CH3, adjacent to –C–CH2 7) CH3, adjacent to –CC=C
0.5-1.0 16.67 14.51 12.33 12.32
through reactive distillation. A crude bio-oil, which had been previously obtained and characterized, produced two kinds of upgraded biofuels, light and heavy bio-oils, with boiling point ranges similar to those of gasoline and diesel produced from petroleum, respectively. The main objective was to decrease the acidity of these biofuel fractions. The best results were achieved with the methanol/sulfuric acid system, which decreased the acidity by 94.3% and 42.5% for the light and heavy bio-oil fractions, respectively. The other characteristics (iodine value, specific gravity and sulfur content) of the obtained fractions were only slightly modified by the reactive process. The investigation of the chemical composition showed the influence of small carboxylic acids, like acetic acid, on the acidity of the light bio-oil and tetradecanoic and hexadecanoic acids on that of the heavy bio-oil. These results highlight the need for a pre-reflux to be carried out before the fractional distillation and the recovery of an intermediary fraction between the light and heavy bio-oil to eliminate the C14+ contamination of the light fraction.
These results also highlight the main problem of the second generation biofuels, the acidity, and reveal a simple condition which can enable their use in other combustion applications. The authors propose that this upgrade could be performed in a system coupled to the pyrolysis reactor.
Acknowledgements
The authors are grateful to the Analytical Instrumentation Laboratory of NIQFAR - UNIVALI for the NMR analysis, to the Brazilian governmental institutions, the Brazilian National Agency of Petroleum, Natural Gas and Biofuels (ANP) and the Financing of Studies and Projects (FINEP) for financial support and we sincerely thank the two anonymous reviewers.
References
1. Fiorese, G.; Catenacci, M.; Verdolini, E.; Bosetti, V.; Energy Policy2013, 56, 293.
2. Nigam, P. S.; Singh, A.; Prog. Energy Combust. Sci.2011, 37, 52.
3. Food and Agriculture Organization (FAO); The State of World Fisheries and Aquaculture, Rome, 2012.
4. Jayasinghe, P.; Hawboldt, K.; Renewable Sustainable Energy Rev.2012, 16, 798.
5. Maher, K. D.; Bressler, D. C.; Bioresour. Technol.2007, 98, 2351.
6. Zhang, Q.; Chang, J.; Wang, T.; Ying, X.; Energy Convers. Manage.2007, 48, 87.
7. ASTM D7544-09, Standard Specification for Pyrolysis Liquid Biofuel, ASTM International, West Conshohocken, PA, 2009.
8. Xu, J.; Jiang, J.; Sun, Y.; Lu, Y.; Biomass Bioenergy 2008, 32, 1056.
9. ASTM D7566-14a, Standard Specification for Aviation Turbine Fuel Containing Synthesized Hydrocarbons, ASTM International, West Conshohocken, PA, 2014.
10. Resolução ANP No. 20 de 24/06/2013. Standard Specification for Aviation Turbine Fuel Containing Synthesized Hydrocarbons, DOU 25.6.2013; Retificado 17.7.2013, 2013.
11. Mrad, N.; Varuvel, E. G.; Tazerout, M.; Aloui, F.; Energy2012,
44, 955.
12. Song, M.; Zhong, Z.; Dai, J.; J. Anal. Appl. Pyrol.2010, 89, 166.
13. Xu, J.; Jiang, J.; Lu, Y.; Chen, J.; Bioresour. Technol. 2009, 199, 4867.
14. Xu, J.; Jiang, J.; Sun, Y.; Chen, J.; Bioresour. Technol.2010,
101, 9803.
15. de la Puente, G.; Gil, A.; Pis, J. J.; Grange, P.; Langmuir1999,
15, 5800.
16. Doshi, V. A.; Vuthaluru, H. B.; Bastow, T.; Fuel Process. Technol.2005, 86, 885.
17. Wang, J.; Chang, J.; Fan, J.; Energy Fuels2010, 24, 3251. 18. Xu, Y.; Chang, J.; Zhang, Q.; Wang, T. J.; Wang, C. G.;
Petrochemical Technology2006, 35, 615.
19. Miao, S.; Shanks, B. H.; Appl. Catal. A2009, 359, 113. 20. Hu, X.; Gunawan, R.; Mourant, D.; Lievens, C.; Li, X.;
Zhang, S.; Chaiwat, W.; Li, C.; Fuel2012, 97, 512.
21. Guo, Z.; Wang, S.; Zhu, Y.; Luo, Z.; Cen, K.; J. Fuel Chem. Technol.2009, 37, 49.
22. Li, L.; Coppola, E.; Rine, J.; Miller, J. L.; Walker, D.; Energy Fuels2010, 24, 1305.
23. Mahfud, F. H.; Melián-Cabrera, I.; Manurung, R.; Heeres, H. J.;
Process Saf. Environ. Prot.2007, 85, 466.
24. Zhang, L.; Liu, R.; Yin, R.; Mei, Y.; Renewable Sustainable Energy Rev.2013, 24, 66.
25. Doherty, M. F.; Malone, M. F.; Conceptual Design of Distillation Systems. McGraw-Hill: New York, 2001. 26. Wisniewski Jr., A.; Wiggers, V. R.; Simionatto, E. L.; Meier,
H. F.; Barros, A. A. C.; Madureira, L. A. S.; Fuel2010, 89, 563. 27. Wiggers, V. R.; Wisniewski Jr., A.; Madureira, L. A. S.; Barros,
A. A. C.; Meier, H. F.; Fuel2009, 88, 2135.
28. Durand, J. P.; Boscher, Y.; Petroff, N.; Berthelin, M.;
J. Chromatogr.1987, 395, 229.
29. ASTM D6729-01, Standard Test Method for Determination of Individual Components in Spark Ignition Engine Fuels by 100 Meter Capillary High Resolution Gas Chromatography, ASTM International, West Conshohocken, PA, 2001.
30. Rothamer, D. A.; Jennings, J. H.; Fuel2012, 98, 203. 31. Berrios, M.; Skelton, R. L.; Chem. Eng. J.2008, 144, 459.