Article
Printed in Brazil - ©2013 Sociedade Brasileira de Química0103 - 5053 $6.00+0.00
A
*e-mail: [email protected]
Tryptophan Determination at Carbon Fiber Ultramicroelectrodes by
Fast-Scan Cyclic Voltammetry
Antônio R. Fiorucci,a Priscila Cervini,*,b Orlando Fatibello Filhoc and Éder T. G. Cavalheirob
aDepartamento de Engenharia Ambiental, Universidade Estadual do Mato Grosso do Sul,
Cidade Universitária de Dourados, CP 351, 79804-970 Dourados-MS, Brazil
bInstituto de Química de São Carlos, Universidade de São Paulo, 13560-970 São Carlos-SP, Brazil
cDepartamento de Química de São Carlos, Universidade Federal de São Carlos,
13565-905 São Carlos-SP, Brazil
A determinação de triptofano usando voltametria de varredura rápida com um ultramicroeletrodo de fibra de carbono (CF-UME) é descrita. O eletrodo CF-UME foi submetido a um pré-tratamento eletroquímico. Parâmetros tais como número de aquisição de ciclos, velocidade de varredura, intervalo de potencial e pré-tratamento eletroquímico da superfície foram otimizados. Sob condições ideais, três curvas analíticas foram obtidas para o triptofano (entre 30 e 300 µmol L-1) usando três diferentes CF-UME pré-tratados através de um procedimento de tratamento eletroquímico otimizado. Observou-se uma dependência na sensibilidade e concentração do triptofano com o raio do eletrodo, com limites de detecção entre 16,7 e 22,7 µmol L-1. O método foi aplicado na determinação de triptofano em amostras comerciais com erros entre −0,99 e +13,2% em relação a um método comparativo.
Tryptophan determination using a fast-scan voltammetric method at carbon fiber ultramicroelectrodes (CF-UME) is described. CF-UME electrode was submitted to electrochemical pretreatment. Parameters such as number of acquisition cycles, scan rate, potential interval and electrochemical surface pretreatment were optimized. Under optimized conditions, three analytical curves were obtained for tryptophan (between 30 and 300 µmol L-1) using three different CF-UMEs pretreated by means of an optimized electrochemical treatment procedure. It was observed a dependence on the sensitivity and tryptophan concentration linear range with the radius of the electrode, with limits of detection between 16.7 and 22.7 µmol L-1. The method was applied in the determination of tryptophan in commercial samples, with errors between −0.99 and +13.2% in relation to a comparative method.
Keywords: tryptophan, carbon fiber ultramicroelectrode, fast-scan voltammetry
Introduction
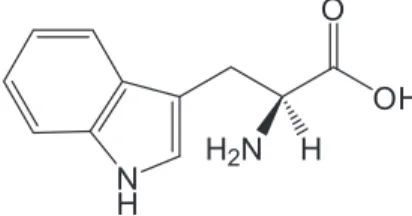
Tryptophan (L-2-amino-3-(indol-3-yl)propionic acid,
Trp, Figure 1) is a vital constituent of proteins and it is an essential amino acid for humans, helping in the normal growth of infants establishing and maintaining a positive nitrogen balance in adults. Trp cannot be synthesized by the mammal body, being frequently added to dietary and feed products as a fortifier and to pharmaceutical formulations to supplement the typical diet, sometimes deficient in vegetables. The common side effects of Trp
high dosages are drowsiness, nausea, dizziness and loss
of appetite.1,2
Trp is considered exceptional in its diversity of biological functions. It is a precursor of hormones, neurotransmitters,
in particular serotonin, and other relevant biomolecules, as melatonin and niacin. It is essential for people with sleep deprivation, anxiety and mood enhancement due to its ability to increase brain levels of serotonin and melatonin. It has been implicated as a possible cause of schizophrenia
in people who cannot properly metabolize Trp.3
Therefore, several methods have been established for Trp determination in a variety of sample matrices, mainly based on high performance liquid chromatography (HPLC),
as the most recent ones described in the references,4-9 and
spectrophotometric methods.10-13
Electroanalytical methods have also been used for the Trp determination due to their simplicity, sensitivity, low cost and low waste generation. Many strategies for the modification of graphite are presented in Table 1, the
glassy carbon and carbon paste electrodes regarding the Trp determination with a large range of limits of detection (LOD) are pointed. Although many low limits are observed, sometimes, this requires modifications involving toxic
substances that can restrict the use of a device in an in vivo
and/or single cell procedures.
Unmodified carbon electrodes have also been used
for the Trp determination. Wang et al.38 determined
Trp in synthetic serum samples, using an adsorptive stripping voltammetric method at an electrochemically pre-treated unmodified carbon paste electrode.
Fiorucci and Cavalheiro39 determined Trp in pharmaceutical
formulations using a bare carbon paste. Using a boron-doped diamond electrode in differential pulse voltammetry
(DPV), Zhao et al.40 determined simultaneously Trp and
Table 1. Some recent strategies for modification of graphite, glassy carbon and carbon paste electrodes regarding the Trp determination and limits of detection (LOD)
Electrode Modifier LOD / (µmol L-1) Reference
Ion selective − 10 14
Carbon ionic liquid gold nanoparticles 4.0 1
Pyrolitic graphite nano-mixture graphite/diamond 0.030 15
Graphite copper-cobalt hexacyanoferrate 6.0 16
Glassy carbon single-wall carbon nanotubes 0.01 17
poly(9-aminoacridine) funcionalized multi-walled carbon nanotubes (MWCN) 0.81 18
MWCN embedded cerium hexacyanoferrate 0.020 19
hemin 0.025 20
Nafion/TiO2-graphene 0.70 21
poly(4-aminobenzoic acid) polymer 0.20 22
gold nanoparticle 0.080 23
Carbon paste cobalt(II) coordination polymer 0.10 24
iron(III) doped zeolite 0.21 25
poly-glutamic acid modified carbon nanotube-doped 0.010 26
silicon dioxide nanoparticle 0.036 27
carbon nanotubes and ferrocene 0.21 28
carbon nanotube modified with p-aminophenol 5.7 29
overoxidized polypyrrole film 1.0 30
carbon nanotubes and ferrocenedicarboxylic acid 0.012 31
MWCN/cobalt salophen 0.17 32
1-[4-ferrocenyl ethynyl)phenyl]-1-ethanone 0.56 33
binuclear manganese complex 0.08 34
N-(3,4-dihydroxyphenethyl)-3,5-dinitrobenzamide-modified carbon nanotube 0.4 35
MWCN 0.065 36
carbon nanofiber 0.1 37
− 0.0098 38
− 1.7 39
Boron-doped diamonda − 10 40
tyrosine in real samples of amino acids. Typically,
LOD in the µmol L-1 magnitude is reached under these
conditions.
In this work, bare carbon fiber ultramicroelectrodes (CF-UME) were proposed to act as sensors in sensitive determinations of Tryptophan. The advantages of using such devices are, of course, their small sizes that can
suggest the in vivo use in the future.
Experimental
Reagents and solutions
All chemicals were of analytical reagent grade. Monobasic sodium phosphate monohydrate (Mallinckrodt), anhydrous dibasic sodium phosphate (Mallinckrodt) and Trp (Synth) were used as received.
Stock solutions of Trp were prepared daily, just before
use, in 70 mmol L-1 phosphate buffer (pH 7.4). All the
determinations were performed at room temperature and without deaeration.
The samples 1-4 were Buclamin (Teuto), Organoneuro Óptico (Gross), Panvit (Teuto) and Profol (Medley), respectively.
According to the Brazilian Pharmacopea,41 twenty
tablets of each solid pharmaceutical sample were ground and a selected amount, equivalent to one tablet (average mass of 20 tablets), was dissolved in phosphate buffer and filtered in order to eliminate insoluble excipients.
Electrodes
A saturated calomel electrode (SCE) was used as a reference electrode and a carbon fiber (7-8 µm diameter; CTA, Brazil) was used as working electrode.
The fabrication of the carbon fiber ultramicroelectrodes (CF-UME) was adapted from previously described
procedure.42,43 Briefly, the carbon fiber was first
connected to a copper wire with the help of a silver epoxy (EPO-TEK 410E, Epoxy Technology, USA) and left to cure for 24 h. After that, this set was sealed in a micropipette tip with a polyurethane resin (Poliquil, Brazil). The CF-UME electrode was left overnight at room temperature. After curing, the tip of the electrode was gently sanded off in a polishing wheel (Arotec, Brazil) using 600 grit silicon carbide paper (Arotec, Brasil), and finally, the surface was
gently polished in the polishing wheel with γ-alumina
suspension (0.1 µm particle size) (Arotec, Brazil). Before
use, the polished electrodes were sonicated44,45 in isopropyl
alcohol and in doubly distilled water for 5 min in each solvent.
Electrochemical pretreatment of CF-UME
As there is not a universal procedure for electrode pretreatment in order to generate a stable surface that allows a base for the background subtract procedure, in this work, three electrochemical pretreatments were tested and selected on the basis of the fast-scan voltammetry (FSV) procedure results.
(i) Procedure adapted from Brajter-Toth et al.:42 in
this case, CF-UME was submitted to 4000 consecutive
cycles of potential between −1.0 and +1.5 V (vs. SCE)
at 10 V s-1 in 70 mmol L-1 phosphate buffer solution
(pH 7.4).
(ii) Procedure adapted from Hernández et al.:46 in this
case, CF-UME was submitted to 120 consecutive cycles of
potential between 0.0 and 1.5 V (vs. SCE) at 200 mV s-1 in
70 mmol L-1 phosphate buffer solution (pH 7.4).
(iii) Procedure adapted from Crespi:47 in this case,
CF-UME was submitted to three different treatments using cyclic voltammetry (560 cycles between 0 and 3 V at
420 V s-1; 700 cycles between 0 and 2.5 V at 350 V s-1 and
700 cycles between 0 and 1.5 V at 210 V s-1), followed
by the application of a +1.5 V potential for 5 s and
−0.9 V for 5 s, in 100 mmol L-1 phosphate buffer solution
(pH 7.4).
Instrumental
The FSV experiments were performed using an AUTOLAB potentiostat/galvanostat PGSTAT30 (Eco Chemie, The Netherlands) equipped with a Scan-Gen and an ADC-750 modules for high scan rate and slow current acquisition, respectively, coupled to a personal computer and controlled with a GPES 4.9 software (Eco Chemie). A two electrode configuration cell was used inside a homemade Faraday cage during the FSV measurements in order to minimize the environmental noise.
For the tryptophan determinations, a pre-defined number of scans was recorded under a set of optimized experimental
conditions such as scan rate (69.60-117.7 V s-1), potential
window (−1.0 to 1.5 V) and number of acquisition scans
(150-200). The measured currents were averaged and stored.
Before each measurement, the background currents were recorded in the supporting electrolyte without analyte, under exactly the same experimental conditions used in the analytical determinations of tryptophan. These currents were stored, averaged and used later for digital background
subtraction48,49 from the tryptophan voltammograms with
Comparative spectrophotometric method
A spectrophotometric procedure was performed
according to Verma et al.,50 which is based on a specific
reaction for compounds that present indolic groups in their structures. The procedure involves a specific reaction of
HNO2 with indols whose product is monitored at 400 nm.
Results and Discussion
According to works in the literature,51,52 Trp undergoes
an oxidative process involving one step and a two electron reaction, resulting in a methylene-imine intermediate. These intermediates can react with water generating other electroactive species that can present oxidation/ reduction peaks in the successive voltammmetric cycling in fast-scan.
Evaluation of the pretreatment procedure performance using FSV
The electrochemical pretreatment of the CF-UME surface was necessary in order to reach a stable and reproducible surface. This is the basis of the background
subtraction procedure.48,49
According to McCreery and Cline,53 the electrochemical
pretreatments are the easiest ones to be performed in the CF-UME surface. However, although there are several different kinds of proposed activation/stabilization procedures in the literature, there is not hitherto to general procedure that could be used for any analyte/medium and a specific treatment should be optimized in each case.
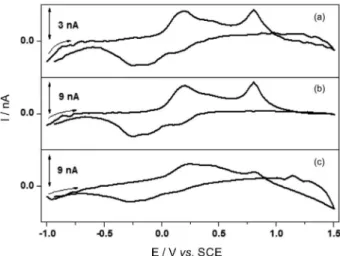
For instance, three pretreatments were chosen to be evaluated as the best for this specific case. Better peak definitions related to the irreversible oxidation of Trp at
0.804 V (vs. SCE) were found using the pretreatment
adapted from the Hernández et al.46 procedure, as presented
in Figure 2.
In order to perform the background subtraction, it is imperative that a stable and reproducible response be reached. From curves in Figures 2a and 2c, it is possible
to conclude that the Brajter-Toth et al.42 and Crespi47
procedures resulted in funny shaped voltammograms after the subtraction, suggesting that they resulted in non-stable
responses. However, the Hernández et al.46 procedure
(Figure 2b) was well succeeded in meeting this goal, being thus chosen for future use.
In addition, the Hernández et al.46 procedure gave
higher peak currents when compared with those from the
Brajter-Toth et al.42 treatment, although the shapes of the
voltammograms are quite similar. Meanwhile, the Crespi47
procedure led to a relatively high current with low definition of the voltammogram.
Evaluation of the best potential interval for the electrochemical pretreatment and measurements
Thus, using the Hernández et al.46 procedure, different
potential intervals were evaluated in the range of −1.0 V
to +1.1, +1.2, +1.3, +1.4 or +1.5 V (vs. SCE).
Better definition of baseline and higher peak currents
were found within the −1.0 to +1.5 V range, which was
chosen for further studies, as shown in Figure 3.
Figure 2. Cyclic voltammograms for the 50.2 µmol L-1 Trp solution
using CF-UME pre-treated by the procedure adapted from: (a) Brajter-Toth et al.,42(b) Hernández et al.46 and (c) Crespi.47 Conditions:
cyclic voltammetry staircase, ν = 69.6 V s-1, 200 consecutive cycles to calculate the signal average, step of potential of 33.4 mV in phosphate buffer pH 7.4.
Figure 3. Effect of the potential interval in the cyclic voltammograms
for the 50.2 µmol L-1 Trp solutions using CF-UME pre-treated by the
procedure adapted from Hernández et al.46 Similar conditions as described
The influence of inversion potentials towards negative values was not investigated because the electrode treatment procedure is well established. As the positive potentials induce the generation of functional groups, and consequently changes the electrode surface, only the positive branch was considered in such case.
Number of acquisition cycles
Although in conventional scan rates only one cycle can be enough to define the voltammogram, in fast-scan voltammetry, it is necessary to acquire a certain number of cycles and subtract the background due to the huge increase in the capacitive current that, along with noise increase, makes the measurements of Faraday currents of the redox
process of interest more difficult.44,54
Thus, the number of acquisition cycles is another important feature in the background subtraction procedure since few cycles result in highly noisy voltammograms while a larger number of cycles results in a smaller analytical frequency.
Figure 4 presents the effect of the number of cycles on
the peak signal for Trp determination (50 µmol L-1) at a
CF-UME pretreated by the Hernández et al.46 procedure at
70 V s-1, in the −1.0 to +1.5 V (vs. SCE) potential interval,
in 70 mmol L-1 phosphate buffer solution (pH 7.4).
Due to limitations of the equipment in relation to the pre-established experimental conditions, the maximum limit was 200 cycles and the minimum was 150 cycles.
With decreasing of the number of cycles from 200 to 150, there is a discernible increase in the analytical signal of the irreversible peak currents at 0.8 V. However, with less cycles, it was noticed an increase in the noise. Thus, further studies were performed using the average of 200 cycles and step potential of 33.41 mV.
Scan rate optimization
The investigated range of scans is rather narrow due to instrumental limitations in data acquisition, since it is necessary to work in relatively wide potential interval, using high scan rates and density of points for a proper resolution. This set of conditions limits the equipment capacity in acquiring data in a wider range of scans.
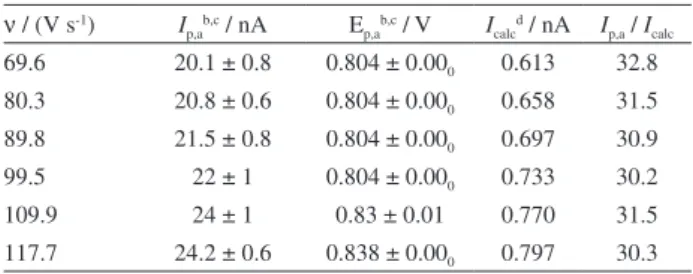
Regarding the scan rate, it is possible to observe that with higher scan rate, higher peak currents can be achieved, according to the data in Table 2. Scan rates between
69.60 and 117.7 V s-1 were evaluated due to both peak
definition and instrumental limitations.
The electrode radius after electrochemical treatment was calculated according to the equation under Table 2. Sometimes, the fiber is not so uniform in size. So, maybe, this is the explanation for the electrode radius three times higher than its nominal value, in which an unusual fiber size was used to manufacture the electrode.
Considering the sensitivity and speed of the analysis, the
use of 117.7 V s-1 scan rate would be more advantageous
in analytical frequency terms. However, Figure 5 suggests an increase in the noise with the scan rate.
Regarding the Trp oxidation peak at 0.8 V (vs. SCE) and
the noise between 1.0 and 1.25 V (vs. SCE), the
signal-to-noise ratio was measured as 11, 4.8 and 4.7, for curves in Figures 5a, 5b and 5c, respectively. This can reach a signal-to-noise of 1.8 if one considers the noise at
Table 2. Anodic currents for the irreversible oxidation process of 101 µmol L-1 Trp measured with CF-UME using FSVa in different scan
rates (ν)
ν / (V s-1) Ip,ab,c / nA Ep,ab,c / V Icalcd / nA Ip,a / Icalc
69.6 20.1 ± 0.8 0.804 ± 0.000 0.613 32.8
80.3 20.8 ± 0.6 0.804 ± 0.000 0.658 31.5
89.8 21.5 ± 0.8 0.804 ± 0.000 0.697 30.9
99.5 22 ± 1 0.804 ± 0.000 0.733 30.2
109.9 24 ± 1 0.83 ± 0.01 0.770 31.5 117.7 24.2 ± 0.6 0.838 ± 0.000 0.797 30.3 aAverage of 200 cycles using step potential of 33.4 mV; baverage and
standard deviation for 6 measurements; cradius = 10.4 ± 0.1 µm for
CF-UME after electrochemical pretreatment; dcurrent estimated by the
equation: Icalc,irrev = 2.99 × 10⁵n (αn)1/2 ACD1/2ν1/2; 55 adopting αn = 1.0;
n = 2; D = 1 × 10⁻⁵ cm2 s-122 and nominal radius (r = 3.5 µm) CF-UME.
Figure 4. Cyclic voltammograms for the 50.2 µmol L-1 Trp solution using
CF-UME pre-treated by the procedure adapted from Hernández et al.46
−0.75 V (vs. SCE) in curve c. Because of this, the 99.5 V s-1
scan rate was chosen, presenting similar sensitivity, however with lower level of noise in relation to the higher scan rates, without significant loss of peak current intensity.
Trp analytical curve using FSV and the optimized parameters
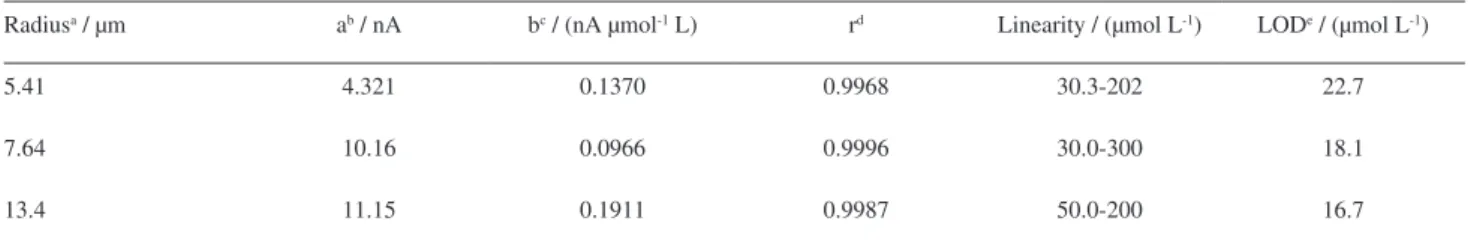
Once the experimental and instrumental parameters for data acquisition were established, three analytical curves were obtained for tryptophan between 30 and
300 µmol L-1, using three different pretreated CF-UME by
the Hernández et al.46 procedure. The results are presented in
Table 3.
The apparent radius of CF-UME was estimated by
cyclic voltammetry between +0.4 and −0.1 V (vs. SCE)
measuring the limiting diffusion current of the stationary
state voltammograms of a 5.0 mmol L-1 K
3[Fe(CN)]6
solution in 0.5 mol L-1 KCl, using equation 1:
I = 4nFD0rC0 (1)
in which I = current; n = number of electrons involved in the
reaction; F = Faraday’ constant; D0 = diffusion coefficient;
r = electrode radius (cm); C0 = bulk concentration (mol cm-3).
It was observed a change in the sensibility and linear range with the electrode radius. However, all the electrodes presented linear response in relation to the concentration in the studied interval.
The LOD values were calculated using the relation
LOD = 3sa/b, where sa is the standard deviation of the
linear coefficient and b is the slope of the analytical curve,
according to Miller and Miller.56
Although CF-UME does not present linear response
in concentrations lower than 30 µmol L-1, the electrodes
present the advantages of stability and linear response to higher concentrations of Trp. This is a useful advantage in analyzing samples containing high concentrations of Trp, as those in pharmaceutical formulations.
The experimental sensitivities (expressed by the b value in Table 3) of CF-UME of radius 5.41 and 13.4 µm were 18.9 and 26.9 times higher than the sensitivity calculated from the Randles-Sevcik equation for an irreversible
system.55,57,58 These results confirm that the electrochemical
pretreatment has a differentiated effect in terms of sensitivity that depends on the area of CF-UME. However, the slope does not change significantly.
The voltammograms for the Trp solutions in different concentrations and the analytical curve obtained with one of the electrodes are presented in Figure 6a. In Figure 6b, it is possible to observe that the intercept value in the current axis is significant in relation to the values of current determined for any concentration in the analytical curve.
This can be related to the fact that the anodic current
measured at +0.8 V (vs. SCE) had a contribution of the
anodic secondary processes related to the product(s) of the Trp electrochemical oxidation, which occurs in potentials less anodic than of the irreversible peak in +0.8 V. This
Figure 5. Cyclic voltammograms for the 101 µmol L-1 Trp solution
using different scan rates: (a) 99.5, (b) 109.9 and (c) 117.7 V s-1 using
pre-treated CF-UME by the procedure adapted from Hernández et al.46
(radius = 10.4 ± 0.1 µm); cyclic voltammetry staircase; ν = 99.5 V s-1; step potential of 33.41 mV; 200 consecutive cycles to calculate the signal average in phosphate buffer pH 7.4.
Table 3. Experimental parameters of the analytical curves obtained for Trp using CF-UME in FSV
Radiusa / µm ab / nA bc / (nA µmol-1 L) rd Linearity / (µmol L-1) LODe / (µmol L-1)
5.41 4.321 0.1370 0.9968 30.3-202 22.7
7.64 10.16 0.0966 0.9996 30.0-300 18.1
13.4 11.15 0.1911 0.9987 50.0-200 16.7
aRadius determined after pre-pretreatment; ba: intercept of the straight line in the ordinate axis obtained by linear regression; cb: angular coefficient of the
straight line obtained by linear regression; dr: linear coefficient of the obtained straight line by linear regression; LOD: limit of detection = 3S
y/x/b, where
signal generated by oxidation of Trp product(s) is probably the responsible for those high values of limits of detection (Table 3). The analytical curve was obtained from current measurements in relation to the zero value of current and, therefore, without any baseline correction.
Commercial sample analyses
To verify the performance of CF-UME, the determinations of Trp in commercial samples were performed using the proposed voltammetric method under the previously
optimized pretreatment adapted from Hernandez et al.47
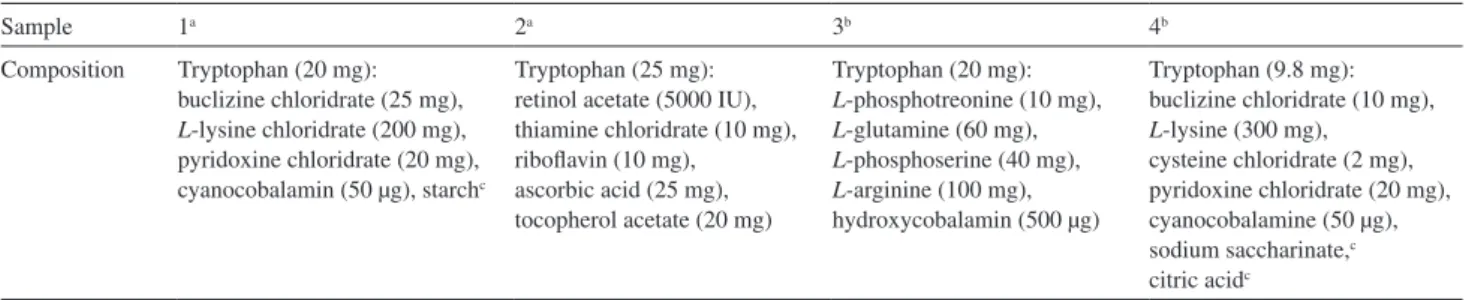
Table 4 presents the pharmaceutical sample contents. The obtained results using these conditions were compared with the labeled values and the values were determined by spectrophotometry, according to Table 5.
For sample 4, a discrepancy was observed between FSV and UV methods. This fact is related to the presence of a yellow coloring in this sample which is visually perceived, even after dilution of the sample for analyses by FSV.
The presence of substances as buclizine chloridrate,
L-lysine chloridrate and pyridoxine chloridrate seems not
to provoke interference in the Trp determination using the proposed method. This happens because the sample 1 also contains these substances and the result obtained using FSV method for sample 1 was in a good agreement with that obtained using the spectrophotometric method. Moreover, a positive error was verified for sample 4.
Cysteine (Cys) voltammograms taken at CF-UME and FSV, under the same employed conditions for Trp analysis, showed that Cys does not interfere in the Trp signal even
when both are mixed in 1:1 (mol mol-1).
Table 5. Results for determinations of Trp in pharmaceutical samples
Sample Tryptophan content Errord / %
Labeled UV FSV
1a 20 20.2 ± 0.6 20.0 ± 0.9 −0.99
2a 25 25.3 ± 0.4 24.6 ± 0.9 −2.77
3b 20 18.1 ± 0.3 17.9 ± 0.7 −1.10
4c 9.8 14.4 ± 0.5 16.7 ± 0.3 +13.2
aSolid sample: mg per tablet. bLiquid sample: mmol L-1. cSuspension:
mmol L-1. dError of the proposed method (FSV) relative to the comparative
method (UV).
Table 4. Components of the pharmaceutical samples analyzed in this work
Sample 1a 2a 3b 4b
Composition Tryptophan (20 mg): buclizine chloridrate (25 mg),
L-lysine chloridrate (200 mg),
pyridoxine chloridrate (20 mg), cyanocobalamin (50 µg), starchc
Tryptophan (25 mg): retinol acetate (5000 IU), thiamine chloridrate (10 mg), riboflavin (10 mg), ascorbic acid (25 mg), tocopherol acetate (20 mg)
Tryptophan (20 mg):
L-phosphotreonine (10 mg), L-glutamine (60 mg), L-phosphoserine (40 mg), L-arginine (100 mg),
hydroxycobalamin (500 µg)
Tryptophan (9.8 mg): buclizine chloridrate (10 mg),
L-lysine (300 mg),
cysteine chloridrate (2 mg), pyridoxine chloridrate (20 mg), cyanocobalamine (50 µg), sodium saccharinate,c
citric acidc
aIn one tablet. bIn a 10 mL sample. cQuantity not labeled.
Figure 6. (a) Cyclic voltammograms for the Trp solution in different concentrations using CF-UME pre-treated (r = 7.64 ± 0.01 µm) by procedure adapted
from Hernández et al.46in cyclic voltammetry staircase, ν = 99.5 V s-1; step potential of 33.41 mV; 200 consecutive cycles to calculate the signal average
in phosphate buffer pH 7.4. (b) Analytical curve for Trp using CF-UME pre-treated by the procedure adapted from Hernández et al.46(FSV curves were
The fact that the sample 4 contains a 0.13:1 mol ratio
(mol mol-1) between Cys and Trp confirms that the first is
not responsible by the highest error in the determination of Trp by the FSV method. The interference in sample 4 was thus attributed to the coloring agent.
Conclusions
The studies with CF-UME indicated that the electrodes are applicable in the determination of tryptophan only when the voltammetric measurements are carried out with high scan rates after previous electrochemical activation of these electrodes using adequate pretreatment.
The use of cyclic voltammetry in fast-scan mode (FSC) is essential for the establishment of a stable response for Trp. This is probably to minimize the effects of surface blockage that are caused by the electrochemical oxidation product of this analyte.
The application of FSV with CF-UME in the determination of Trp is also advantageous in terms of sensitivity as demonstrated by analysis of the results.
The presence of substances, that are usually found in Trp formulations, seems not to severely interfere in this procedure, except for the dye in sample 4.
Acknowledgements
The authors are indebted to the Brazilian agencies CNPq and FAPESP for research grant (2010/11080-7) and PROCONTES/USP Program.
References
1. Safavi, A.; Momeni, S.; Electroanalysis2010, 22, 2848.
2. Zhu, Y.; Yang, Y.; Zhou, Z.; Genrong, L.; Mei, J.; Chun, Z.; Shiqi, C.; Food Chem.2010, 118, 159.
3. Yujing, G.; Shaojun, G.; Youxing, F.; Shaojun, D.; Electrochim. Acta2010, 55, 3927.
4. Sa, M.; Yiang, L.; Tang, A. G.; Xiao, L. D.; Ren, Y. P.; Clin. Chim. Acta2012, 413, 973.
5. Lian, W.; Ma, D. J.; Xu, X.; Chen, Y.; Wu, Y. L.; J. Dig. Dis.
2012, 13, 100.
6. Pinhati, R. R.; Polonini, H. C.; Brandão, M. A. F.; Raposo, N. R. B.; Quim. Nova2012, 35, 623.
7. Kuminek, G.; Stulzer, H. K.; Tagliari, M. P.; Oliveira, P. R.; Bernardi, L. S.; Rauber, G. S.; Cardoso, S. G.; J. AOAC Int.
2011, 94, 1785.
8. Krcmova, L.; Solichova, D.; Melichar, B.; Kasparova, M.; Plisek, J.; Sobotka, L.; Solich, P.; Talanta2011, 85, 1466. 9. Zhen, Q.; Xu, B.; Ma, L.; Tian, G.; Tang, X.; Dinq, M.; Clin.
Biochem.2011, 44, 226.
10. Riahi, S.; Ganjali, M. R.; Pourbasheer, E.; Divsar, F.; Norouzi, P.; Chaloosi, M.; Curr. Pharm. Anal.2008, 4, 231.
11. Ren, J.; Zhao, M.; Wang, J.; Cui, C.; Yang, B.; Food Technol. Biotechnol.2007, 45, 360.
12. Yu, W.; Zhang, H.; Chen, G.; Tu, C.; Ouyang, P.; Microchim. Acta2004, 146, 285.
13. Evgen’ev, M. I.; Evgen’eva, I. I.; J. Anal. Chem.2000, 55, 741. 14. Moriuchi-Kawakami, T.; Tokunaga, Y.; Yamamoto, H.;
Shibutani, Y.; Talanta2012, 94, 99.
15. Shahrokhian, S.; Bayat, M.; Microchim. Acta2011, 174, 361.
16. Liu, Y.; Xu, L.; Sensors2007, 7, 2446.
17. Huang, W. S.; Mai, G.; Liu, Y. X.; Yang, C.; Qu, W. Y.;
J. Nanosci. Nanotechnol.2004, 4, 423.
18. Guney, S.; Yildiz, G.; Electrochim. Acta2011, 57, 290.
19. Fang, B.; Wei, Y.; Li, M.; Wang, G.; Zhang, W.; Talanta2007,
72, 1302.
20. Nan, C. G.; Feng, Z. Z.; Li, W. X.; Ping, D. J.; Qin, C. H.; Anal. Chim. Acta2002, 452, 245.
21. Fan, Y.; Liu, J. H.; Lu, H. T., Zhang, Q.; Microchim. Acta2011,
173, 241.
22. Huang, K. J.; Xu, C. X.; Xie, W. Z.; Wang, W.; Colloids Surf., B.
2009, 74, 167.
23. Li, C.; Ya, Y.; Zhan, G.; Colloids Surf., B.2010, 76, 340. 24. Li, W.; Li, C.; Kuang, Y.; Deng, P.; Zhang, S.; Xu, J.; Microchim.
Acta2012, 176, 455.
25. Babaei, A.; Zendehdel, M.; Khalilzadeh, B.; Taheri, A.; Colloids Surf., B.2008, 66, 226.
26. Liu, X.; Luo, L.; Ding, Y.; Ye, D.; Bioelectrochemistry2011,
82, 38.
27. Xu, M.; Ma, M.; Ma, Y.; Russ. J. Electrochem.2012, 48, 489.
28. Akhgar, M. R.; Beitollahi, H.; Salari, M.; Karimi-Maleh, H.; Zamani, H.; Anal. Methods2012, 4, 259.
29. Ensafi, A. A.; Dadkhah-Tehrani, S.; Karimi-Maleh, H. A.; Anal. Sci.2011, 27, 409.
30. Chen, Z. D.; Okamura, K.; Hanaki, M.; Nagaoka, T.; Anal. Sci.
2002, 18, 417.
31. Akhgar, M. R.; Salari, M.; Zamani, H.; J. Solid State Electrochem. 2011, 15, 845.
32. Shahrokhian, S.; Fotouhi, L.; Sens. Actuators, B.2007, 123, 942.
33. Raoof, J. B.; Ojani, R.; Karimi-Maleh, H.; Electroanalysis2008,
20, 1259.
34. Xu, J.; Yuan, Y.; Li, W.; Deng, P.; Deng, J.; Microchim. Acta
2011, 174, 239.
35. Ensafi, A. A.; Karimi-Maleh, H.; Mallakpour, S.; Electroanalysis
2012, 24, 666.
36. Baghbamidi, S. E.; Beitollahi, H.; Karimi-Maleh, H.; Soltani-Nejad, S.; Soltani-Nejad, V.; Roodsaz, S.; J. Anal. Methods Chem.2012, 5872.
37. Tang, X.; Liu, Y.; Hou, H.; You, T.; Talanta2010, 80,
38. Wang, H. S.; Cui, H.; Zhang, A. M.; Liu, R. M.; Anal. Commun.
1996, 33, 275.
39. Fiorucci, A. R.; Cavalheiro, E. T. G.; J. Pharm. Biomed. Anal.
2002, 28, 909.
40. Zhao, G. H.; Qi, Y.; Tian, Y.; Electroanalysis2006, 18, 830. 41. Farmacopéia Brasileira, 4ª ed.; Atheneu Editora São Paulo
Ltda: São Paulo, Brasil, 1988.
42. Brajter-Toth, A.; El-Nour, K. A.; Cavalheiro, E. T. G.; Bravo, R.;
Anal. Chem.2000, 72, 1576.
43. Nunes, R. S.; Cavalheiro, E. T. G.; J. Braz. Chem. Soc.2012,
23, 670.
44. Hsueh, C. C.; Bravo, R.; Jaramillo, A.; Brajter-Toth, A.; Anal. Chim. Acta1997, 349, 67.
45. Abou El-Nour, K.; Brajter-Toth, A.; Electroanalysis2000, 12,
805.
46. Hernández, P.; Sánchez, I.; Patón, F.; Hernández, L.; Talanta
1998, 46, 985.
47. Crespi, F.; Anal. Biochem.1991, 194, 69.
48. Wightman, R. M.; May, L. J.; Michael, A. C.; Anal. Chem.1988,
60, 769A.
49. Wiedemann, D. J.; Kawagoe, K. T.; Kennedy, R. Y.; Ciolkowski, E. L.; Wightman, R. M.; Anal. Chem.1991, 63, 2965.
50. Verma, K. K.; Jain, A.; Gasparic, J.; Talanta1988, 35, 35. 51. Nguyen, N. T.; Wrona, M. Z.; Dryhurst, G.; J. Electroanal.
Chem.1986, 199, 101.
52. Nguyen, N. T.; Wrona, M. Z.; Dryhurst, G.; Bioelectrochem. Bioenerg.1986, 15, 257.
53. McCreery, R. L.; Cline, K. K. In Laboratory Techniques in Electroanalytical Chemistry; Kissinger, P. T.; Heineman, W. R.,
eds.; Marcel Dekker: New York, USA, 1996.
54. St. John, P. A.; McCarthy, W. J.; Winefordner, J. D.; Anal. Chem.
1967, 39, 1495.
55. Bard, A. J.; Faulkner, L. R.; Electrochemical Methods, Fundamentals and Applications, 1st ed.; Wiley: New York, USA, 1980.
56. Miller, J. C.; Miller, J. N.; Statistics for Analytical Chemistry, 2nd ed.; Ellis Horwood: Chichester, UK, 1988.
57. Brett, A. M. O.; Brett, C. M. A.; Eletroquímica. Princípios, Métodos e Aplicações, 1st ed.; Almedina: Coimbra, Portugal, 1996.
58. Adams, R. N.; Electrochemistry at Solid Electrodes, 1st ed.; Marcel Dekker: New York, USA, 1969.
Submitted: January 8, 2013
Published online: June 25, 2013