Article
J. Braz. Chem. Soc., Vol. 24, No. 8, 1339-1344, 2013. Printed in Brazil - ©2013 Sociedade Brasileira de Química 0103 - 5053 $6.00+0.00
A
*e-mail: [email protected]
Electrochemical Hydrogen-Storage Properties of
La
0.78Mg
0.22Ni
2.67Mn
0.11Al
0.11Co
0.52-M1Ni
3.5Co
0.6Mn
0.4Al
0.5Composites
Hongxia Huang,*,a,b Guohui Lia and Shuxin Zhuangc
aGuangxi Scientific Experiment Center of Mining, Metallurgy and Environment, College of Chemistry and
Bioengineering, Guilin University of Technology, Guilin 541004, People’s Republic of China
bKey Lab of New Processing Technology for Nonferrous Metals & Materials Ministry of Education,
Guilin University of Technology, Guilin 541004, People’s Republic of China
cSchool of Material Science and engineering, Xiamen University of Technology,
Xiamen 361024, People’s Republic of China
Com o objetivo de aprimorar as propriedades eletroquímicas da liga do tipo AB3 La0,78Mg0,22Ni2,67Mn0,11Al0,11Co0,52 como eletrodo negativo de bateria Ni–MH, seus compósitos relacionados La0,78Mg0,22Ni2,67Mn0,11Al0,11Co0,52–x wt.% M1Ni3,5Co0,6Mn0,4Al0,5 (x = 0, 10, 20, 30) foram preparados. A análise por difratometria de raios X (XRD) revelou que os compósitos consistem principalmente das fases LaNi5 e La2Ni7. Apesar da pequena diminuição na capacidade de descarga máxima, o rendimento do ciclo foi significativamente melhorado. Experimentos de polarização linear (LP), polarização anódica (AP) e descarga de potencial degrau revelaram um aumento inicial da cinética eletroquímica que na sequência diminui com o aumento de x.
For improving the electrochemical properties of nonstoichiometric AB3-type La0.78Mg0.22Ni2.67Mn0.11Al0.11Co0.52 alloy as negative electrode of Ni–MH battery, its related composites La0.78Mg0.22Ni2.67Mn0.11Al0.11Co0.52–x wt.% M1Ni3.5Co0.6Mn0.4Al0.5 (x = 0, 10, 20, 30) were prepared. Analysis by X-ray diffractometry (XRD) revealed that the composites consist mainly of LaNi5 and La2Ni7 phases. Despite the small decrease in the maximum discharge capacity, the cycle performance was significantly enhanced. Linear polarization (LP), anodic polarization (AP) and potential step discharge experiments revealed that the electrochemical kinetics increases first and then decreases with increasing x.
Keywords: AB3-type alloy, composite electrode material, cycle stability
Introduction
The discharge capacity of currently commercial AB5-type hydrogen-storage alloys has reached 320-340 mAh g-1
at room temperature. It seems to be difficult to further improve the capacity of the AB5-type alloys since the
theoretical capacity of LaNi5 is 372 mAh g-1. Therefore, it is
extremely important to develop new alloy types with higher capacity and longer life cycle for exacting the competition ability of Ni–MH batteries.
Recently, the new series of AB3-type R–Mg–Ni-based (where R is a rare earth or Y, Ca) hydrogen-storage alloys were extensively investigated as promising candidates for negative electrode material of Ni–MH rechargeable
batteries due to their relatively high hydrogen-storage capacity (360-410 mAh g-1) and low production costs.1
Dong et al.2 reported that the La
0.67Mg0.33Ni2.75Co0.25 alloy
electrode exhibited a discharge capacity of 388 mAh g-1,
which was much higher than AB5-type rare earth-based electrode alloys. However, these R–Mg–Ni-based alloys cannot meet the need of practical applications due to serious degradation of capacity during cyclic process.
Ball milling method is effective in the surface modification and improvement of the electrochemical properties of the hydrogen-storage alloys. For example, it was found that the maximum discharge capacity of Ml0.90Mg0.10Ni3.08Mn0.13Co0.63Al0.14–4 wt.% AB5 electrode reached 406 mAh g-1 and that the LaNi
5 alloy could increase
the discharge capacity of Ti–V-based BCC phase alloy.3,4
electrode was improved with addition of the TiNi0.56Co0.44
alloy.6
Herein, in order to obtain R–Mg–Ni-based hydrogen-storage alloys with excellent overall electrochemical properties, the La0.78Mg0.22Ni2.67Mn0.11Al0.11Co0.52–x wt.%
M1Ni3.5Co0.6Mn0.4Al0.5 (where M1 denotes mischmetal,
x = 0, 10, 20, 30) composites were prepared, which
resulted in the appreciable elevation of the cycle stability. The microstructure and electrochemical properties of composites were also studied.
Experimental
Preparation and structural characterization
The La0.78Mg0.22Ni2.67Mn0.11Al0.11Co0.52 alloy (represented
as A hereafter) and M1Ni3.5Co0.6Mn0.4Al0.5 alloy (represented
as B hereafter, M1 consists of 37.7% La, 38.9% Ce, 6.3% Pr and 17.1% Nd) were prepared by induction melting under argon atmosphere and remelted four times for homogeneity. The purity of all the constituent metal elements was over 99.0%. The ingots were mechanically crushed and ground into 300 mesh powders for the preparation of the composite alloys. The A–x wt.% B (x = 0, 10, 20,
30) alloy and composites were prepared by ball milling.
x wt.% (x = 0, 10, 20, 30) M1Ni3.5Co0.6Mn0.4Al0.5 alloy was
mixed homogenously into La0.78Mg0.22Ni2.67Mn0.11Al0.11Co0.52
alloy, and ground by QM-ISP planetary ball miller under argon atmosphere for 1 h.
The structural data of the alloys was collected by powder X-ray diffraction (Rigaku D/max-2550, Cu Kα radiation, λ at 1.54178 Å).
Electrochemical measurements
The testing electrodes were prepared by cold pressing the alloy powder with carbonyl nickel powder in a weight ratio of 1:2 into a pellet of 15 mm in diameter under a pressure of 10 MPa and then pressed between two pieces of foam nickel. The charge/discharge studies were carried out by a Land 5.3 B Battery Test Instrument in a standard open tri-electrode electrolysis cell consisting of a working electrode (the MH pellet electrode for studying), a sintered Ni(OH)2/NiOOH counter electrode, and a
Hg/HgO reference electrode immersed in the 6 mol dm-3
KOH electrolyte. The electrodes were charged for 5 h at a current density of 100 mA g-1, rested for 5 min and then
discharged to the cut-off potential of –0.6 V vs. Hg/HgO
reference electrode at a current density of 50 mA g-1.
PARSTAT 2273 electrochemical system was used for the kinetic tests. The anodic polarization was plotted at
a rate of 0.5 mV s-1 from 0 to 600 mV (vs. open circuit
potential) at 50% depth of discharge (DOD). The linear polarization testing was performed at a rate of 0.1 mV s-1
from –5 to 5 mV (vs. open circuit potential) at 50% DOD.
Electrochemical impedance spectroscopy measurement was carried out in the frequency range of 1 × 10³ to
1 × 10⁻⁴ Hz with ac amplitude of 5 mV at 50% DOD.
The potential step discharge experiments were performed at 100% charge state, a +500 mV potential step was applied and the discharge time was 3600 s.
Results and Discussions
Phase structure
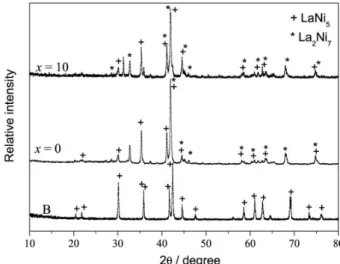
Figure 1 exhibits the XRD patterns for B, x = 0 and x = 10 alloys. It shows that the M1Ni3.5Co0.6Mn0.4Al0.5 alloy
presents the single CaCu5-type hexagonal LaNi5 phase. The
x = 0 and the x = 10 alloys consist of multiphase structures,
the main phases are LaNi5 and La2Ni7 phases, indicating
that the crystal structure of the alloy is not affected by appropriate milling.
Discharge capacity and cycle stability
Figure 2 illustrates the discharge capacity vs. cycle
number for the A–x wt.% B (x = 0, 10, 20, 30) alloy
electrodes. For comparison, the same relationship for the M1Ni3.5Co0.6Mn0.4Al0.5 alloy (represented as B) is
also presented. The activation number (Na) and the
maximum discharge capacity (Cmax) are listed in Table 1.
The activation capability is closely related to the phase structure, surface characteristics, grain sizeand interstitial dimensions of the alloy.It is obvious that all the composite electrodes have excellent activation property and can be
fully activated within three cycles, being mainly ascribed to their multiphase structures. The phase boundary cannot only act as a buffer for releasing strain energy but also provides good tunnels for the diffusion of hydrogen atoms, which was confirmed by literature.7
The oxidation and corrosion of the alloy composition in corrosive electrolyte is an extremely important factor that leads to the efficacy loss of the Ni–MH battery. In order to investigate the cycling durability of the alloy electrodes, the capacity retention (Sn) is defined and calculated by the
following equation:
Sn (%) = Cnth/Cmax 100 (1)
where Sn is the capacity retention at n cycles, Cnth is the
discharge capacity at n cycles and Cmax is the maximum
discharge capacity. The capacity retention rate at the 50th
cycle (S50) of the alloy electrodes is shown in Table 1. Cmax of the M1Ni3.5Co0.6Mn0.4Al0.5 alloy electrode is
315 mAh g-1, and the capacity retention (S
50) is 88.6%. With
a maximum discharge capacity of 371 mAh g-1 for x = 0
electrode, its cycle stability is rather poor. After 50 cycles,
S50 is only 55.3%. As for the composite electrodes, Cmax
decreases to 369 mAh g-1 (x = 10), 358 mAh g-1 (x = 20) and
356 mAh g-1 (x = 30), respectively. The hydrogen-storage
capacity of the La2Ni7 phase is higher than that of LaNi5
phase,8 so the drop of the maximum discharge capacity can
be attributed to the abundance decrease of the La2Ni7 phase
with the addition of M1Ni3.5Co0.6Mn0.4Al0.5 alloy.
The cycle stability of the composite electrodes is significantly elevated, especially for x = 20 electrode,
which exhibits the capacity retention rate (S50) of 76.5%.
The improvement of the cycle performance is related to the change of the phase abundances of the alloys. The abundance of LaNi5 phase increases with the addition of
M1Ni3.5Co0.6Mn0.4Al0.5 alloy, which is beneficial to the
improvement of the cycle stability owing to the high Ni content of LaNi5 phase. Ni has excellent electrocatalytic
activity and good corrosion resistance in an alkaline solution.9
Anodic polarization (AP)
Figure 3shows the anodic polarization curves for the A–x wt.% B (x = 0, 10, 20, 30) alloy electrodes at 50%
DOD. The anodic current density increases firstly with the overpotential increase, and then reaches a limiting value defined as the limiting current density (IL), which is
mainly controlled by the hydrogen diffusion in the bulk of alloy. The hydrogen diffusion is higher as the limiting current density is larger. The values of IL obtained from
Figure 3 are also summarized in Table 1. IL increases from
1204.0 mA g-1 (x = 0) to 1639.6 mA g-1 (x = 10), and then
decreases to 1358.4 mA g-1 (x = 30). Liu et al.10 reported
that the kinetics may be affected by the relative content of the two phases in the alloys. When the relative content of the LaNi5 and La2Ni7 phases come to a proper value, the
electrochemical catalytic-activity of the alloy electrodes is enhanced due to the synergy of the two phases.11 Therefore,
IL increases and then decreases with the x increase.
Linear polarization (LP)
Figure 4 illustrates the linear polarization curves for the A–x wt.% B (x = 0, 10, 20, 30)alloy electrodes. When
the overpotential is changed within a small range, there is
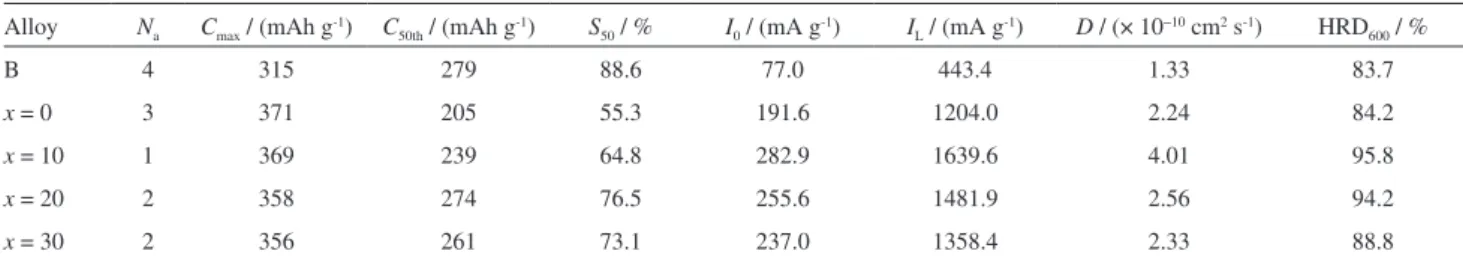
Table 1. The electrochemical properties of the A–x wt% B (x = 0, 10, 20, 30) alloy electrodes.
Alloy Na Cmax / (mAh g-1) C50th / (mAh g-1) S50 / % I0 / (mA g-1) IL / (mA g-1) D / (× 10−10 cm2 s-1) HRD600 / %
B 4 315 279 88.6 77.0 443.4 1.33 83.7
x = 0 3 371 205 55.3 191.6 1204.0 2.24 84.2
x = 10 1 369 239 64.8 282.9 1639.6 4.01 95.8
x = 20 2 358 274 76.5 255.6 1481.9 2.56 94.2
x = 30 2 356 261 73.1 237.0 1358.4 2.33 88.8
a good linear dependence between the current density and the overpotential. The exchange current density (I0) is an
important kinetic parameter, which is used to evaluate the charge-transfer reaction rate on the electrode surface and can be calculated by the following equation:12
(2)
where Id, R, T, F and η denote the applied current density, gas constant, absolute temperature, Faraday constant and overpotential, respectively. As listed in Table 1, I0 increases
after addition of M1Ni3.5Co0.6Mn0.4Al0.5 alloy, which is
related to the change in the abundance of LaNi5 phase.
The LaNi5 phase has higher electrocatalytic activity due
to its higher Ni content, which cannot only work as a hydrogen absorber, but also as a catalytic site during the charge/discharge process.13 The exchange current density of
the electrodes firstly increases from 191.6 mA g-1 (x = 0) to
282.9 mA g-1 (x = 10), and then decreases to 237.0 mA g-1
(x = 30) with the increase of x value. The variation of I0
is completely consistent with that of IL, which further
confirms that the alloy electrode exhibits a comparatively better kinetics when the La2Ni7 and LaNi5 phases exist in
a proper proportion.
Potentiostatic discharge
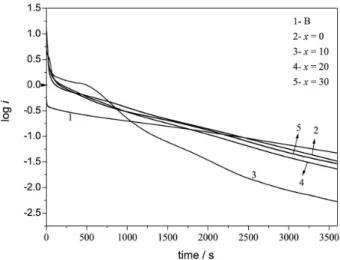
Figure 5 shows the curves of anodic current vs.
discharge time curves for the A–x wt.% B (x = 0, 10, 20,
30) alloy electrodes at full charge state. It can be seen that after application of the overpotential, the current-time responses in the semilogarithmic plot (log ivs.t) can be
divided into two domains. In the first region, the current density decreases rapidly due to the fast consumption of the hydrogen on the surface of the alloy particles, while the current density decreases slowly in a linear fashion in the second region. In the second region, the current is mainly controlled by the hydrogen diffusion velocity, and the hydrogen is supplied from the bulk alloy proportionally to the concentration gradient of hydrogen. According to a spherical diffusion model,14 the hydrogen diffusion
coefficient (D) can be obtained from the slope of the linear
section by the following equations:15
(3)
(4)
where D, C0, Cs, a, d, t and i denote the average coefficient
of diffusion of hydrogen (cm2 s-1), the initial hydrogen
Figure 3. Anodic polarization curves for the A–x wt.% B (x = 0, 10, 20, 30) alloy electrodes at 50% DOD (scan rate: 0.5 mV s-1).
Figure 4. Linear polarization curves for the A–x wt.% B (x = 0, 10, 20, 30) alloy electrodes at 50% DOD (scanning rate: 0.1 mV s-1).
concentration in the bulk of the alloy (which is considered uniform, mol cm-3), the hydrogen concentration on the
surface of the alloy particles (which is considered uniform, mol cm-3), the alloy particle radius (cm), the density of
the hydrogen-storage alloys (gcm-3), the discharge time
(s) and the diffusion current density (A g-1), respectively.
With an assumed average particle radius of a = 15 µm, the
values of D calculated by the equation 4 are tabulated in
Table 1. The hydrogen diffusion coefficientincreases from 2.24 × 10⁻¹⁰ cm2 s-1 (x = 0) to 4.01 × 10⁻¹⁰ cm2 s-1 (x = 10), and
then decreases to 2.33 × 10⁻¹⁰ cm2 s-1 (x = 30). It indicates
that the hydrogen diffusivity firstly increases and then drops with the addition of AB5-type M1Ni3.5Co0.6Mn0.4Al0.5 alloy,
in agreement with the limiting current density.
Electrochemical impedance spectra (EIS)
The charge-transfer resistance (Rct) of the alloy
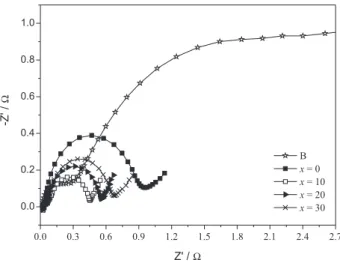
electrode can be determined by the electrochemical impedance spectra. Figure 6 illustrates the EIS curves for the A–x wt.% B (x = 0, 10, 20, 30) alloy electrodes at
50% DOD. It can be seen that each spectrum consists of a smaller semicircle in the high-frequency region and a larger semicircle in the low-frequency region followed by a straight line. According to the study of Kuriyama et al.,16
the high-frequency semicircle represents the contact resistance between the current collector and the alloy electrode, the low-frequency semicircle represents the charge-transfer resistance, and the straight line is namely Warburg impedance. It can be seen in Figure 6 that the contact impedance remains almost unchanged, but the radius of the large arc in the low-frequency region is in the order of x = 0 > x = 30 > x = 20 > x = 10, indicating
that the charge-transfer resistance increases firstly and then
decreases with increasing x, and the electrodewith x = 10
exhibits the best electrochemical reaction rate.
High rate dischargeability (HRD)
Figure 7 presents the high rate dischargeability for the A–x wt.% B (x = 0, 10, 20, 30) alloy electrodes. The value
of HRD is calculated according to the following equation:
HRD (%) = Cd/C50 100 (5)
where Cd and C50 represent thedischarge capacities at the
current densities of Id and 50 mA g-1, respectively. The
values with the discharge current density of 600 mA g-1 are
listed in Table 1. The M1Ni3.5Co0.6Mn0.4Al0.5 alloy presents
the single LaNi5 phase, and the A–x wt.% B (x = 0, 10,
20, 30) alloys consist of multiphase structures. The phase boundary may decrease the lattice distortion and strain energy. Moreover, the phase boundary can provide good tunnels for the diffusion of hydrogen atoms, therefore, the kinetics of A–x wt.% B (x = 0, 10, 20, 30) is improved. For
the composite electrodes, the HRD600 value increases from
84.2 % (x = 0) to 95.8% (x = 10), and then decreases to
88.8% (x = 30). It is well known that HRD is closely related
to the kinetics of the alloy, which is mainly controlled by both the charge transfer resistance at the surface of alloy electrode and the hydrogen diffusion resistance inside the bulk of alloy.17 A proper ratio of La
2Ni7 to LaNi5 phases is
probably the reason why the electrodewith x = 10 presents
the best kinetic performance.
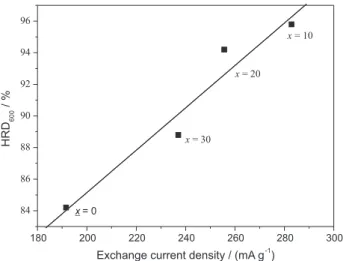
Figure 8 shows HRD600 as a function of I0 (obtained
from linear polarization) for the A–x wt.% B (x = 0, 10, 20,
30)alloy electrodes. There is a linear relationship between
Figure 6. The electrochemical impedance spectra for the A–x wt.% B (x = 0, 10, 20, 30) alloy electrodes at 50% DOD (open circuit potential, amplitude 5 mV).
Figure 8. Dependence of HRD600 on I0 of the A–x wt.% B (x = 0, 10, 20,
30) alloy electrodes.
HRD600 and I0. It is accepted that in case the charge-transfer
reaction on the surface of the alloy electrodes is the rate-determining factor, a linear dependence of the HRD on the exchange current density would be obtained.18 Accordingly,
it is concluded that the HRD is essentially controlled by electrochemical reaction of hydrogen on alloy surface at the discharge current density of 600 mA g-1.
The electrochemical kinetics is mainly determined by both the charge-transfer resistance on the surface of alloy electrode and hydrogen atom diffusion within the bulk of the alloy. The former can be characterized by I0 or Rct, while the latter can be characterized by the hydrogen
diffusion coefficient or the limiting current density. In the present study, I0, IL and D firstly increase and then decrease
with increasing x from 0 to 30. Thus, the kinetics of the
investigated electrodes increases and then decreases with the increasing of M1Ni3.5Co0.6Mn0.4Al0.5 alloy content.
Conclusions
The La0.78Mg0.22Ni2.67Mn0.11Al0.11Co0.52–x wt.%
M1Ni3.5Co0.6Mn0.4Al0.5 (x = 0, 10, 20, 30) composite alloys
have a multi-phase structure of LaNi5 and La2Ni7 phases.
With the addition of M1Ni3.5Co0.6Mn0.4Al0.5 alloy, the
discharge capacity slightly drops, while the cycle stability is obviously enhanced. The kinetics of alloy electrodes firstly increases and then decreases with x increase. The
linear relationship between HRD and I0 indicates that
charge-transfer reaction on the surface should be the rate-determining factor for the electrochemical kinetics when the discharge current density is 600 mA g-1.
Acknowledgements
This work was financially supported by the Education Department and Scientific Foundation of Guangxi (201203YB088).
References
1. Zhang, Y. H.; Dong, X. P.; Li, B. W.; Ren, H. P.; Wu, Z. W.; Wang, X. L.; J. Alloys Compd. 2008, 465, 422.
2. Dong, Z. W.; Wu, Y. M.; Ma, L. Q.; Wang, L. D.; Shen, X. D.; Wang, L. M.; Int. J. Hydrogen Energy2011, 36, 3050. 3. Hu, L.; Han, S. M.; Li, J. H.; Zhu, X. L.; Li, Y.; Rare Met. 2008,
27, 429.
4. Yu, X. B.; Walker, G. S.; Grant, D. M.; Wu, Z.; Xia, B. J.; Shen, J.; Appl. Phys. Lett. 2005, 87, 133121.
5. Chu, H. L.; Qiu, S. J.; Sun, L. X.; Zhang, Y.; Xu, F.; Zhu, M.; Hu, W. Y.; Int. J. Hydrogen Energy2008, 33, 755.
6. Huang, H. X.; Huang, K. L.; Chen, D. Y.; Li, S. Q.; Zhuang, S. X.; J. Mater. Sci. 2010, 45, 1123.
7. Zhang, Y. H.; Li, B. W.; Ren, H. P.; Cai, Y.; Dong, X. P.; Wang, X. L.; Int. J. Hydrogen Energy2007, 32, 4627.
8. Oesterreicher, H.; Clinton, J.; Bittner, H.; Mater. Res. Bull.
1976, 11, 1241.
9. Wang, Y.; Wang, X.; Gao, X. P.; Shen, P. W.; Int. J. Hydrogen Energy2007, 32, 4180.
10. Liu, Y. F.; Jin, Q. W.; Gao, M. X.; Zhu, Y. F.; Zhang, Z. H.; Pan, H. G.; Rare Met. Mater. Eng. 2003, 32, 942.
11. Zhang, Z.; Han, S. M.; Li, Y.; Jing, T. F.; J. Alloys Compd. 2007, 431, 208.
12. Notten, P. H. L.; Hokkeling, P.; J. Electrochem. Soc. 1991, 138, 1877.
13. Li, Y.; Han, S. M.; Li, J. H.; Hu, L.; Electrochim. Acta2007, 52, 5945.
14. Nishima, T.; Ura, H.; Uchida, I.; J. Electrochem. Soc. 1997, 144, 1273.
15. Zheng, G.; Popov, B. N.; White, R. E.; J. Electrochem. Soc.
1995, 142, 2695.
16. Kuriyama, N.; Sakai, T.; Miyamura, H.; Uehara, I.; Ishikawa, H.; Iwasaki, T.; J. Alloys Compd. 1993, 202, 183.
17. Li, Y.; Han, S. M.; Li, J. H.; Zhu, X. L.; Hu, L.; J. Alloys Compd.
2008, 458, 357.
18. Iwakura, C.; Oura, T.; Inoue, H.; Matsuoka, M.; Electrochim. Acta1996, 41, 117.
Submitted: February 17, 2013