Article
Development of a Coulometric Method for the Determination of
Gaseous Sulfur Compounds in Urban Atmospheres
Magali Silva and Luis F. P. Dick*
Departamento de Metalurgia, Universidade Federal do Rio Grande do Sul, Av. Osvaldo Aranha, 99/6° andar, 90035-190, Porto Alegre - RS, Brazil
Uma nova metodologia para a determinação de compostos gasosos de enxofre presentes em atmosferas urbanas foi desenvolvida e aplicada durante três meses na região central da cidade de Porto Alegre- RS e em uma refinaria de petróleo, localizada próxima à essa cidade. O método se baseia na determinação coulométrica da taxa de sulfetação da prata pura. Os resultados foram comparados com o método da pararosanilina, que está sendo atualmente utilizado para a determinação
de SO2 em alguns dos locais aqui estudados. Os resultados obtidos mostraram que uma boa
correlação entre o método coulométrico e o método da pararosanilina é observada quando somente
SO2 está presente, como normalmente é esperado para atmosferas urbanas. Quando H2S está
também presente, como no caso das áreas industriais, a nova metodologia tende fortemente a super estimar derivados gasosos de enxofre.
A new procedure for the determination of atmospheric sulfur compounds was developed and applied during three months in the central area of the City of Porto Alegre- RS, and one month near an oil refinery located close to this city. The method is based on the coulometric determination of the tarnishing rate of pure silver. The results were compared with the method of pararosaniline, which
is being currently used in some of the studied sites for the determination of SO2. The results obtained
showed a good correlation between the coulometric method and the pararosaniline method, when
only SO2 is present, as usually is the case of urban atmospheres. When H2S is also present, as in the
case of industrial areas, the methodology tends to strongly overestimate SO2 concentration.
Keywords: coulometric method, tarnishing of Ag, urban pollution, SO2, H2S
Printed in Brazil 0103 - 5053 $6.00+0.00
*e-mail: [email protected]
Presented at the XI Simpósio Brasileiro de Eletroquímica e Eletroana-lítica, Maragogi - AL, Brazil, April 5-9, 1999. Guest editor: Luis Alberto Avaca.
Introduction
Besides suspended particles, gaseous compounds, such
as carbon monoxide (CO), carbon dioxide (CO2) and sulfur
dioxide (SO2), are normally the main atmospheric
pollut-ants in urban areas1, 2. Previous studies showed that in
Porto Alegre- RS, approximatly 3.7 tons of SOx are daily
emitted. Further 3.4 tons of SOx per day are produced in the
industrial metropolitan area around the city3.
The main SO2 source in urban areas is commonly
accepted as resulting from the use of fossil fuels. In warm regions like Southern Brazil, the main source should be attributed to the transport activity and to the use of Diesel
oil. Due to local variations in the traffic density and in the
wind velocity in a city, a local monitoring of SO2 is more
adequate to identify critical areas, which are harmful to the human health and are also very corrosive to metals, stones and concrete structures.
The aim of the present study was to develop a method
for the determination of atmospheric SO2 content. The
method should be inexpensive and simple, making pos-sible the local determination of the mean concentration in several points in an urban area. As showed below, the tar-nishing rate of silver shows the desired characteristics for
an indicator of the SO2 concentration.
Pure silver, when exposed to H2S or SO2, forms a
tar-nishing layer consisting only of achantite (alpha Ag2S).
This sulfide has an extremely low solubility product in
water, Kps=1 10-50 mol L-1 3,4 and is very conductive and
adherent to the silver surface, enabling its coulometric
Moreover, due to the high mobility of Ag+ ions in the
Ag2S salt, the tarnishing rate is time independent for
tar-nishing layers up to several microns thick, being directly
proportional to the H2S and SO2 concentrations5. As an
example, the tarnishing rate of Ag in 1ppm H2S, which is
higher than the one in SO2, remains controlled by surface
reaction for several days6, 7.
The results presented here were measured during the southern hemisphere summer of 1999 in three urban points of Porto Alegre- RS, showing heavy traffic, where only
SO2 is expected, and also in two sites near an oil refinery,
with different distances from a H2S source. An increasing
SO2/H2S concentration ratio is expected here for greater
distances from the H2S source, resulting from the
oxida-tion of H2S to SO2 during its transport from the source to
the measuring site. A long-term study is now under way to determine the influence of traffic intensity and climate parameters in the correlation between the coulometric and pararosaniline methods.
Experimental
For the coulometric determination of tarnishing rates, coupons of pure silver (Sigma-Aldrich, 99.99% Ag) with
geometric areas between 5 and 6 cm2 were cut and provided
with a 0.5 mm diameter hole. After vacuum annealing
(650 °C h-110-2 atm) the coupons were polished on both
sides with emery paper up to 2400 mesh and degreased in ethanol. For the atmospheric exposure, the coupons were
hanged by a PTFE threadin the vertical positionat five
“moni-toring stations”, where a good ventilation and rain protection were provided, and also other atmospheric data were being collected. Three monitoring stations were located in down-town sites, with dense traffic, Rodoviária, Borges and Azenha.
Among these sites, Rodoviária, where the Central Bus
Sta-tion is located,shows usually the highest SO2 emissions. The
other two monitoring stations were located at 19 kmfar from
downtown of Porto Alegre- RS, at the oil refinery “Refinaria
Alberto Pasqualine-Petrobras”, namely REFAP1 and REFAP2.
The station REFAP1 lied 750 m far from an H2S-SO2-source,
and REFAP2, respectively 1,500 m. At three of these stations,
Rodoviária, REFAP1 and REFAP2, SO2 was also collected and the concentration determined by the pararosaniline
method as described in the appropriate norm8. The
expo-sures were proceededfrom January to March 1999. The mean
relative humidity and temperature during this period were 79.4% and 24.9 ºC respectively, as determined for Porto Alegre- RS by the local state climate station.
After exposure for different times, the Ag coupons were rinsed with water and acetone and reduced potentiodynami-cally in a standard three electrodes cell. The electrolyte was a
borate buffer of pH 10 (3.092 g L-1H3BO3, 3.728 g L-1 KCl,
1.756 g L-1 NaOH), with addition of small quantities of Na2S
and purged previously for 8 h with N2. Good results were
obtained for sweep velocities in the negative direction of 0.1 mV s-1, starting from the Ag2S/Ag equilibrium potential. This low sweeping rate was necessary to avoid the superposition
of the Ag2Sreduction peak and the current related to the
hydrogen evolution reaction. The equilibrium potential
(Ag2S/Ag) was determined by a previous potentiodynamic
sulfidation and reduction of a blank Ag probe in the same solution. The potentials were measured against an AgCl/Ag reference electrode in 3.5 mol L-1 KCl, but are referred in the text to the normal hydrogen electrode (NHE). After data
ac-quisition by computer, the mass of Ag2S per area was
calcu-lated from the charge density under the observed cathodic
peak, assuming Ag2S as the only tarnishing product and
sub-tracting the charge related to the background current density.
Results and Discussion
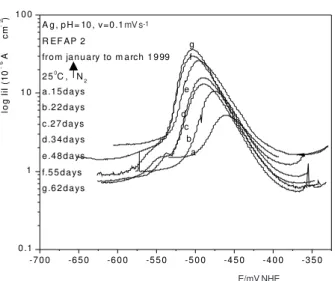
The voltammograms of the reduction of the exposed Ag coupons are shown in Figures from 1 to 5. A sharp
reduction peak in the range between E(Ag2S/Ag) and –
200 mV more negative than this, i.e (from –350 to 550
mV) is always observed. The peak current density grows with the exposure time, and it can be attributed
undoubt-edly to the reduction of the environmentally formed Ag2S.
No reduction peaks could be observed for unexposed Ag samples. The background current density, measured on unexposed samples, or estimated on exposed samples as
the current minimum between the Ag2S peak and the
hy-drogen evolution region, ranged between 0.2 and 1µA cm-2,
indicating the reduction of residual O2 dissolved in the
elec-trolyte. The coupons exposed at urban sites, i.e. Rodoviária,
Borges and Azenha, (Figures 1-3, respectively) showed less pronounced reduction peaks, comparing to the ones
ex-posed at the oil refinery sites, REFAP1 and REFAP2
(Fig-ures 4 and 5). For expos(Fig-ures at the less aggressive sites
Borges and Azenha, a clear identification of the reduction
peaks, at a potencial sweep rate of 0.1 mV s-1 was only
pos-sible for exposure times of ca. 10 days or longer. For the
more aggressive sites at the refinery, clear peaks were al-ready identified after seven days of exposure.
Samples exposed for more then 20 days at the most aggressive sites showed a second reduction peak (Figure 1, 4, 5). Its current density, subtracting the background
current, grows with time of exposure and with the
aggressivity of the atmosphere, and its current was allways
less than 3% of the main Ag2S peak. A second reduction
peak was also observed by the reduction of Ag samples
1.1km apart in downtown Porto Alegre (Borges and
Rodoviária). Moreover, for a distance of 2.5 km from the
H2S-S02 source at the refinery, the atmosphere is still 4.25
times more aggressive than the most polluted site
identi-fied in downtown Porto Alegre, i.e. Rodoviária.
The comparison between the Ag tarnishing rate and the
mean SO2 concentration as determined by daily
measure-ments during the same period with the pararosaniline method is presented in Figure 7. Using the data from the
two sites where only SO2 is expected (Rodoviária and
REFAP2) a ratio between the SO2 concentration and the
Ag tarnishing rate of 86±4g SO2 m-3/g Ag2S cm-2 day-1.
For the site REFAP1, where H2S is also present, a 4 times
smaller ratio is found. This is certainly due to a much higher
Ag tarnishing rate in H2S than in SO2. The coulometric
Figure 1. Voltammograms for the reduction of Ag2S on Ag coupons
in borate buffer, v = 0.1mV s-1, after atmospheric exposure during
January-March 1999 at the Rodoviária site in Porto Alegre.
-700 -650 -600 -550 -500 -450 -400 -350
0.1 1 10 100
Ag, pH=10, v=0.1mV /s
RO DO VIÁ RIA
from january to march 1999
250 C, N2 a.23days b.32days c.53days d.67days d c b a log I iI ( 10 - 6
A *
cm
- 2
)
E(m V)NHE
-70 0 -65 0 -60 0 -55 0 -50 0 -45 0 -40 0 -35 0
0.1 1 10 100
Ag, pH =10, v= 0.1m V/s AZ E NHA
from january to m arch 1999
250C, N 2 a.21days b.33days c.54days d.68days log I iI ( 10 - 6
A *
cm
- 2)
E (m V ) N HE d
c b a
Figure 2. Voltammograms for the reduction of Ag2S on Ag coupons
in borate buffer, v = 0.1mV s-1, after atmospheric exposure during
January-March 1999 at the Azenha site in Porto Alegre.
Na2S6,7. Only Ag
2S could be detected in that case by
X-ray diffraction and thus, it is here assumed that only Ag2S
is formed atmospherically.
The mass of Ag2S formed vs. the exposure time is
shown for all sites in Figure 6. For the determination of the respective tarnishing rates, a linear correlation was found for the mass vs. time curves. The correlation coefficients were
normally higher then 0.93, with exception of the Borges site,
where R = 0.70 was measured. The aggressivity of the sites and the respective Ag tarnishing rates, lie in the following decrescent order: ∂m/∂tREFAP1 = 1.00, ∂m/∂tREFAP2 = 0.34, ∂m/∂tRodoviária = 0.08, ∂m/∂tAzenha = 0.06 and ∂m/∂tBorges
= 0.007µg Ag2S cm2 day-1. These results indicate that there are differences of more than one order of magnitude in the
tarnishing rates and SO2 concentrations of sites lying only
-700 -650 -600 -550 -500 -450 -400 -350
0.1 1 10 100 log I iI ( 10
- 6 A *
cm
- 2)
E(m V ) NHE A g, pH=1 0, v =0.1m V /s
BO R G E S D E M E DE IRO S from january to m arch 1999
250 C, N2 a.21days b.32days c.51day s d.65days d c b a
Figure 3. Voltammograms for the reduction of Ag2S on Ag coupons
in borate buffer, v = 0.1mV s-1, after atmospheric exposure during
January-March 1999 at the Borges de Medeiros site in Porto Alegre.
-700 -650 -600 -550 -500 -450 -400 -350
0,1 1 10 100 1000
A g, pH=10,V=0.1m V/s REF AP 1
from january to m arch
250 C, N2 a.15 days b.22days c.27days d.34days e.45days f. 62days g.69days log I iI ( 1 0
- 6 A *
cm
- 2)
E(m V) NHE g f e d c b a
Figure 4. Voltammograms for the reduction of Ag2S on Ag coupons in
borate buffer, v = 0.1mV s-1, after atmospheric exposure during
January-March 1999 at the REFAP1 site in Refinaria Alberto Pasqualine.
mV s-1 mV s-1
mV s-1 mV s-1
E/mV NHE
E/mV NHE E/mV NHE
-700 -650 -600 -550 -500 -450 -400 -350 0.1 1 10 100 g f e d c b a A g, pH= 10, v=0.1mV /s R EF AP 2
from january to m arch 1999
250 C , N2 a.15days b.22days c.27days d.34days e.48days f.55days g.62days lo g Ii I ( 1 0 - 6 A * c m - 2 )
E (m V ) NHE
Figure 5. Voltammograms for the reduction of Ag2S on Ag coupons in
borate buffer, v = 0.1mV s-1, after atmospheric exposure during
January-March 1999 at the REFAP2 site in Refinaria Alberto Pasqualine.
0 1 0 2 0 3 0 4 0 5 0 6 0 7 0 8 0
0 1 0 2 0 3 0 4 0 5 0 6 0 7 0 8 0
a ) R E F A P 1 b ) R E F A P 2 c ) R O D O V I Á R I A d ) A Z E N H A
e ) B O R G E S d e M E D E I R O S
ed c b a 10 -6 g A g2 S / c m 2
T im e (d a y s )
Figure 6. Tarnishing curves of Ag2S growth for Ag samples exposed
at different sites.
method suffers from H2S interference, and no
quantita-tive resultscan beexpected in this case. Even so, it points
out that the site REFAP1 has a much more aggressive
at-mosphere than REFAP2. The pararosanilinemethod,
cur-rently in use, indicated a SO2 concentration 1.5 times higher
at the most distant point from the source than at a closer
one. This is probably due to the oxidation of H2S to SO2 in
the way between the source and REFAP2.
A comparison between tarnishing rates measured in an
environmental chamber6, 7 containing 1 ppm H2S at T=
25ºC and the ones determined in this work at a mean rela-tive humidity of 79.4% and temperature of 24.9°C is pre-sented in Figure 8. Assuming that the tarnishing rate is
directly proportional to the H2S concentration, an
equiva-lent H2S concentration can be calculated. The values
ob-5 1 0 1 5 2 0 2 5 3 0 3 5 0 . 0
0 . 5 1 . 0 1 . 5
R E F A P 2
R O D O V I Á R I A
R E F A P 1
10
-6g A g 2
S
/ c
m
2 * d
a y C oul om et ri c M et hod
1 0- 6
g S O2 / m 3
a r P a ra r o s a n ilin e M e t h o d
6 5 7 0 7 5 8 0 8 5 9 0 9 5
0 . 0 0 . 5 1 . 0 1 . 5 2 . 0 2 . 5 3 . 0 3 . 5
R O D O V IÁ R IA R E F A P 2 R E F A P 1
1 pp m H2S
10
-6g A
g 2
S
/ c
m
2 * day
C o ul o m et ri c M e tho d
R e lativ e H um id ity R U ( % )
Figure 7. Comparison between the Ag tarnishing rates and the
mean SO2 concentration determined by the pararosaniline method.
Figure 8. Comparison between the Ag tarnishing rate measured in
an environmental chamber at 25 ºC, 1H2S, at 70, 80 and 90%
relative humidity and the mean tarnishing rates determined at the monitoring stations.
tained are 0.36 ppm for REFAP1, 0.12 ppm for REFAP2
and 0.03 ppm for Rodoviária.
Conclusions
The coulometric method, based on the determination of the tarnishing rate of Ag, can be used for the
determina-tion of SO2 concentrations in urban atmospheres. When
H2S is also present, as in industrial areas, an over
estima-tion of the SO2 concentration is expected, as the method
can not separate the effect of these two species. At least
one week is necessary till the presence of SO2 can be
de-tected in urban sites. Dueto its low cost and simplicity, the
method is more adequate for the local determination of
long term average concentrations of SO2.
mV s-1
E/mV NHE
cm
-2
Time / days
Relativity Humidity RU / % SO2 m-3 air
cm
-2 day
Acknowledgments
The Secretaria Municipal do Meio Ambiente from the City of P orto Ale gre and the company REFAP-PETROBRAS are gratefully acknowledged for technical support. M. Silva thanks CAPES for a fellowship.
References
1. Pereira, P. M.; Saldiva, P. H. N.; Sakae, R. S.; Bohm,
G. M.; Martins, M. A. Environ. Res.1995, 69, 96.
2. Darlington, T. L.; Kahlbaum, D. F.; Heuss, J. M.; Wolff, G. T. J. Air & Waste Manage. Assoc. 1997, 47, 1070.
3. Refinaria Alberto Pasqualine Reports- Levantamento sobre a contribuição do setor automotivo na geração de poluentes atmosféricos na região metropolitana
de Porto Alegre 1996.
4. Licht, S. J. Electrochem. Soc. , 1988,135, 2971.
5. Franey, J. P.; Kammlott, G. W.; Graedel, T. E. Corros.
Sci. 1985, 25, 1163.
6. Dick, L. F. P.; Kaiser, H. Kaesche, The Electrochem. Soc. Softbound Proc. Series, Pennington NJ, 1993, p 406.
7. Dick, L. F. P.; Kaiser, H. Kaesche, The Electrochem.
Soc. Softbound Proc. Series, Pennington NJ, 1991, p 273.
8. Annual Book of ASTM Standards, 1972, 23, 843.