CLINICAL SCIENCE
Pulmonary Division, Heart Institute (InCor), Faculdade de Medicina da Universidade de São Paulo – São Paulo/SP, Brazil.
Phone: 55 11 3069.5695 Email: [email protected]
Received for publication on May, 09, 2008 Accepted for publication on July 07, 2008
MALIGNANT AND TUBERCULOUS PLEURAL
EFFUSIONS: IMMUNOPHENOTYPIC CELLULAR
CHARACTERIZATION
Lucia Maria Zanatta de Aguiar, Leila Antonangelo, Francisco S. Vargas, Maria Cláudia Nogueira Zerbini, Maria Mirtes Sales, David E. Uip, Paulo Hilário Nascimento Saldiva
doi: 10.1590/S1807-59322008000500012
Aguiar LMZ de, Antonangelo L, Vargas FS, Zerbini MCN, Sales MM, Uip DE, Saldiva PHN. Malignant and tuberculous pleural effusions: immunophenotypic cellular characterization. Clinics. 2008;63(5):637-44.
INTRODUCTION AND OBJECTIVES: Tuberculosis and cancer are the main causes of pleural effusion. Pleural involvement
is associated with migration of immune cells to the pleural cavity. We sought to characterize the immunophenotype of leukocytes in the pleural effusion and peripheral blood of patients with tuberculosis or malignancy.
METHODS: Thirty patients with tuberculosis (14) or malignancy (16) were studied. A control group included 20 healthy blood donors.
RESULTS: Malignant phycoerythrin pleural effusions showed higher percentages of CD3, CD4, CD3CD45RO, and CD20CD25 lymphocytes and lower percentages of CD3CD25 and CD20HLA-DR when compared to PB lymphocytes. Compared to PB, tu-berculous effusions had a higher percentage of lymphocytes that co-expressed CD3, CD4, CD3CD45RO, CD3TCRαβ, CD3CD28, and CD20 and a lower percentage of CD14, CD8 and CD3TCRγδ-positive lymphocytes. Malignant effusions presented higher expression of CD14 whereas tuberculous effusions had higher expression of CD3 and CD3CD95L. Peripheral blood cells from tuberculosis patients showed higher expression of CD14, CD20CD25 and CD3CD95L. Compared with the control cells, tubercu-losis and cancer peripheral blood cells presented a lower percentage of CD3CD4 and CD3CD28-positive cells as well as a higher percentage of CD3CD8, CD3CD25 and CD3CD80-positive cells.
CONCLUSIONS: Tuberculous and malignant peripheral blood is enriched with lymphocytes with a helper/inducer T cell phenotype, which are mainly of memory cells. CD14-positive cells were more frequently found in malignant effusions, while CD3-positive cells expressing Fas ligand were more frequently found in tuberculous effusions.
KEYWORDS: Pleural luid; Cancer; Flow cytometry; Monoclonal antibody; Tuberculosis.
INTRODUCTION
The accumulation of luid in the pleural space indicates the presence of systemic or local disease. Pleural exudates involve the migration of immune cells to the pleural cavity.1 Characterization of the cellular composition of such exudates may provide insight into the relevant pathophysiological mechanisms and the functional state
of the cells. Tuberculosis and cancer represent the main causes of pleural exudates. In both cases, the pleural luid is generally lymphocytic, with a predominance of T lymphocytes, particularly CD4-positive T cells.2
Considering the compartmentalization of the pleural space, the association between the local and systemic cellular responses should be analyzed. Some investigators have found that, when compared with peripheral blood, exudates have increased numbers of CD4-positive T lymphocytes. However, the immunophenotypic proile of the pleural luid does not permit discrimination of the causal diagnosis.2-7
proile when compared to blood, suggesting that these cells represent memory T cells.9,10 On the other hand, Dlugovitzky et al.11 reported an increase in the number of CD25-positive cells (IL-2 receptor-expressing), whereas Faith et al.12 observed expression of the HLA-DR marker, suggesting the presence of activated T cells.
Similarly, several studies have evaluated the lymphocytic proile (pleural luid and blood) of patients with cancer. These studies generally indicate a predominance of T lymphocytes in the pleural luid, with increased prevalence of a CD4-positive subpopulation when compared to blood13-17. Baxevanis et al.18 and Mantovani et al.19 demonstrated a lower percentage of natural killer cells (CD16) in the pleural luid than in peripheral blood. Only a minority of T lymphocytes were activated, which expressed CD38 and HLA-DR surface markers.14 These lymphocytes were found to have natural killer activity and very low antitumor cytotoxicity, which is suggestive of depressed immune function15. Another factor associated with the lack of a T cell-mediated immune response is the existence of an apoptotic mechanism that, in addition to regulating the homeostasis of cell populations, acts to eliminate self-reactive lymphocytes and negatively regulate the immune response.20-22 The apoptotic signal is transmitted to mature T cells through various membrane receptors, mainly CD3/TCR, Fas/Apo/CD95, TNF, CTL-4, and CD2. Only activated T cells develop the cellular substrate required for transmission of the apoptotic signal.23 Thus, the analysis of cell surface markers permits the evaluation of cellular differentiation (CD3, CD4, CD8, CD15, CD20, CD56, TCRαβ, and TCRγδ), cellular activation (CD25, CD45RA, CD45RO, and HLA-DR), and immune co-stimulation (CD28, CD80, CD86 and CD152) in pleural luid and blood. The aim of this study was to elucidate the pathophysiological mechanisms involved in the genesis of pleural exudates of tuberculous or neoplastic origin.
PATIENTS AND METHODS
The Ethics Committee of our institution approved this study. Thirty patients with pleural exudates (14 tuberculosis, 16 cancer) with no previous treatment were included in the study. These patients were indicated for thoracocentesis and underwent collection of pleural luid and blood after they signed an informed consent form. Light’s criteria24 were used for classiication of transudate or exudate. The diagnosis of tuberculosis was made based on the presence of compatible clinical and radiological signs associated with a M. tuberculosis-positive culture from luid or pleural fragments, on the presence of caseous granuloma in the pleura, or both. The presence of tumor cells in the pleural
luid or tissue indicated cancer.
Twenty healthy blood donors were included in the study as well (blood control).
Biochemical examinations and pleural fluid cytology
Biochemical examination of blood and pleural fluid (protein and lactate dehydrogenase) and blood count were performed using automatic devices (Cobas Integra 700, West Sussex, UK; Pentra 120, Horiba ABX, Montpellier, France). The total number of nucleated cells (pleural luid) was quantiied in a Neubauer chamber (Hausser Scientiic, Horsham, PA). Slides stained with Leishman panoptic stain were used for qualitative and oncotic cytology.
Cell preparation and cell viability testing
The mononuclear cell concentrate was obtained by centrifugation of pleural luid or blood (1500 rpm for 10 min at 25oC), and the inal concentration was adjusted to 2 x 10⁷ cells/mm2. Cell viability was evaluated by Trypan blue exclusion (Gibco BRL, Grand Island, NY). Only samples with more than 70% viable cells were used in this study.
Flow cytometry
Blood or pleural luid cells were incubated with mono-clonal antibodies conjugated to luorescein isothio cyanate (FITC) or phycoerythrin (PE). Direct immunoluorescence was used for the analysis of cell surface antigens other than CD95-L. Autoluorescence of cells and nonspeciic binding of monoclonal antibodies were corrected for by using iso-typic controls. Antigens were quantiied by the detection of luorescence emitted by luorochrome-labeled monoclonal antibodies in a FACSCalibur low cytometer (Becton-Dickin-son, San Jose, CA) using the CellQuest (Becton Dickinson) program.
Cell populations were identiied based on analysis of the cytograms. Cell data were arranged in 2-dimensional cytograms (abscissa: cell size; ordinate: internal cell complexity). Leukocytes were identiied by quantiication of anti-CD45-labeled cells. Among the CD45-positive population, the group with the lowest internal complexity corresponded to lymphocytes. CD45, CD15- and CD45, CD14-positive cells characterized granulocytes and monocytes/macrophages. T, B, and natural killer lymphocytes were identiied based on their staining by CD3, CD20, and CD56 antibodies.
positive for CD3, CD20, and CD14, respectively, on the abscissa with surface antigens on the ordinate.
Apoptosis
Leukocyte apoptosis was analyzed in blood and pleural luid using the APO-BRDU kit (Pharmigen, San Diego, CA). Mononuclear cells were separated on a density gradient using the Lymphoprep kit (Nycomed Pharma, Oslo, Norway). A suspension of 2 x 10⁶ cells in a 5-ml aliquot of phosphate-buffered saline was held on ice (15 min). After several washes, the cell sediment obtained by centrifugation was diluted in 50 µl of DNA strand-break labeling solution. Cells were then incubated with 0.1 ml of anti-BrDu (FITC) solution, followed by 0.5 ml PI dye/RNase A solution. Apoptosis was quantiied based on the luorescence emitted by the FITC-labeled anti-BrDu antibody in a FACSCalibur cytometer using the Cell Quest program (Becton-Dickinson, São Paulo, Brazil).
Statistical analysis
The paired t test (normal distribution) and Wilcoxon test (not normal distribution) were used for comparisons of blood and pleural luid. Leukocyte subpopulations (luid) were compared using the Student’s t test or the Mann-Whitney test. Differences in the blood leukocyte subpopulation percentage among groups were determined by analysis of variance (ANOVA), followed by Tukey’s multiple comparisons or the Kruskal-Wallis test and Dunn’s multiple comparison procedure. The level of signiicance was set at 0.05, and SPSS 10.0 for Windows statistical software was used for analysis.
RESULTS
Thirty patients were studied: 14 (12 men and 2 women; mean age: 36.9 years) with pleural tuberculosis and 16 (5 men and 11 women; mean age: 60.4 years) with malignant effusion.
Immunophenotypic profile of pleural fluid
Four main patterns of cell distribution were identiied using 2-dimensional cytograms (abscissa: cell size; ordinate: internal complexity of cells):
Pattern 1: Small cells of low complexity (region usually occupied by lymphocytes in normal blood).
Pattern 2: Cell population described in pattern 1 plus cells with small size and high internal complexity (corresponding to granulocytes in normal blood).
Pattern 3: Populations 1 and 2, plus medium-sized and medium-complexity cells (corresponding to monocytes in normal blood).
Pattern 4: Population 1, plus cells of variable size and complexity (probably corresponding to macrophages and mesothelial cells in luid).
Pleural luid from patients with tuberculosis had cells with patterns 1 (9/14; 64.3%) and 3 (5/14; 35.7%), whereas most luid secondary to cancer had cells with patterns 4 (10/16; 62.5%) and 1 (4/16; 25.0%).
Comparison of cellular components between tuberculous or malignant luid showed a signiicant difference in the percentage of T lymphocytes (CD3) and monocytes/ macrophages (CD14). Neoplastic effusions had a higher percentage of CD14-positive cells (monocytes/macrophages) than did tuberculous effusions (p = 0.006), whereas the percentage of CD3-positive cells (T lymphocytes) was higher in tuberculous effusions (p = 0.002). Although the
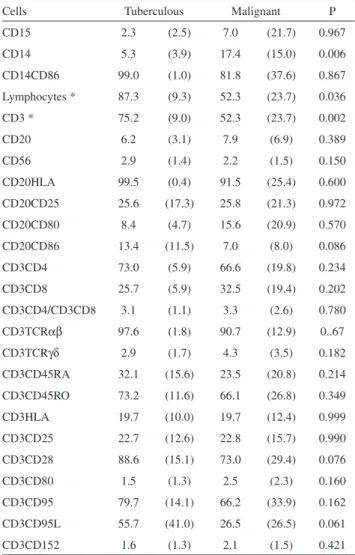
Table 1 - Percentage (mean ± standard deviation) of leukocyte subpopulations in pleural luid of patients with Tb or cancer (* p < 0.05)
Cells Tuberculous Malignant P
CD15 2.3 (2.5) 7.0 (21.7) 0.967
CD14 5.3 (3.9) 17.4 (15.0) 0.006
CD14CD86 99.0 (1.0) 81.8 (37.6) 0.867
Lymphocytes * 87.3 (9.3) 52.3 (23.7) 0.036
CD3 * 75.2 (9.0) 52.3 (23.7) 0.002
CD20 6.2 (3.1) 7.9 (6.9) 0.389
CD56 2.9 (1.4) 2.2 (1.5) 0.150
CD20HLA 99.5 (0.4) 91.5 (25.4) 0.600
CD20CD25 25.6 (17.3) 25.8 (21.3) 0.972
CD20CD80 8.4 (4.7) 15.6 (20.9) 0.570
CD20CD86 13.4 (11.5) 7.0 (8.0) 0.086
CD3CD4 73.0 (5.9) 66.6 (19.8) 0.234
CD3CD8 25.7 (5.9) 32.5 (19.4) 0.202
CD3CD4/CD3CD8 3.1 (1.1) 3.3 (2.6) 0.780
CD3TCRαβ 97.6 (1.8) 90.7 (12.9) 0..67
CD3TCRγδ 2.9 (1.7) 4.3 (3.5) 0.182
CD3CD45RA 32.1 (15.6) 23.5 (20.8) 0.214
CD3CD45RO 73.2 (11.6) 66.1 (26.8) 0.349
CD3HLA 19.7 (10.0) 19.7 (12.4) 0.999
CD3CD25 22.7 (12.6) 22.8 (15.7) 0.990
CD3CD28 88.6 (15.1) 73.0 (29.4) 0.076
CD3CD80 1.5 (1.3) 2.5 (2.3) 0.160
CD3CD95 79.7 (14.1) 66.2 (33.9) 0.162
CD3CD95L 55.7 (41.0) 26.5 (26.5) 0.061
percentage of pro-apoptotic T lymphocytes (CD3, CD95L+) appeared to be higher in tuberculous effusions, the statistical signiicance was marginal (p = 0.061) (Table 1).
Comparison of cells in pleural fluid and blood
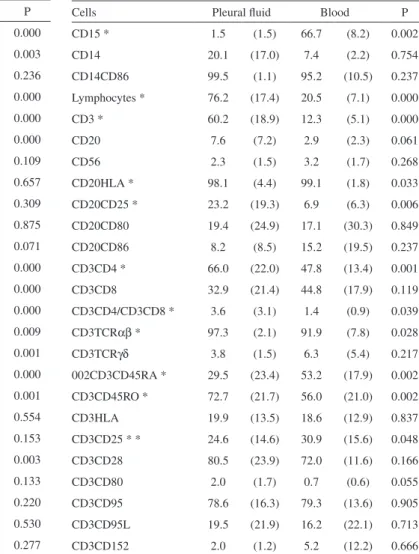
The following cell populations were found to be elevated in tuberculous effusions: total lymphocytes (p < 0.001), TCD3 (p < 0.001), CD3CD4 (p < 0.001), CD3CD45RO (p = 0.001), CD3TCRαβ (p = 0.009), CD3CD28 (p = 0.003), and CD20 (p < 0.001). The CD4/CD8 ratio was also higher in pleural luid (p < 0.001) (Table 2). In malignancy, a higher percentage of the following cell types and subtypes were observed in the pleural luid: total lymphocytes (p < 0.001), CD3 lymphocytes (p < 0.001), CD3CD4 lymphocytes (p = 0.001), CD3CD45RO lymphocytes (p = 0.002), CD20CD25 lymphocytes (p = 0.006), and CD3TCRαβ lymphocytes (p
= 0.028). The CD4/CD8 ratio was also higher in the pleural luid (p = 0.039) (Table 3).
These results demonstrate that lymphocytes represent the predominant cell population in malignant effusions and that these lymphocytes are mainly helper/inducer T cells (CD4) with a memory cell phenotype (CD45RO). The same proile was observed in effusions from patients with tuberculosis.
Comparison of cells in peripheral blood: tuberculosis versus cancer
No signiicant differences were observed for most surface markers. However, a higher percentage of CD14 (p = 0.012), CD3CD95L (p = 0.005), and CD20CD25 cells (p = 0.006) were observed in the tuberculosis group (Table 4).
When we compared blood cell subpopulations between patients with tuberculosis or cancer and the control group,
Table 2 - Percentage (mean ± standard deviation) of leuko-cyte subpopulations in peripheral blood and pleural luid of patients with tuberculous pleural effusions (* p < 0.05)
Cells Pleural luid Blood P
CD15 * 2.3 (2.5) 62.4 (8.0) 0.000
CD14 * 5.3 (3.9) 10.7 (3.0) 0.003
CD14CD86 99.0 (1.0) 99.3 (0.8) 0.236
Lymphocytes * 87.3 (9.3) 23.1 (6.8) 0.000
CD3 * 75.2 (9.0) 13.9 (4.6) 0.000
CD20 * 6.2 (3.1) 2.0 (1.0) 0.000
CD56 2.9 (1.3) 4.4 (2.5) 0.109
CD20HLA 99.5 (0.4) 99.8 (0.2) 0.657
CD20CD25 25.6 (17.3) 19.3 (18.6) 0.309
CD20CD80 8.4 (4.7) 9.8 ( 9.1) 0.875
CD20CD86 13.4 (11.5) 22.4 (16.2) 0.071
CD3CD4 * 73.0 (5.9) 50.9 (19.0) 0.000
CD3CD8 * 25.7 (5.9) 45.0 (13.7) 0.000
CD3CD4/CD3CD8 * 3.1 (1.1) 1.3 ( 0.8) 0.000
CD3TCRαβ * 97.6 (1.8) 93.0 ( 5.4) 0.009
CD3TCRγδ * 2.9 (1.7) 8.5 ( 5.3) 0.001
CD3CD45RA * 32.1 (15.6) 58.8 (11.7) 0.000
CD3CD45RO * 73.2 (11.6) 62.5 (10.4) 0.001
CD3HLA 19.7 (10.0) 22.0 (10.0) 0.554
CD3CD25 22.7 (12.6) 27.2 (8.4) 0.153
CD3CD28 * 88.6 (15.1) 70.6 (12.5) 0.003
CD3CD80 1.5 (1.3) 1.0 (1.0) 0.133
CD3CD95 79.7 (14.1) 74.7 (16.4) 0.220
CD3CD95L 55.7 (41.0) 50.9 (34.7) 0.530
CD3CD152 1.6 (1.3) 1.3 (1.4) 0.277
Table 3 - Percentage (mean ± standard deviation) of leuko-cyte subpopulations in peripheral blood and pleural luid of patients with neoplastic pleural effusions (*p < 0.05)
Cells Pleural luid Blood P
CD15 * 1.5 (1.5) 66.7 (8.2) 0.002
CD14 20.1 (17.0) 7.4 (2.2) 0.754
CD14CD86 99.5 (1.1) 95.2 (10.5) 0.237
Lymphocytes * 76.2 (17.4) 20.5 (7.1) 0.000
CD3 * 60.2 (18.9) 12.3 (5.1) 0.000
CD20 7.6 (7.2) 2.9 (2.3) 0.061
CD56 2.3 (1.5) 3.2 (1.7) 0.268
CD20HLA * 98.1 (4.4) 99.1 (1.8) 0.033
CD20CD25 * 23.2 (19.3) 6.9 (6.3) 0.006
CD20CD80 19.4 (24.9) 17.1 (30.3) 0.849
CD20CD86 8.2 (8.5) 15.2 (19.5) 0.237
CD3CD4 * 66.0 (22.0) 47.8 (13.4) 0.001
CD3CD8 32.9 (21.4) 44.8 (17.9) 0.119
CD3CD4/CD3CD8 * 3.6 (3.1) 1.4 (0.9) 0.039
CD3TCRαβ * 97.3 (2.1) 91.9 (7.8) 0.028
CD3TCRγδ 3.8 (1.5) 6.3 (5.4) 0.217
002CD3CD45RA * 29.5 (23.4) 53.2 (17.9) 0.002
CD3CD45RO * 72.7 (21.7) 56.0 (21.0) 0.002
CD3HLA 19.9 (13.5) 18.6 (12.9) 0.837
CD3CD25 * * 24.6 (14.6) 30.9 (15.6) 0.048
CD3CD28 80.5 (23.9) 72.0 (11.6) 0.166
CD3CD80 2.0 (1.7) 0.7 (0.6) 0.055
CD3CD95 78.6 (16.3) 79.3 (13.6) 0.905
CD3CD95L 19.5 (21.9) 16.2 (22.1) 0.713
we observed a signiicant decrease in the percentage of CD4 T lymphocytes in the disease groups (p = 0.001). Despite the reduced percentage of CD4 lymphocytes in patients with cancer, the T cells of these patients coexpressed some activation markers, such as CD25 and CD80. In the tuberculosis group, CD95L and CD152 were increased in addition to these T-cell activation markers. Coexpression of T-cell activation markers suggests that these lymphocytes underwent the irst stages of antigen activation.
Determination of apoptosis
The apoptosis data are expressed as the percentage of positive mononuclear cells in the luid and blood of patients with tuberculosis or cancer and in the blood of control subjects. Apoptotic cells in the pleural fluid were only observed in 6 (20.0%) of the 30 patients studied (5 with tuberculosis: 5/14; 35.7%, and one with cancer: 1/16; 6.2%).
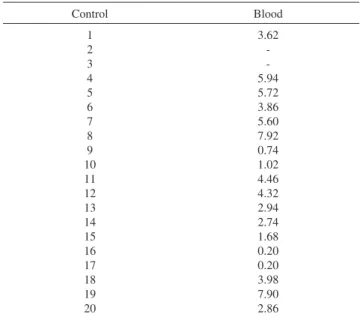
The percentage of apoptotic mononuclear cells ranged from 0.2 to 32.9% in the pleural luid and from 1.7 to 27.0% in the blood (Table 5); in the control group this percentage ranged from 0.2 to 7.9% (Table 6).
DISCUSSION
Tuberculosis and cancer are among the main causes of exudative pleural effusions. Although the effusions are predominantly lymphocytic in both cases, many studies have evaluated the subpopulations, activation state, and relationship with a peripheral blood cellular proile.3-5,18,19
Separate analysis of the pleural luid showed that only CD3 and CD14 cell subpopulations quantitatively differed between tuberculosis and cancer. CD3 cells predominate in tuberculosis, whereas CD14 cells are more highly expressed in cancer. It should be emphasized that the increase in CD14-positive mononuclear cells in neoplastic effusions Table 4 - Percentage (mean ± standard deviation) of leukocyte subpopulations in peripheral blood of patients with tuberculous and neoplastic pleural effusions as compared to the control group
Cells Malignant Tuberculous Control P
CD15 66.7 (8.2) 62.4 (8.1) 58.6 (13.9) 0.176
CD14 * 7.4 (2.2) 10.7 (3.0) 7.7 (3.4) 0.012 (2x1; 2x3)
CD14CD86 95.2 (10.6) 99.3 (0.5) 99.3 (0.5) 0.143
Lymphocytes 20.5 (7.1) 23.1 (6.8) 27.6 (9.6) 0.074
CD3 * 12.3 (5.1) 13.9 (4.6) 20.0 (9.4) 0.014 (3x1)
CD20 2.9 (2.3) 2.0 (1.1) 3.1 (1.6) 0.207
CD56 3.3 (1.7) 4.4 (2.5) 3.5 (1.6) 0.289
CD20HLA 99.1 (1.8) 99.8 (0.3) 99.8 (0.3) 0.411
CD20CD25 * 7.0 (6.3) 19.3 (18.6) 7.0 (2.9) 0.006 (2x1; 2x3)
CD20CD80 17.1 (30.4) 9.8 (9.1) 5.2 (4.6) 0.391
CD20CD86 * 15.2 (19.6) 22.4 (16.2) 8.5 (11.9) 0.004 (2x3)
CD3CD4 * 47.8 (13.4) 50.9 (14.0) 64.4 (8.0) 0.001 (3x1; 3x2)
CD3CD8 * 44.8 (17.8) 45.0 (13.7) 32.3 (7.3) 0.007 (2x3; 1x3)
CD3CD4/CD3CD8 * 1.4 (0.9) 1.3 (0.8) 2.1 (0.7) 0.008 (3x2; 3x1)
CD3TCRαβ 91.9 (7.8) 93.0 (5.4) 89.8 (19.1) 0.740
CD3TCRγδ * 6.3 (5.4) 8.4 (5.3) 4.7 (2.6) 0.049 (2x3)
002CD3CD45RA * 53.2 (17.9) 58.8 (11.8) 39.7 (11.9) 0.001 (2x3; 1x3)
CD3CD45RO 56.0 (21.0) 62.5 (10.3) 59.2 (13.7) 0.563
CD3HLA * 18.6 (12.9) 22.0 (10.0) 12.4 (6.0) 0.023 (2x3)
CD3CD25 * * 30.9 (15.6) 27.2 (8.5) 14.7 (4.9) 0.001 (1x3; 2x3)
CD3CD28 * 72.0 (11.6) 70.6 (2.5) 84.9 (7.7) 0.001 (3x2; 3x1)
CD3CD80 * 0.7 (0.6) 1.0 (0.9) 0.2 (0.2) 0.001 (2x3; 1x3)
CD3CD95 79.3 (13.6) 74.7 (16.5) 76.7 (9.6) 0.704
CD3CD95L * 16.2 (22.1) 50.9 (34.7) 13.2 (9.5) 0.005 (2x1; 2x3)
been previously reported and is probably related to the predominance of this cell type over CD8-positive T cells or to reductions in the latter that have been observed in tuberculosis.8,9,12,15-18,26-29
The number of CD3CD45RO cells (activated memory T cells) was higher in the pleural luid. This inding, together with the reduced CD3CD45RA population (naive T cells), suggests that this phenotype is related to the process of cell activation. No signiicant differences between luid and blood were observed for other markers (CD95L, CD152, or HLA-DR).
Despite the importance of apoptosis in pathological processes, few investigations have been conducted on pleural effusions. In our study, the blood and luid of only 6 (20%) patients showed elevated percentages of apoptotic cells when compared to the blood of healthy subjects. Most (83.3%) samples with an elevated percentage of apoptotic cells were tuberculous exudates. To investigate the possible association between cells undergoing apoptosis and speciic immunophenotypes, we evaluated the correlation of apoptosis with surface marker expression (CD14, CD3CD95, CD3CD95L, CD3CD28, CD3HLA-DR, CD3CD45RO, and CD3CD45RA), but no correlation could be established. However, cell apoptosis in these luids might be related to signaling pathways that involve other molecules, such as Bcl-2 and Bax, or to a deficiency in phagocytotic mechanisms30,31. Further studies of pleural effusions are necessary to understand the pathophysiological mechanisms responsible for increased apoptosis.
The increased percentage of CD3CD95L cells in the blood of patients with tuberculosis as compared to controls Table 5 - Percentage of BrdUTP-positive mononuclear cells
in pleural luid and peripheral blood of patients with tuber-culous (1–14) or neoplastic (15–30) pleural effusions
Patient Diagnosis Pleural luid Blood
1 2 3 4 5 6 7 8 9 10 11 12 13 14 15 16 17 18 19 20 21 22 23 24 25 26 27 28 29 30 Tuberculosis Malignant 30.27 32.88 0.93 0.57 0.47 0.70 30.25 1.26 0.64 0.70 29.86 1.30 20.64 0.32 1.10 0.83 0.36 0.74 0.92 3.05 0.62 0.53 0.70 0.76 0.76 0.23 0.62 1.91 23.58 0.73 26.66 1.75 ---6.45 ---15.27 ---1.89 ---8.06
---Table 6 - Percentage of BrdUTP-positive mononuclear cells in the peripheral blood of healthy blood donors (control)
Control Blood 1 2 3 4 5 6 7 8 9 10 11 12 13 14 15 16 17 18 19 20 3.62 -5.94 5.72 3.86 5.60 7.92 0.74 1.02 4.46 4.32 2.94 2.74 1.68 0.20 0.20 3.98 7.90 2.86
was not associated with any change in this cell population in the peripheral blood. Previously, Gjomarkaj et al.25 studied mononuclear cells (CD14) derived from neoplastic effusions and showed that these cells coexpress the HLA-DR antigen (activation marker), produce interleukin 1β and tumor necrosis factor α (TNF α), and stimulate the proliferation of allogenic T lymphocytes. These indings suggest that these cells are involved in the tumor-associated inlammatory reaction.
Although the percentage of apoptotic T lymphocytes appeared to be higher in tuberculosis, the statistical signiicance of this difference was marginal. This result might be explained by the size of the sample (30 cases); however, the number of antigens analyzed and the complexity of preparations also limited the analysis.
and patients with cancer might relect the host response to mycobacterial infection. These bacteria escape destruction by macrophages by preventing the fusion of phagosomes and lysosomes, thereby impairing the bactericidal action of lysosomal components.32,33 Organisms use multiple mechanisms to prevent mycobacterial infection, such as the activation of a Th1-type response. Once activated, these lymphocytes express Fas ligand (CD95L) on their membrane to eliminate a variety of cells, including macrophages, that express the Fas molecule (CD95), resulting in the destruction of cells infected with mycobacteria.31 Our finding of CD95L expression by lymphocytes might be related to this mechanism.
In the present study, we have evaluated various cellular apoptosis markers to characterize the cellular phenotypes of patients with tuberculous or neoplastic pleural effusions. In addition, we used the total cell content of the pleural luid in our evaluations. This approach minimizes
sample manipulation and reduces the loss of leukocyte subpopulations.
CONCLUSION
Tuberculous and malignant pleural effusions are enriched in lymphocytes with a helper/inducer T cell phenotype, which are mainly memory cells. CD14-positive cells were more prevalent in malignant effusions, while CD3-positive cells expressing Fas ligand were more prevalent in tuberculous effusions.
ACKNOWLEDGEMENTS
We would like to acknowledge support from the Foundation to Support Research of the State of São Paulo (FAPESP) and the National Council of Research (CNPq), Brazil.
REFERENCES
1. Kroegel C, Antony VB. Immunobiology of pleural inlammation: potencial implications for pathogenesis, diagnosis and therapy. Eur Respir J. 1997;10:2411-8.
2. Lucivero G, Pierucci G, Bonomo L. Lymphocyte subsets in peripheral blood and pleural luid. Eur Respir J. 1988;1:337-40.
3. Moisan T, Chandrasekhar AJ, Robinson J, McKenna J, Marti G. Distribution of lymphocyte subpopulations in patients with exudative pleural effusions. Am Rev of Respir Dis. 1978;117:507-11.
4. Domagala W, Emeson EE, Koss LG. T and B lymphocyte enumeration in the diagnosis of lymphocyte – rich pleural fluids. Acta Cytol. 1981;25:108-10.
5. Kochman S, Bernard J, Lavaud F, Cazabat A, Dubois DE, Montreynaud JM. T - lymphocyte subsets in pleural luids: discrimination according to traditional and monoclonal antibody- deined markers. Eur J Respir Dis. 1984;65:586-91.
6. Ghosh AK, Spriggs AI, Mason DY. Immunocytochemical staining of T and B lymphocytes in serous effusions. J Clin Pathol. 1985;38:608-12.
7. Ribera E, Ocaña I, Martinez-Vasquez JM, Rossell M, Espanol T, Ruibal A. High level of interferon gamma in tuberculosis pleural effusion. Chest. 1988;93:308-11.
8. Kapila K, Pande JN, Garg A, Verna K. T lymphocyte subsets and B lymphocytes in tuberculous pleural effusion. Indian J Chest Dis Allied Sci. 1987;28:90-3.
9. Barnes PF, Mistry SD, Cooper CL, Pirmez C, Rea TH, Modlin RL. Compartmentalization of CD4+ T lymphocyte sub-population in tuberculous pleuritis. J Immunol. 1989; 142:1114-9.
10. Khalil RY, Khalil MM. Flow cytometric study of T- cell subsets in lymphocytic pleural effusions. Cytometry. 1997;30:204-5
11. Dlugovitzky D, Rateni L, Torres- Morales A, Ruiz-Silva J, Pinesky R, Canosa B, Molteni O et al. Levels of interleukin-8 in tuberculous pleurisy and the proile of immunocompetent cells in pleural and peripheral compartments. Immunol Letters. 1997;55:35-9.
12. Faith A, Schellenberg DM, Rees AD, Mitchell DM. Antigenic speciicity and subset analysis of T cells isolated from the bronchoalveolar lavage and pleural effusion of patients with lung diseases. Clin Exp Immunol. 1992;87:272-8.
13. Albera C, Mabritto I, Ghio P, Scagliotti Gv, Pozzi E. Lymphocytes subpopulations analysis in pleural luid and peripheral blood in patients with lymphocytic pleural effusions. Respiration. 1991;58:65-71. 14. Guzman JS, Bross KJ, Costabel U. Malignant pleural effusions due to
small cell carcinoma of the lung. An immunocytochemical cell-surface analysis of lymphocytes and tumor cells. Acta Cytol. 1990;34:497-501.
15. Yoshino OM, Hazama S, Shimoda K, Suzuki T. The characterization of peritoneal and pleural exudate cells from malignant effusions. Surg Today. 1993;23:500-3.
16. Chen YM, Yang WK, Ting CC, Tsai WY, Yang DM, Whang-Peng et al. Cross regulation by IL-10 and IL-2/IL-12 of the helper T cell and the cytolytic activity of lymphocytes from malignant effusions of lung cancer patients. Chest. 1997,112:960-6.
17. Robinson E, Segal R, Vesely A, Mekori T. Lymphocyte subpopulation in peripheral blood and malignant effusions of cancer patients. Eur J Cancer Clin Oncol. 1986; 22:308-11.
19. Mantovani G, Macciò A, Versace R, Pisano M, Lai P, Esu S, Ghiani M, et al. Tumor-associated lymphocytes (TAL) are competent to produce higher levels of cytokines in neoplastic pleural and peritoneal effusions than those found in sera and are able to release into culture higher leves of IL-2 and IL-6 than those released by PBMC. J Mol Med. 1995;73:409-16.
20. Pellegrini M, Strasser A. A protrait of Bcl-2 protein family: Life, death, and the whole picture. J Clin Immunol. 1999:19:365-77.
21. Listman JA, Wang Y, Castro JE, Rimm I, Finn PW, Perkins DL. Detection of a rare apoptotic T cell in vivo. Cytometry. 1998;33:340-7. 22. Mitani K, NishiokaY, Yamabe K, Ogawa H, Miki T, Yanagawa H, et
al. Soluble fas in malignant pleural effusion and its expression in lung cancer. Cancer Sci. 2003;94:302-7.
23. Mollereau B, Blanchard D, Deas O, Dumont C, Metivier D, Bernard A, et al. Relationship between proliferation and suscepibility to CD95 and CD2 mediated apoptosis in stimulated primary T lymphocytes. T cell manifesting proliferative unresponsiveness are preferentially susceptible to CD95- mediated apoptosis. J Immunol. 1997;159:2668-77. 24. Light RW, MacGregor MI, Luchsinger PC, Ball WC. Pleural effusions:
the diagnostic separation of transudates and exudates. Ann Intern Med. 1972;77:507-13.
25. Giomarkaj M, Pace E, Melis M, Spatafora M, Toews GB. Mononuclear cells in exudative malignant pleural effusions. Characterization of pleural phagocytic cells. Chest. 1994;106:1042-9.
26. Shimokata K, Kishimoto H, Takagi E, Tsunekawa T. Detemination of the T cell subset producing Interferon in tuberculous pleural effusion. Microbiol Immunol. 1986;30:353-61.
27. Baganha MF, Pego A, Lima MA, Gaspar EV, Pharm B, Cordeiro AR. Serum and pleural adenosine deaminase. Correlation with lymphocytic populations. Chest. 1990; 97:605-10.
28. Pettersson T, Klockars M, Helstrom PE, Riska H, Wangel A. T and B lymphocytes in pleural effusions. Chest. 1978;73:49-51.
29. Ainslie GM, Solomon JA, Bateman ED. Lymphocyte and lymphocyte subset numbers in blood and in bronchoalveolar lavage and pleural luid in various forms of human pulmonary tuberculosis at presentation and during recovery. Thorax. 1992;47:513-8.
30. Savill J. Recognition and phagocitosis of cells undergoing apoptosis. Br Med Bul. 1997; 53:491-508.
31. Sikora J, Dworacki G, Giersz R, Zeromski J. The role of monocytes/ macrophages in TCR-zeta chain downregulation and apoptosis of T lymphocytes in malignant pleural effusions.J Biol Regul Homeost Agents. 2004;18:26-32.
32. Janeway CA, Travers P, Walport M, Capra JD. Immunobiology. In: The immune system in health and disease. 4th ed. London: Current Biology
Publications, 1999. p.301.