ABSTRACT: This study uses climate modeling (RegCM4 Climate Model) to provide a wind forecast average behavior at low levels, close to the surface. The model was used to generate an estimate of the average vertical wind proile lasting 5 months, from August to December 2015, attempting to observe intra-seasonal variations, with the presence of persistence in the wind ield. The results of climate modeling of the wind proile near the surface have the great potential for great operational signiicance during launch campaigns at the Centro de Lançamento de Alcântara. Three average results were generated for the month of November 2015, while operating in São Lourenço. A dynamical downscaling nested with global models with RCP4.5 and RCP8.5, using 3 different global conditions initialization datasets. It used subsets with the models from the Met Ofice Hadley Centre (HadGEM2-ES), the Centre National de Recherches Météorologiques (CNRM-CM5), and the Commonwealth Scientiic and Industrial Research Organization (CSIRO-Mk3.6), making a downscaling with the RegCM4 Climate Model for the Centro de Lançamento de Alcântara region. The results are preliminary but show great potential. Since the RegCM4 Climate Model can show variations of high and low intensity, its temporal frequency in the average vertical wind proile and the duration of temporal variation are of the order of 3 – 5 days. The RegCM4 Climate Model had better results with the one from the Met Ofice Hadley Centre, HadGEM2-ES, when it was qualitatively compared with observational data (ERA Interim Model) of the campaign period and reanalysis data.
KEYWORDS: Climate prediction, Centro de Lançamento de Alcântara, RegCM4 Climate Model.
Climate Forecasts at the Centro de
Lançamento de Alcântara Using the Climate
Model RegCM4
Cleber Souza Corrêa1, Gerson Luiz Camillo1, Vinicius Milanez Couto1, Gilberto Fisch1,
Felipe do Nascimento Correa1, Fabricio Harter2
INTRODUCTION
This preliminary study investigates the use of climate model RegCM4 in the generation of future estimates, average vertical wind proiles near the surface regions in the Centro de Lançamento de Alcântara (CLA) region. An estimate of the vertical proile of the average wind behavior in advance of a month or more, revealing features such as frequency and intensity of high wind that represents a very useful intra-seasonal weather scale which has direct strategic inluence in aerospace activities. he use of climate modeling allows temporal extrapolation and climate forecasting of meteorological variables that are of operational interest in the planning of aerospace activities. he importance for the climatological knowledge of Brazilian tropical region, where the CLA, Maranhão State, is located, is due to the inluence of meteorological phenomena in the assembly steps and launching of rockets and/or space vehicles, and includes such conditions as strong winds, precipitation and atmospheric electrical discharges (Marques and Fisch 2005).
he use of climatic modeling at the moment has a certain degree of development, as there are studies with other models such as the Brazilian the Regional Atmospheric Modeling (BRAMS), ETA model and Climate extension - Wheather Research and Forcasting (CWRF) for climatic purposes (Freire
et al. 2015; Chou et al. 2011; Lo et al. 2008; Nicolini et al. 2004).
he climatic modeling using the RegCM4 climate model is already well developed; at present, there are signiicant studies in South America, studies on the variability of the convection
1.Departamento de Ciência e Tecnologia Aeroespacial – Instituto de Aeronáutica e Espaço – Divisão de Ciências Atmosféricas – São José dos Campos/SP – Brazil.
2.Universidade Federal de Pelotas – Faculdade de Meteorologia – Pelotas/RS – Brazil.
process in Amazonia and northeastern Brazil (De Souza
et al. 2016) and climatic change on the South America on the
changes in rainfall variability (Da Rocha et al. 2012; Reboita et al. 2010); CMIP5 of valuation models that best express
the cyclonic vortices of activity at high levels (VCANS) in northeastern Brazil (Pinheiro et al. 2014) and other regions as
in Europe (Alexandri et al. 2015; Giorgi et al. 2012; Artale et al.
2010) and in Africa (Malavelle et al. 2011; Konaréet al. 2008).
Research has the strategy of using the RegCM4 climate model in this study aims to investigate and to provide ine scale regional information in the Brazilian Northeast, prospecting statistics and intensity of climatological information for the use of average values that characterize the period, that it is a dry season for the Brazilian northeast. he application of the RegCM4 model would assist in aerospace planning activities performed by the Departamento de Ciência e Tecnologia Aeroespacial (DCTA). he validation of this application of the RegCM model would enable a better understanding of the prevailing structures of atmospheric circulation at low levels and measuring the ability of RegCM4 model to represent the main features of the vertical wind proile for the CLA region.
METHODOLOGY
PHYSICAL AND DYNAMIC ASPECTS: ATMOSPHERIC CIRCULATION OVER AND NEIGHBORING THE REGION OF STUDY
he dynamic structure of the atmospheric circulation in Brazil’s tropical region is directly linked to atmospheric processes and on the oceanic processes, speciically those that occur in Paciic and Atlantic Oceans. his structure can be described in two important mechanisms of planetary level: Hadley and Walker circulations (Walker and Bliss 1932; Moura and Shukla 1981; Johanson and Fu 2009).
According to Molion and Bernardo (2000), the tropical convection is essentially controlled — enhanced or inhibited — by the general circulation of the atmosphere, through the global scale phenomena, resulting from the complex interaction between the planet’s surface and the atmosphere. Physical characteristics that particularly afect tropical convection are the distribution of continents and oceans, unequal power balance in the atmosphere, the diferent topographies and the various types of vegetation.
Ferreira and Melo (2005) showed that the atmospheric circulation over the tropical region is strongly modulated and modiied by thermodynamic patterns in the basins of the
Paciic and Tropical Atlantic. hus, in years in which there are anomalies, positive or negative, of the sea surface temperature (SST) in the basins of these oceans, the cell of Hadley, which operates in southern direction (ascending limb of the tropics and branches descendants in latitudes subtropical), and the cell of Walker, that works in the zonal direction (ascending branch in the western Paciic and descending branch in the eastern Paciic), are disturbed, causing strong anomalies in atmospheric circulation over the tropics. As a result, these cells are displaced from their climatological positions.
Although episodes of the El Niño-Southern Oscillation
(ENSO), the Walker Cell, weaken, in a situation with circulation changes, result in the generation of an anomalous Hadley Cell circulation in the Paciic Ocean east, with upward movement within the tropics and downward movements in the upper troposphere, toward the poles (middle and high latitudes), with a return on such movements to the tropics in the lower troposphere. During these anomalies when atmospheric circulation year are set with
El Niño (warm phase of ENSO), which represent the abnormal
warming of the surface and sub-surface Equatorial Paciic Ocean. In South America, northern and northeastern Brazil, due to these changes in the Paciic Walker Cell, in El Niño years it is observed
precipitation patterns with values below the climatological normal (Souza et al. 2009). Years with strong El Niño are extremely dry,
as occurred in 2010 in the Brazilian Amazon.
In this deinition, it is considered not only the presence of warm water in the Paciic the Corriente El Niño, but also
changes in the atmosphere near to the ocean surface, with the weakening of the trade winds (which blow from east to west) in the region equatorial.
the sea are found to be bigger than average. Furthermore, the warmer water will be impounded more westerly than normaling greater evaporation, extending the upward movements, which in turn generate rain clouds, characterizing the Cell of Walker. he region with the larger amount of rainfall is the northeastern Indian Ocean, west of the Paciic Ocean through the Indonesia and the region with downward movements of the cell of Walker, occurs in the central and eastern Equatorial Paciic. Importantly, such downward movements of the cell of Walker in the Eastern Equatorial Paciic become more intense than usual, which inhibits the formation of rain clouds.
La Niña years, in South America and, more speciically, the
northern region of Brazil, due to changes in the Walker Cell, present rainfall patterns with values above the climatological normal. Years with strong La Niña are extremely wet years in
the northern region, as was observed during late 2011 and early 2012 in the Brazilian Amazon.
Wang (2002a,b) showed diferences in the intensity and location of Walker and Hadley cells over the Paciic Ocean Tropical associated with the ENSO phenomenon in conjunction with the occurrence of the two main modes of thermal variability of sea surface temperature (SST) in the Tropical Atlantic Ocean (south gradient (north-south) and Equatorial (west-east)).
Vimont (2005) provided a plausible physical explanation for the spatial structure of decadal variability associated with ENSO, presenting on average the existence of long intercycle variations in the variability of ENSO, indicating the existence of outstanding features in spatial variations in decades with ENSO. Its spatial variations are generated through the physical mechanisms that operate during the interannual ENSO cycle. Its indings provide an important framework for interpreting the modeling decadal variability associated with ENSO. In an analysis of the efect of the Hadley cell in South America, one can verify the existence of positive or negative anomalies in SST gradient in the Atlantic basin in the southern direction.
Nobre and Molion (1986) provides an explanation for the behavior of the Inter-Tropical Convergence Zone (ITCZ) associated with variations of SST in the Atlantic.
The position of the ITCZ and the circulation of the North Atlantic subtropical anticyclone influence the trade winds of northeast of the Brazil. The movement of ITCZ has intensified the northeast trade winds. When the North Atlantic waters are colder than normal, the subtropical North Atlantic anticyclone and the northeast trade winds intensify. If in this same period the South Atlantic is warmer
than usual, the South Atlantic subtropical anticyclone and the trade winds weaken southeast.
This pattern favors the shift of the ITCZ to positions further south of the Equator and is conducive to the occurrence of normal years, rainy or very rainy for the northern sector of the Northeast of Brazil.
When the South Atlantic waters are cooler than normal, the South Atlantic subtropical anticyclone and the trade winds from southeast intensify. If in this same period the waters in the North Atlantic are warmer than normal, the subtropical North Atlantic anticyclone and the northeast trade winds are weaken (Nobre and Shukla 1996; De Souza and Nobre 1998; Andreoli and Kayano 2007; Alves et al. 2012). his pattern favors the shit
of the ITCZ to the northernmost position of the Equator and is contributory to the occurrence of dry or very dry years in the northern part of Northeast Brazil. As a result, monitoring of oceanic and atmospheric patterns during the rainy season is of fundamental importance for the weather and climate forecasts to be generated with the highest possible degree of reliability. he interaction between the Walker and Hadley cells over the tropical Pacific associated with ENSO and jointly the occurrence of the two main thermal variability modes of the Tropical Atlantic Ocean (the southern and equatorial gradient of SST) create complex behaviors dynamics on the north and the Brazilian northeast. Besides, the existence of a breeze of wind ield afects the CLA region. he use of climatic modeling to simulate the dynamics of the predominant circulation of the Alcântara region, it will be important to test the RegCM4 model will have the ability to represent this dynamic atmospheric condition.
system models under an experimental design that allows both types of models to be compared to observations on an equal footing. Besides the long-term experiments, CMIP5 calls for an entirely new suite of near-term simulations focusing on recent decades and the close future to the year 2035. hese “decadal predictions” are initialized based on observations and will be used to explore the predictability of climate and to assess the forecast system’s predictive skill. he CMIP5 experiment design also allows for the participation of stand-alone atmospheric models and includes a variety of idealized experiments that will improve understanding of the range of model responses found in the more complex and realistic simulations (Taylor
et al. 2012). here were used in this study the scenarios of
the IPCC/CMIP5, Representative Concentration Pathways (RCP) from the current concentration of CO2, and the two projections of Emissions of Greenhouse Gases (EGG) used were RCP4.5 and RCP8.5. he RCP4.5 presents a trajectory of increasing atmospheric CO2 concentration to 520 ppm (parts per million) in 2070, increasing more slowly by the end of the 21st century. he RCP8.5 shows a similar growth
trajectory till the middle of the century, followed by a rapid and sharp increase, reaching a CO2 concentration of 950 ppm at the end of the century.
herefore, in this study, the Model RegCM4 with using the following data from the subset CMIP5, described below. he information concerning of the CMIP5 multi-model dataset can be seen in Table 1.
Dataset from 3 global models to perform simulations were obtained on the following internet site: http://clima-dods.ictp. it/data/Data/RegCM_Data. Each global model is a set of iles with simulations, historical data and initialization parameters. he HadGEM2 model, for example, is a 2-stage development from HadGEM1, representing improvements in the physical model and the addition of earth system components and coupling. he HadGEM2 project targeted two key features of physical performance: ENSO and northern continent
land-surface temperature biases. he latter had a particularly high priority in order for the model to be able to adequately model continental vegetation. hrough focused working groups, it was identiied a number of mechanisms that improved the performance. Some known systematic errors in HadGEM1, such as the Indian monsoon, were not targeted for attention in HadGEM2, which has substantially improved mean SSTs and wind stress and improved tropical SST variability compared to HadGEM1. he northern continental warm bias in HadGEM1 has been signiicantly reduced. he power spectrum of El Niño is made worse, but other aspects of ENSO
are improved. Overall, there is a noticeable improvement from HadGEM1 to HadGEM2 when comparing global climate indices, putting HadGEM2 in a leading position compared to the CMIP3 models. he HadGEM2 model has a publication describing the methodology used and the model structure (Collins et al. 2008).
The CNRM-CM5 model is described in Voldoire et al.
2011. The CNRM-CM5 includes the atmospheric model ARPEGE-Climat (v5.2), the ocean model NEMO (v3.2), the land surface scheme ISBA and the sea ice model GELATO (v5) coupled through the OASIS (v3) system. The main improvements since CMIP3 are the following. The horizontal resolution has been increased both in the atmosphere (from 2.8º to 1.4º) and in the ocean (from 2º to 1º). The dynamical core of the atmospheric component has been revised. A new radiation scheme has been introduced and the treatments of tropospheric and stratospheric aerosols have been improved. Particular attention has been devoted to ensuring mass/ water conservation in the atmospheric component. The land surface scheme ISBA has been externalized from the atmospheric model through the SURFEX platform and includes new developments such as a parameterization of sub-grid hydrology, a new freezing scheme, and a new bulk parameterization for ocean surface fluxes. The ocean model is based on the state-of-the-art version of NEMO, which
Modeling center Model Resolution Institution
CNRM-CERFACS CNRM-CM5 1.5° × 1.5° Centre National de Recherches Météorologiques/Centre Européen de Recherche et de Formation Avancée en Calcul Scientiique
CSIRO-QCCCE CSIRO-Mk3.6 1.8° × 1.8° Commonwealth Scientiic and Industrial Research Organization in collaboration with the Queensland Climate Change Centre of Excellence
MOHC HadGEM2-ES 1.8° × 1.2° Met Oice Hadley Centre (additional HadGEM2-ES realizations with contribution of the Instituto Nacional de Pesquisas Espaciais (INPE)
has greatly progressed since the OPA8.0 version used in the CMIP3 version of CNRM-CM.
The CSIRO-Mk3.6 model is described by the following references for publication: Rotstayn et al. 2012 and Jeffrey et al. 2013. This global climate model (GCM) was developed
from the earlier Mk3.5 version, which was described in detail by Gordon et al. (2002; 2010). It is a coupled
atmosphere-ocean model with dynamic sea-ice. It also has a soil-canopy scheme with prescribed vegetation properties. The ocean, sea-ice and soil-canopy models are unchanged between Mk3.5 and Mk3.6. The main differences between Mk3.5 and Mk3.6 are the inclusion of an interactive aerosol treatment and an updated radiation scheme in Mk3.6. Rotstayn et al. (2010) gave an overview of Mk3.6,
and also assessed the model’s simulation of Australian mean climate and natural rainfall variability associated with ENSO, with generally favorable conclusions. The atmospheric component is a spectral model, which utilizes the flux form of the dynamical equations (Gordon 1981). It has eighteen vertical levels and horizontal resolution of approximately 1.875° × 1.875° (spectral T63). The ocean model is based on version 2.2 of the Modular Ocean Model (MOM2.2) (Pacanowski 1996). Every atmospheric grid-box is coupled to 2 oceanic grid-boxes: enhanced north-south resolution in the ocean model was implemented with the aim of improving the representation of tropical variability. The ocean model thus has a resolution of approximately 1.875° × 0.9375° and has 31 vertical levels. The sea-ice model is based on O’Farrell (1998), with revised numerics as described by Gordon et al. (2010).
The data reanalysis obtained from the ERA Interim Model was used for comparison of RegCM4 model and is available on the site http://apps.ecmwf.int/datasets/data/ interim-full-daily/levtype=sfc/, on The European Centre For Medium-Range Weather Forecasts (ECMWF). The system includes a 4-dimensional variational analysis (4D-Var) with a 12-hour analysis window. It shows global atmospheric and surface parameters from 1 January 1979 to present, at T255 spectral resolution (~ 80 km) on 60 vertical levels, 6-hourly atmospheric fields on model levels, pressure levels, potential temperature and potential vorticity, 3-hourly surface fields and daily vertical integrals and Synoptic monthly averages at 0 UTC; 6 UTC; 12 UTC; 18 UTC. The detailed documentation of the parameters in this dataset is presented in Berrisford
et al. (2011).
MODEL REGCM4: A REGIONAL CLIMATE MODEL SYSTEM
The Regional Climate Model System (RegCM4), originally developed at the National Center for Atmospheric Research (NCAR), is maintained in the Earth System Physics (ESP) section of the International Center for Theoretical Physics (ICTP). The latest version of model, RegCM4, is now fully supported by the ESP (http://gforge.ictp.it/gf/project/ regcm/). This model can be applied to any region of the world, with a grid spacing of up to about 10 km (hydrostatic limit), and, for a wide range of studies, from process studies to paleoclimate and future climate simulation. This RegCM4 version include major upgrades in the structure of the code and its pre- and post-processors, along with the inclusion of some new physics parameterizations and upgrades of some physics schemes (convection, planetary boundary layer (PBL), and cloud microphysics) and uses Common Land Model (CLM) surface schemes (Giorgi et al.
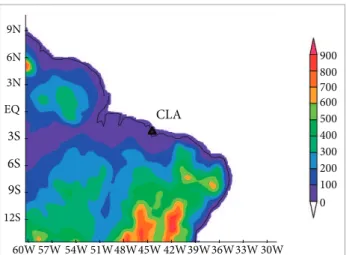
2015). The RegCM4 was configured with a single grid with 80 × 100 points (Fig. 1), with a low resolution of 50 km and 23 vertical levels, with Normal Mercator projection, with the grid center focused on the CLA region.
900
400 500 600 700 800
300
0 100 200
9N
3N 6N
EQ
3S
6S
9S
12S
CLA
60W57W54W51W48W45W42W39W36W33W30W
Figure 1. D omain (80 × 100 points) applied to generate the simulations centered on the region of the Centro de Lançamento de Alcântara, with data from the topographic surface, in meters, used by the RegCM4 model.
(CCI) project of the ESA Programme on Global Monitoring of Essential Climate Variables. he modeling physical parameters were set with the parameters which can be seen in Table 2. he physicsparam namelist controls, the best way to select the physical model is to follow the methodology described in the reference manual RegCM4 (Giorgi et al. 2011). Some
RegCM4 parameters settings have been made diferent from the default, these diferences are shown in Table 2. he nesting using the FNEST option in coreparam namelist in RegCM4 model, is supported in this coniguration, hydrostatic nested into hydrostatic. he RegCM4 was conigured to run a single grid with a spatial resolution of 50 km, the CMIP5 models used have a approximate resolution of 150 to 200 km.
can be further divided into 17 different plant functional types. Hydrological and energetical balance equations are solved for each land cover type and aggregated back to the gridcell level. Since CLM was developed for the global scale, several input iles and processes were modiied to make it more appropriate for regional simulations, including the use of high-resolution input data, soil moisture initialization, and an improved treatment of grid cells along coastlines. For the model input data, CLM requires several time-invariant surface input parameters: soil color, soil texture, percent cover of each land surface type, leaf and stem area indices, maximum saturation fraction, and land fraction (Lawrence and Chase 2007). he CLM model has better performance than the Biosphere-Atmosphere Transfer scheme (BATS) model and the CLM model was chosen to use in this simulation. he RegCM4 model was installed on an Intel machine with XEON E5649 CPU, 36 GB of RAM in an environment with Linux Ubuntu 14.04, and the model was compiled with G-Fortran. he code uses MPI2 library (OpenMPI) and it was conigured to use 24 threads to permit use the parallelism of underline processor. In the simulation, it was discarded two initial months, July and August, using the period September-November 2015 period for the study. For the post-processing of the result, it was used GrADS sotware for generation of the average wind vertical proile over the CLA area. By using the scripts the average.sh and dailymean.sh functions of the model postprocessing, the RegCM output data in netCDF were treated and generated the igures on GrADS format.
STATISTICS INFORMATION
It was used to statistical analysis calculate the mean and standard deviation of the time series of the months from September to November 2015, and it was also estimated the Mean Squared Error. Between the median values generated by RegCM4 model and data from anemometers of micrometeorological tower at four levels (70, 43, 28.5, and 11.78 m) at the launch area the CLA:
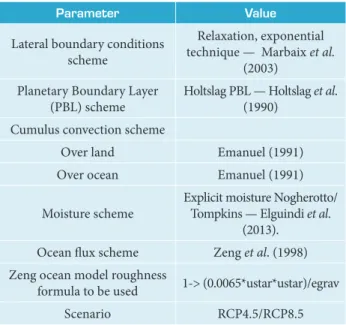
Parameter Value
Lateral boundary conditions scheme
Relaxation, exponential technique — Marbaix et al.
(2003)
Planetary Boundary Layer (PBL) scheme
Holtslag PBL — Holtslag et al. (1990)
Cumulus convection scheme
Over land Emanuel (1991)
Over ocean Emanuel (1991)
Moisture scheme
Explicit moisture Nogherotto/ Tompkins — Elguindi et al.
(2013).
Ocean lux scheme Zeng et al. (1998)
Zeng ocean model roughness
formula to be used 1-> (0.0065*ustar*ustar)/egrav
Scenario RCP4.5/RCP8.5
Table 2. Parameters used in Physics parameters namelist in RegCM4 model.
THE COMMUNITY LAND MODEL
he Community Land Model (CLM) (Oleson et al. 2008)
is the land surface model developed by the National Center of Atmospheric Research (NCAR) as part of the Community Climate System Model (CCSM), described in detail in Collins
et al. (2006). CLM contains 5 possible snow layers with an
additional representation of trace snow and 10 unevenly spaced soil layers with explicit solutions of temperature, liquid water and ice water in each layer. To account for land surface complexity within a climate model grid cell, CLM uses a tile or mosaic approach to capture surface heterogeneity. Each CLM grid cell contains up to 4 diferent land cover types (glacier, wetland, lake, and vegetated), where the vegetated fraction
where: X
M is the result of RegCM model at level z = 995 hPa
with median wind for model integration; X
O is the mean
value observed in each level, in similar hours; N (N = 360) is
he Root Mean Squared Error (RMSE) is an estimate of the magnitude of bias between the model and the observed data for the period analyzed. Equation 2 is used:
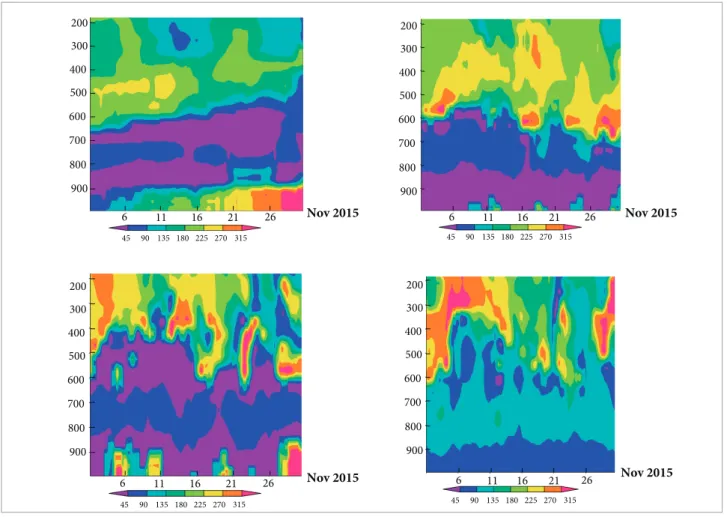
Figures 2 and three present the images generated by the 3 global models used to initialize the RegCM4 model. he best qualitative result was generated for the HadGEM2 model, an intermediate result was the CNRM-CM and the CSIRO-Mk3.6. Compared to the observational results of the same period with Era Interim Model (part 4A in Fig. 2 and part 4B in Fig. 3). he HadGEM2 model presented a temporal timing of maxima and minima of the average vertical wind proile for the month of November 2015, consistent with the dynamics of the observed circulation (part 3A in Fig. 2 and part 3B in Fig. 3). hese periods with maxima and minima in the wind proile have a frequency of every 3 to 5 days. his situation indicates the possibility that the convective processes that occur over the ocean have lower luctuations frequency than a week.
An interesting aspect that can be observed in the figures generated by the average vertical profile of the wind directions from the RegCM4 model is its change associated with wind
RESULTS
Model RegCM4 was set to the tropical Atlantic coast region northeast of Brazil with good performance for the location of the CLA, which is in an area on the coast and where the prevailing atmospheric circulation is the ocean to the continent, and could represent the dynamics of predominant circulating in the dry the season for the region analyzed.
(2)
200
400 300
500
600
700
800
900
200
400 300
500
600
700
800
900
200
400 300
500
600
700
800
900
45 90 135 180 225 270 315 45 90 135 180 225 270 315
45 90 135 180 225 270 315 45 90 135 180 225 270 315
200
400 300
500
600
700
800
900
6 11 16 21 26
6 11 16 21 26
6 11 16 21 26
6 11 16 21 26
Nov 2015
Nov 2015
Nov 2015
Nov 2015
200
400 300
500
600
700
800
900
200
400 300
500
600
700
800
900
200
400 300
500
600
700
800
900
2 4 8 10 12 14 18
200
400 300
500
600
700
800
900
6 11 16 21 26 Nov 2015
20 22 24 28 30
2 4 8 10 12 14 18
6 11 16 21 26 Nov 2015
20 22 24 28 30
6 11 16 21 26 Nov 2015
6 11 16 21 26
1 Nov 2015
2 4 810 121418 20 22 24 28 30
2 4 8 10 12 14 18 20 22 24 28 30
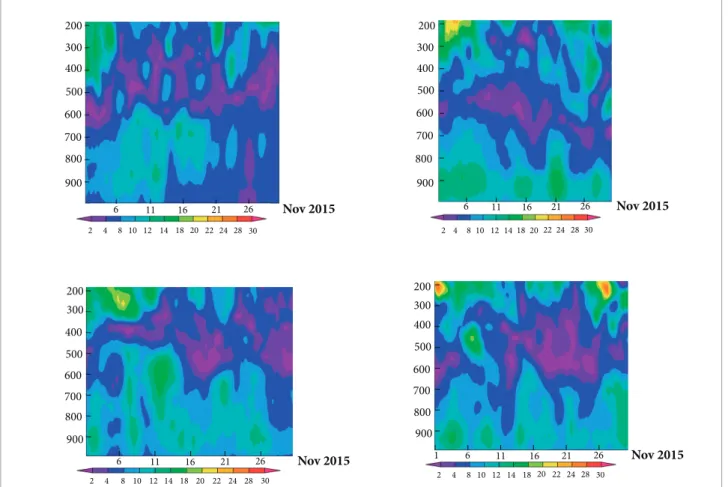
Figure 3. Results of the RegCM4 model with the RCP4.5 scenario, with the average of the vertical wind velocity proile (CNRM-CM5-1B, CSIRO-Mk3.6.0-2B, and HadGEM2-ES-3B models) for the month of November 2015, and the average vertical wind proile of ERA Interim Model for the same period (4B).
speed. When the wind is weaker, the predominant direction is from north/northwest, but when it is intense, it comes from northeast, whose direction is climatologically prevalent. This behavior is observed in the lower levels near the surface. The preliminary indications of wind direction median profiles, near the surface, suggest that the RegCM4 model has a certain north bias, meridionally, in future studies that possibility and its estimation will be investigated. The wind direction profile showed more complexity and the RegCM4 model is not represented as well relative to the intensity of the wind. he vertical Y axis of the images in Figures 2 and 3 are in
pressure levels, the RegCM4 model defaults on 23 levels, the level 23 near the surface corresponds to the level of 995 hPa and the level 1 value of 25 hPa in height top of the model. he igures were generated in the geographical position of the CLA and their variation in time, for the month of November 2015. The simulations generated by RegCM4 with RCP8.5 scenarios originated outcomes associated with wind profile,
with magnitudes higher, well above the climatological reality in 3 different conditions of global initializations. In view of that, the simulations with RCP8.5 scenarios were discarded. The result obtained in RCP8.5 scenario was very sensitive to the initialization conditions, which are more intense and shows the effects of higher concentrations of greenhouse gases.
he results in Table 3 are interesting because the estimate generated by RegCM model in the period from September to November 2015 shows that the average wind velocity during this period was an estimate of the order of magnitude of the value of the average observation.
a very interesting application for the use of climatic modeling when applied in simulations that attempt to recognize prevailing characteristics of atmospheric circulation, for time intervals of 3 to 6 months. he months from October to November are ideal for the rocket launch operation in northeastern Brazil. his guide the choice of the months for generate up the study in more detail.
This methodology will use, through global reanalysis initializations, more detailed regional climatic parameters in the region of interest in CLA, allowing to obtain climatological results of past periods and the use of IPCC scenarios studies to quantify possible influences in wind strength, with the changes observed in the increase of the greenhouse effect.
he RegCM4 model can be used with diferent physical parameterizations and also generate grids with higher spatial resolution and can use the non-hydrostatic coniguration of order 10 km or lower. his irst test was signiicant as it showed a great potential for use, but it can be made further advances and improvements to future research. his paper shows a possible application scenarios generated by the IPCC/CMIP5 and productions of bias estimates for the study region to provide ine-scale regional information in the Brazilian Northeast.
AUTHOR’S CONTRIBUTION
All the authors contributed equally in the coniguration and modeling of the RegCM4 model.
ACKNOWLEDGEMENTS
he authors thank the support of the Instituto de Aeronáutica e Espaço.
Table 3. Statistical information calculated from the average values of RegCM model (RCP4.5 scenario with the HadGEM-ES model) and average data of wind velocity at anemometer tower in Centro de Lançamento de Alcântara, in the period from September to November 2015.
RegCM model level
995 hPa
Wind average
velocity (m/s)
Anemometer tower
70 (m)
43 (m)
28.5 (m)
16.3 (m)
Mean 7.44 9.00 7.78 7.25 6.50
Standard
deviation 2.98 2.18 2.00 1.84 1.64
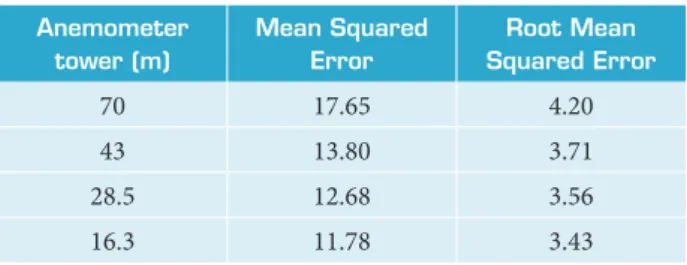
Table 4. Mean Squared Error and Root Mean Squared Error results in the period from September to November 2015, between the RegCM model (RCP4.5 scenario with the HadGEM-ES model) and the observed data in the anemometer tower in Centro de Lançamento de Alcântara.
Anemometer tower (m)
Mean Squared Error
Root Mean Squared Error
70 17.65 4.20
43 13.80 3.71
28.5 12.68 3.56
16.3 11.78 3.43
DISCUSSION
Preliminary results are encouraging for the use of climatic modeling for prospect dynamics characteristics and persistence in atmospheric circulation features, as well as the wind direction, velocity and frequency, and persistence with maxima and minima, which has a great operational role in the release of activities in the CLA region, provide ine-scale regional information. he RCP4.5 scenarios (IPCC/CMIP5) can have
REFERENCES
Alexandri G, Georgoulias AK, Zanis P, Katragkou E, Tsikerdekis A, Kourtidis K, Meleti C (2015) On the ability of RegCM4 regional climate model to simulate surface solar radiation patterns over Europe: an assessment using satellite-based observations. Atmos Chem Phys 15:13195-13216. doi:10.5194/acp-15-13195-2015
Alves JMB, SouzaI EB, Costa AA, Martins ESPR, Silva EM (2012) Sobre o sinal de um downscaling dinâmico às oscilações intrassazonais de precipitação no setor norte do Nordeste do Brasil. Rev Bras Meteorol 27(2):219-228. doi: 10.1590/S0102-77862012000200008
Andreoli RV, Kayano MT (2007) A importância relativa do atlântico tropical sul e pacífico leste na variabilidade de precipitação do Nordeste do Brasil. Rev Bras Meteorol 22(1):63-74.
Artale V, Calmanti S, Carillo A, Dell’Aquilla A (2010) An atmosphere– ocean regional climate model for the Mediterranean area: assessment of a present climate simulation. Climate Dynamics 35:721-740.
Collins WD, Bitz CM, Blackmon ML, Bonan GB, Bretherton CS, Carton JA, Chang P, Doney SC, Hack JJ, Henderson TB, Kiehl JT, Large WG, McKenna DS, Santer BD, Smith RD (2006) The Community Climate System Model version 3 (CCSM3). Journal of Climate 19:2122-2143.
Collins WJ, Bellouin N, Doutriaux-Boucher M, Gedney N, Hinton T, Jones CD, Liddicoat S, Martin G, O’Connor F, Rae J, Senior C, Totterdell I, Woodward S, Reichler T, Kim J (2008) Hadley Centre technical note 74. Met Office Hadley Centre, Exter, UK; [accessed 2016 Nov 26]. http://www.metoffice.gov.uk/media/pdf/8/7/ HCTN_74.pdf
Chou SC, Marengo JA, Lyra A, Sueiro G, Pesquero J, Alves LM, Kay G, Betts R, Chagas D, Gomes JL, Bustamante J, Tavares P (2011) Downscaling of South America present climate driven by 4-member hadCM3 runs. Climate Dynamics. doi: 10.1007/ s00382-011-1002-8
Da Rocha RP, Cuadra SV, Reboita MS, Kruger LF, Ambrizzi T, Krusche N (2012) Effects of RegCM3 parameterizations on simulated rainy season over South America. Climate Research 52:253-265.
De Souza EB, Nobre P (1998) Uma revisão sobre o padrão de dipolo no Atlântico Tropical. Rev Bras Meteorol 13(3):1-44.
De Souza EB, Carmo AMC, Moraes BC, Nacif A, Ferreira DBS, Rocha EJP, Souza PJOP (2016) Sazonalidade da precipitação sobre a Amazônia Legal Brasileira: clima atual e projeções futuras usando o modelo RegCM4. Revista Brasileira de Climatologia 18. doi: 10.5380/abclima.v18i0.43711
Elguindi N, Bi X, Giorgi F, Nagarajan B, Pal J, Solmon F, Giuliani G (2013) Regional Climate Model RegCM user’s manual version 4.4. Trieste: The Abdus Salam International Centre for Theoretical Physics.
Emanuel KA (1991) A scheme for representing cumulus convection in large-scale models. J Atmos Sci 48:2313-2329. doi: 10.1175/1520-0469(1991)048<2313:ASFRCC>2.0.CO;2
Freire JLM, Freitas SR, Coelho CAS (2015) Calibração do modelo regional BRAMS para a previsão de eventos climáticos extremos. Rev Bras Meteorol 30:158-170.
Ferreira AG, Mello NGS (2005) Principais sistemas atmosféricos atuantes sobre a Região Nordeste do Brasil e a influência dos oceanos Pacífico e Atlântico no clima da região. Revista Brasileira de Climatologia 1(1):15-28.
Giorgi F, Copola E, Solmon F (2012) RegCM4: model description and preliminary tests over multiple CORDEX domains. Climate Research 52:7-29.
Giorgi F, Elguindi N, Cozzini S, Giuliani G (2011) Regional Climatic Model RegCM user’s manual version 4.2. Trieste: International Centre for Theoretical Physics.
Giorgi F, Elguindi N, Cozzini S, Solmon F (2015) Regional Climatic Model RegCM User’s Guide Version 4.4..
Gordon HB (1981) A flux formulation of the spectral atmospheric equations suitable for use in long-term climate modeling. Mon Weather Rev 109:56-64.
Gordon HB, Rotstayn LD, McGregor JL, Dix MR, Kowalczyk EA, O’Farrell SP, Waterman LJ, Hirst AC, Wilson SG, Collier MA, Watterson IG, Elliott TI (2002) The CSIRO-Mk3 Climate System Model. Technical Paper No. 60. CSIRO Atmospheric Research;
[accessed 2016 Nov 26]. http://www.cmar.csiro.au/e-print/ open/gordon_2002a.pdf
Gordon HB, O’Farrell SP, Collier MA, Dix MR, Rotstayn LD, Kowalczyk EA, Hirst AC, Watterson IG (2010) The CSIRO-Mk3.5 Climate Model. Technical Report No. 21. Centre for Australian Weather and Climate Research; [accessed 2016 Mar 16]. http://www.cawcr.gov.au/technical-reports/CTR_021.pdf
Holtslag AAM, De Bruijn EIF, Pan H-L (1990) A high resolution air mass transformation model for short-range weather forecasting. Mon Wea Rev 118:1561-1575. doi: 10.1175/1520-0493(1990)118<1561:AHRAMT>2.0.CO;2
Jeffrey S, Rotstayn L, Collier M, Dravitzki S, Hamalainen C, Moeseneder C, Wong K, Syktus J (2013) Australia’s CMIP5 submission using the CSIRO Mk3.6 model. Australian Meteorological and Oceanographic Journal 63:1-13.
Johanson CM, Fu Q (2009) Hadley cell widening: model simulations versus observations. Journal of Climate 22:2713-2725.
Konaré A, Zakey AS, Solmon F, Giorgi F, Rauscher S, Ibrah S, Bi X (2008) A regional climate modelling study of the effect of desert dust on the West African monsoon, J Geophys Res 113:D12206. doi: 10.1029/2007JD009322
Lawrence P, Chase T (2007) Representing a new MODIS consistent land surface in the Community Land Model (CLM3.0). J Geophys Res 112:g01023.
Lo JCF, Yang ZL, Pielke RA (2008) Assessment of three dynamical climate downscaling methods using the Weather Research and Forecasting (WRF) model. J Geophys Res 113:D09112. doi: 10.1029/2007JD009216
Malavelle F, Pont V, Mallet M, Solmon F, Johnson B, Leon JF, Liosse C (2011) Simulation of aerosol radiative effects over West Africa during DABEX and AMMA SOP-0. J Geophys Res 116:D08205. doi: 10.1029/ 2010JD014829
Marbaix P, Gallee H, Brasseur O, van Ypersele JP (2003) Lateral boundary conditions in regional climate models: a detailed study of the relaxation procedure. Mon Wea Rev 131:461-479.
Marques RFC, Fisch GF (2005) As atividades de Meteorologia Aeroespacial no Centro Técnico Aeroespacial (CTA). Boletim da Sociedade Brasileira de Meteorologia 29(3):21-25.
Molion LCB, Bernardo SO (2000) Dinâmica das chuvas no Nordeste Brasileiro. Proceedings of the 11th Congresso Brasileiro de Meteorologia; Rio de Janeiro, Brazil.
Moura AD, Shukla J (1981) On the dynamics of droughts in northeast Brazil: observations, theory and numerical experiments with a general circulation model. Journal of the Atmospheric Science 38(12):2653-2675.
Nobre CA, Molion LCB (1986) Climanálise Especial. Edição Comemorativa de 10 anos. Cachoeira Paulista: CPTEC/INPE.
Nobre P, Shukla J (1996) Variations of sea surface temperature, wind stress, and rainfall over the tropical Atlantic and South America. J Climate 9(10):2464-2479. doi: 10.1175/1520-0442 (1996)009<2464:VOSSTW>2.0.CO;2
Predictability Programme (Special Issue Featuring SALLJEX). Nº 29, Vol. 9, Nº 1, 6-8 y 16; [accessed 2016 Nov 28]. http://www.clivar. org/publications/exchanges
O’Farrell SP (1998) Investigation of the dynamic sea-ice component of a coupled atmosphere-sea-ice general circulation model. J Geophys Res 103:15751-15782.