Global stability analysis of reinforced concrete
buildings using the
γ
z
coeicient
Análise da estabilidade global de edifícios de concreto
armado utilizando o coeiciente
γ
z
Abstract
Resumo
Global stability analysis is becoming increasingly important in the design of reinforced concrete buildings, especially in the slender ones, due its sensitivity to lateral displacement. The loss of stability is usually associated with the intensity of the second order effects and, in that sense, the gamma-z (γz) coeficient is an important evaluation parameter for this problem. This work aims to verify the γz eficiency as a global stability pa
-rameter based on the buckling load factors of the structures and their respective critical buckling modes. To this purpose, a comparative analysis
is performed in several idealized structures, from which an approximate equation for calculating the critical load factor based on the γz coeficient
is obtained. This equation was veriied by numerical analysis of Finite Elements Method models of real reinforced concrete buildings. It was con -cluded that the proposed equation presents satisfying results within a certain range of γz.
Keywords: global stability, second order global effects, gamma-z coeficient, critical load factor, reinforced concrete buildings.
A análise da estabilidade global tem se tornado cada vez mais importante no projeto de edifícios de concreto armado, sobretudo nos mais esbel-tos, por serem mais sensíveis aos deslocamentos laterais. A perda de estabilidade é usualmente associada à intensidade dos efeitos de 2ª ordem
e, nesse sentido, o coeiciente gama-z (γz) torna-se um importante parâmetro de avaliação deste problema. O objetivo deste trabalho é veriicar
a eiciência do γz como parâmetro de estabilidade global, tomando como base os fatores de carga de lambagem das estruturas e os respectivos
modos críticos de instabilidade. Para esta inalidade, é realizada uma análise comparativa de diversas estruturas idealizadas, de onde obteve-se uma equação para o cálculo aproximado do fator de carga crítica em função do coeiciente γz. A validação dessa equação foi realizada por meio
da análise numérica de modelos em Elementos Finitos de edifícios reais de concreto armado. Constatou-se que a equação proposta oferece
resultados satisfatórios para um certo intervalo de γz.
Palavras-chave: estabilidade global, efeitos globais de 2ª ordem, coeiciente gama-z, fator de carga crítica, ediicios de concreto armado.
a Faculdade de Engenharia Civil, Universidade Federal do Pará, , Belém, PA, Brasil.
Received: 04 Jun 2016 • Accepted: 16 Jan 2017 • Available Online: 04 Oct 2017
V. V. S. VIEIRA a [email protected]
S. J. RODRIGUES JUNIOR a [email protected]
1. Introduction
The global stability veriication is a fundamental requisite on the
design of a reinforced concrete building for it doesn’t present future problems that would affect its safety and, consequently, increase
its risk of collapse. Tall and slender buildings are, generally, more
sensitive to lateral displacements and designers should consider the effects.
A rigorous stability analysis involves the prediction of the struc-tures’ equilibrium path, just as the determination of its critical loads and instability modes. However, in most of structural analysis, the main interest is merely to determine critical loads and respective instability modes.
Most precise global stability analysis is not a simple process, being
sophisticated computational resources necessary. It evaluates the current condition of the structure regarding its stability limit through the relation of its critical load to the applied vertical load. In
addi-tion, this analysis provides the most critical deformed coniguration
of the structure.
Usually, during reinforced concrete buildings design, the global stability analysis is limited to considering or not the additional forces due the second order effects. Thus, one notes that there is no concern in evaluating the structure’s safety regarding its global instability critical load.
A simple manner to estimate the second order effects without the need for a geometrically non-linear analysis is through the
gamma-z coeficient (γz), a parameter obtained from a linear analysis that aims to evaluate the magnitude of the second order effects, being frequently used by designers as a reference parameter for global stability analysis.
Brazilian Standards 6118 [1] recommends that the γz coeficient should be applied, within certain limits, in the evaluation of the im-portance of the second order global effects, as well as in the
ampli-ication of the irst order effects for the estimation of inal forces in
the structure. However, these standards do not provide a superior limit that aims to restrain the magnitude of the second order effects in a way that the structures be free of global instability problems. This paper aims is to establish a relation between the γz coeficient
and the critical global buckling load factor according to concepts pre -sented on the literature and trough the analysis of idealized structures
with simpliied geometry. This relation will further be transformed into
an approximate equation which allows to estimate the critical load fac-tor from the γz coeficient. Later, some examples of real buildings are analyzed in order to validate the proposed equation.
For the modeling and processing of the structures, both idealized
and real buildings, the computational software SAP2000® V16.0.0,
one of the most known structural analysis systems in the market,
was used.
2. Second order efects
The second order effects appear when the equilibrium equation
is taken considering the deformed coniguration of the structure,
which causes a geometrically non-linear behavior.
According to Wight and Macgregor [2], by a second order analysis it
is possible to verify the global stability of the structure, once the in-stability occurs due the loss of equilibrium of the deformed structure.
Kimura [3] states that the larger the second order effects are, less stable the structure is and because of that the stability of a building may be evaluated by the calculation or estimative of these effects. As a way to simplify these analysis, the NBR 6118 [1] allows one to disregard the second order effects when they are not superior
than 10% to the irst order effects. This criterion is equivalent to the one adopted by the Eurocode 2 [4]. However, it is not suggested
in none of these codes a superior limit that aims to prevent the collapse of the structure due loss of stability caused by excessive lateral displacements.
The ACI 318 [5] proposes that the consideration or not of the
sec-ond order effects must be assessed in each loor of the building, obeying a limit of 5% relative to the irst order effects, in order to be ignored. This code also speciies a superior limit of 40% for the to
-tal second order moments relative to the irst order ones, ensuring the global stability of the structure when this condition is satisied.
As the second order effects require a nonlinear analysis, there can
be used reference parameters for performing a simpliied veriica -tion of the importance of these effects and, consequently, of the
global stability. For this purpose, the Brazilian Standards recom -mends the use of the alfa (
α
) and gamma-z (γ
z) coeficients. Only the latter will be discussed in this paper because it is the most commonly used.Besides the mentioned parameters, another method to evaluate the second order effects in reinforced concrete buildings uses the ratio between the total vertical load and the critical global load, named instability index by MacGregor and Hage (apud Fonte [6]). This parameter and the
γ
z coeficient are discussed in the follow -ing sections.3.
γ
zcoeicient
The
γ
z is a parameter created by Franco and Vasconcelos [7], which aims to evaluate the importance of the second order effectsin frame structures of at least four stores based on a irst order
linear analysis, being very convenient for structural analysis. Vasconcelos [8] explains that this method is based on the hypoth-esis that the successive elastic lines, induced by the applied verti-cal load on the deformed structure follow a geometric progression. The NBR 6118 [1] determines that, for each load combination, the
γ
z coeficient is calculated by:(1)
Where:
is the sum of the products of the total applied vertical forc-es on the structure in the considered combination by the horizontal displacements of their respective application points obtained from
the irst order analysis and;
is the sum of the moments generated by all the horizontal
forces of the considered combination taking the basis of the struc -ture as reference.
Feitosa and Alves [9] explain that changes in the horizontal loads do not inluence
γ
z, for the second order forces would be modiied proTo consider the physical non-linearity is mandatory for design and can be performed in an approximate manner by reducing the stiff-ness of the structural members as follows:
(2)
Beams: for and
(3)
(4)
Columns:
(5)
Where
I
c is the second moment of inertia of concrete, including,for T beams, the lange contribution;
E
ci is the concrete’s initialelasticity modulus;
A
s is the area of steel in tension andA
'
s is the area of steel in compression.The
γ
z coeficient also has the advantage can be used as an av-erage ampliier of the irst order effects for the approximate calcu
-lation of the inal forces of the structure. The NBR 6118 [1] admits
that the horizontal internal forces may be multiplied by
0, 95
γ
z so the second order effects to be considered, sinceγ
z is no greater than 1,30.The Brazilian Standards don’t propose a superior limit for
γ
z toensure the global stability of the structure. Vasconcelos and Fran -ça [10] states that for values greater 1,30 the structure is
exces-sively lexible, requiring further analysis by other methods in order
to avoid problems due vibrations and resonance. As reported by Kimura [3], buildings with
γ
z above 1,30 have a high degree of in-stability. In addition, the author recommends 1,20 as the maximum value to be used during design.4. Critical global buckling load factor (l)
The critical global buckling load factor (
l
) of a building is also a parameter that indicates the degree of stability of the structure andit is deined as the ratio of the critical global buckling load (
F
cr) to the applied vertical load (F
):(6)
According to Oliveira [11],
l
must multiply the vertical loads at their respective application points, resulting in the critical global load of the structure. This concept is better understood byobserv-ing Figure 1, where
l
is represented in a simple plane frame ex-ample. The sum of the applied load multiplied byl
is the criticalglobal buckling load of the structure.
Its value is determined through the resolution of an eigenvalues
and eingenvectors problem, in which the irst corresponds to the load factors and the later represents the multiple buckling modes. The equation that deines this type of problem is the following:
(7)
Where,
[ ]
K
e is the elastic stiffness matrix,
K
g
is the geometricstiffness matrix and
{ }
d
is the displacements vector. The eigen-values are the eigen-values ofl
for which the vector{ }
d
is a nontrivial solution. The eigenvectors{ }
d
are the critical modes respective to each eigenvalue.Burgos [12] explains that for the calculation of the critical global
buckling load factor it is admitted the hypothesis that there will be no signiicant change in the distribution of forces when the
Figure 1
Deinition of the critical global load factors
From:OLIVEIRA [11], adapted by the author.
Service situation Buckling situation
B
B
vertical loads are multiplied by
l
. In addition, this analysis does not include the second order effects, since it is admitted that the displacements vary linearly with the loads’ increase.The same author remarks that in practical situations it is im
-portant to know the first two critical loads in order to verify a possible interaction or proximity between the buckling modes.
And draws attention for the fact that
l
must be used only as a reference parameter, since there are cases where the struc-ture may suffer collapse due to a load considerably lower than the estimated.MacGregor and Hage (apud Fonte [6]) denominate instability index
(
Q
)the ratio between the total vertical load applied to the criticalglobal buckling load. Therefore, this parameter is the inverse of the
critical load factor, as described in equation (8):
(8)
The authors also suggest an ampliication factor which is similar The authors also suggest an ampliication factor which is similarto the
γ
z coeficient, which aims to evaluate the magnitude of the second order effects as a function of the instability index of thestructure. This ampliication factor is calculated as follows:
(9)
In terms of the critical global buckling load, the equation (9) is re -written as:(10)
Based on comparisons and statistical studies, these authors Based on comparisons and statistical studies, these authors
conclud-ed that a irst order analysis is suficient for structures where the Q is
equal or inferior than 0,0475, which corresponds to λ superior than 21 and fa (λ) inferior than 1,05. When Q is bigger than 0,2, that is,
λ < 5 and fa (λ) > 1,25, the collapse risk increases rapidly, thus it is not recommended that this limit is exceeded.
Comparing these limits with what is prescribed by the NBR 6118 [1] and with the values commonly adopted by structural engineers in Brazil, one gets:
Fixed nodes structures (the irst order analysis is suficient);
Free nodes structures (second order analy
-sis is required);
Collapse probability increases. In terms of critical global load factor:
Fixed nodes structures (the irst order analysis is suf
-icient);
Free nodes structures (second order analysis is required);
Collapse probability increases.
It stands out that the limit of 1,25 for the ampliication factor, as in
-dicated by McGregor and Hage (apud Fonte [6]) to avoid loss of
stability, was extended to 1,40 in the ACI 318 [5], for which the
ë
corresponds to 3,50.The NBR 6118/1980 [13] used to ix a inferior limit for the critical load.
These standards admitted that the safety of the structure was
guar-anteed when the buckling load was less than three times the charac -teristic load. Therefore, the structure should be considered unstable when
l is lower than 3, what corresponds to an ampliication factor
( )
l
a
f
equals 1,50. A limit for the second order effects magnitude related to global instability is not given by the Brazilian Standards.5. Methodology
This paper aims to presents a comparative study between the
γ
zcoeficient and the critical global buckling load in order to formu
-late an equation that properly re-lates these parameters. For this
purpose, multiple idealized structures based on the same plan are analyzed, having its column section and number of stores varying, resulting in spatial frames with varying global stiffness.
Aiming to verify the applicability of the
γ
z coeficient in the cal -culation of the global critical load, three real reinforced concrete buildings, built or under construction in the city of Belem/Pará, were analyzed. These projects were provided by the A. C. Athayde NetoProjetos Estruturais company. Some of the criteria adopted in this
paper may differ from the original design. Therefore, the results ob-tained can’t be, in any way, be compared to the original ones.
For this numerical modeling and analysis, the SAP2000® system ver -sion 16.0.0 was used. This commercial software for structural analysis
has vastly application on the market and was chosen because it per -forms the stability analysis in an automatic fashion, determining the global critical loads and the instability modes of the structure. The analysis of the structures, constituted by columns, beams and
slabs, were made through the Finite Elements Method (FEM). The
columns and beams were represented by frame elements with the
addition of rigid beam-column connection, as speciied by the NBR
6118 [1], and the slabs wee modelled by plate elements, consider-ing the rigid diaphragm in the distribution of lateral forces. The physical non-linearity was considered in an approximate man-ner through the reduction of the stiffness of the structural mem-bers, as recommended by NBR 6118 [1] for the global analysis of frame structures with a minimum of 4 stores, as indicated in equations (2), (3) e (5).
The wind loads were calculated following NBR 6123 [14] were ap-plied on the models as horizontal point loads concentrated on each
pavement according to the directions shown in Figure 2.
The
γ
z coeficient was calculated using the horizontal displace -ments obtained from the linear analysis. To determine it, it wasFigure 2
considered the safety formulation recommended by the NBR 6118
[1], by which the calculated second order effects are ampliied by
3
/
γ γ
f f and later byγ
f3, whereγ
f andγ
f3 equal 1,40 and1,10, respectively. The ultimate normal combinations adopted for its calculation are shown in Table 1.
In obtaining the critical load factor and the instability modes only the service values of the vertical loads were considered. The physical nonlinearity in this case was also considered in an ap-proximate manner.
6. Idealized structures
6.1 Structures’ description
The Typical Floor (or just Typical) drawn is used as an outline for all the modelled idealized structures is presented in Figure 3. It
is composed by 6 beams of rectangular cross-section of 20cm
x 45cm and 4 solid 12 cm thick slabs. The sections columns
were not intentionally indicated because they vary in the several cases studied
5 groups of structures were created and named A, B, C, D and
E, where each group is composed by models of equal number of stores. The quantity of Typical loors varies linearly from group to group: group A has 5 Typical; group B has 10 Typical and this way successively until group E, constituted by 25 Typical loors. Each of
these groups has 5 subgroups, numbered 1 to 5, that differ in the cross-section of the columns. This was made to generate a variety of
γ
z values within a group.Therefore, it were analyzed 25 different structures, all having the same blueprint as outline. It is important to warn that in this proce-dure there was no concern if the design of the columns regarding their ultimate limit states or minimum dimensions recommended by the Brazilian standards. The only aim in their design was to obtain a variety of
γ
z andl
parameters.In addition, it was admitted that distance between each loor and
the depth of the foundations don’t vary and are equal to 3,00 m and 1,50 m, respectively. In Table 2 are presented the main dimensions of these models.
6.2 Material properties
For all the structures, the compressive strength of the concrete
(
f
ck) was 30 MPa, resulting in an initial elasticity modulus of 31 GPa, according to the NBR 6118 [1] and admitting granite as coarse aggregate.6.3 Applied loads
The applied vertical loads are summarized in Table 3. For the dei -nitions of these loads, the buildings were considered to have
resi-dential purpose and that all the beams support brick walls. Regard -ing the horizontal loads, it was admitted that the wind loads are the only acting. The criteria adopted are shown in Table 4.
6.4 Structural analysis using SAP2000®
The idealized models were analyzed using SAP2000®, from
Table 1
Load combination
Comb. 1 1,4 · dead load + live load
Comb. 2 1,4 · dead load + 1,4 · (live load. + 0,6 · wind 90º)
Comb. 3 1,4 · dead load+ 1,4 · (live load + 0,6 · wind 270º)
Comb. 4 1,4 · dead load + 1,4 · (live load + 0,6 · wind 0º)
Comb. 5 1,4 · dead load + 1,4 · (live load + 0,6 · wind 180º)
Comb. 6 1,4 · dead load + 1,4 · (wind 90º + 0,5 · live load
Comb. 7 1,4 · dead load + 1,4 · (wind 270º + 0,5 · live load)
Comb. 8 1,4 · dead load + 1,4 · (wind 0º + 0,5 · live load)
Comb. 9 1,4 · dead load + 1,4 · (wind 180º + 0,5 · live load)
Figure 3
Table 2
Characteristics of the idealized structures
Group Number of loors Total height (m) Case Pillar dimensions (cm) P1 a P4, P6 a P9 P5
A 5 13,5
1 22 / 22 25 / 25
2 16 / 16 19 / 19
3 14 / 14 19 / 19
4 13 / 13 18 / 18
5 12 / 12 17 / 17
B 10 28,5
1 32 / 32 45 / 45
2 20 / 20 28 / 28
3 17 / 17 26 / 26
4 16 / 16 24 / 24
5 15 / 15 21 / 21
C 15 43,5
1 50 / 50 55 / 55
2 25 / 25 27 / 27
3 20 / 20 31 / 31
4 20 / 20 21 / 21
5 18 / 18 20 /20
D 20 58,5
1 73 / 73 80 / 80
2 31 / 31 40 / 40
3 25 / 25 33 / 33
4 22 / 22 30 / 30
5 19 / 19 27 / 27
E 25 73,5
1 95 / 95 100 / 100
2 38 / 38 45 / 45
3 30 / 30 30 / 30
4 25 / 25 36 / 36
5 21 / 21 30 / 30
Table 3
Vertical loads applied on the idealized structures
Dead loads Live load
Brick walls Slab cover Overload
5,40 kN/m 1,00 kN/m² 1,50 kN/m²
Table 4
Criteria for the deinition of the wind loads
Criteria Value
Basic Wind velocity (V0) 30 m/s
Topography factor (S1) 1,00
Roughness category (S2) IV
Statistic factor (S3) 1,00
Building classes
Structure A A
Structure B B
Structure C B
Structure D C
which it was obtained the data needed for the calculation of the
γ
z coeficient and the results regarding the elastic instability analysis (i.e. instability modes and critical global factor), whichare necessary for the later calculation of the ampliication coef
-icient
f
a( )
l
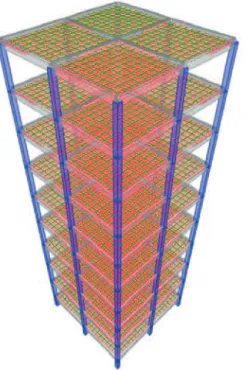
.Figure 4 shows one the models analyzed through SAP2000®. All
the models studied which were symmetric in direction X and Y, the results are equal for both directions. Therefore, it was calculated a single pair of values of
γ
z andl
for these structures, which arevalid for both principal directions.
6.5 Results and discussion
The calculated values for the
γ
z coeficient, critical global load factorl
and ampliication coeficientf
a( )
l
are presented inTable 5. In these analysis, there was no concern with ultimate or serviceability limit states, for the objective was only to establish a relation between the global stability parameters calculated, without considering the design of the structural members.
For purposes of comparison, the calculated values are show graphically in Figure 5, in which the horizontal axis corresponds to
the
l
factor and the vertical axis is the ampliication factor of theirst order forces.
It is observed that, until a value close to 1,50, there is good agree-ment between
γ
z andf
a( )
l
, which permits to establish the fol-lowing approximated relation:Figure 4
Spatial perspective of one of the idealized buildings
in SAP2000®
Figure 5
Relation of
γ
zand f
a(
λ
) coeficients and
λ
factor for
the idealized structures
Figure 6
(11)
Using (10) and (11) it is possible to relate the
γ
z coeficient and the critical global loadl
as follows:(12)
Hence, in order to indl
as a function ofγ
z it is suficient to isolate it in equation (12):(13)
This relation is valid for
γ
z within 1,00 and 1,50. The inferior limit isdue the impossibility of the division. The superior limit was ixed
based on the great discrepancy observed in higher values, as one
can see in Figure 6. With exception of the ive-story buildings, the
error found for
l
when calculated as a function ofγ
z are lower than 15% for the cases against safety and 10% for the in favor of security. It is concluded that under a limit of 1,50, the approximated equation provides satisfactory results. It is important to notice that even forγ
z higher than 2,00, the error found was inferior than 25%.The established relation holds only for the cases where the critical instability modes coincide with the principal directions for which
γ
z is calculated, that is, when the instability mode is translational in the X and Y directions.Having equations (12) and (13), it is now possible to determine the recommended limits of the main normative codes in function of the parameters
γ
z andl
.The criterion for ignoring the second order global effects varies
in the different standards. In Eurocode 2 [4] and NBR 6118 [1]
consider that when the second order effects are equal or lower
than 10% the irst order ones (
γ
z=
1,10
), corresponding to11
l
=
, they can be neglected. However, ACI 318 [5], where theveriication is performed loor by loor, the limit is taken as 5% and λ = 20.With regard to the global stability veriication, NBR 6118/1980 [13] suggested a safety buckling coeficient equals 3 (
l
=
3, 00
), which, using equation (13), corresponds toγ
z=
1, 50
. Consider-ing the ACI 318 [5], that recommends a superior limit of 1,40 forthe ratio between the inal global effects and the irst order ones
(
γ
z=
1, 40
), the value ofl
equals 3,50.For the
γ
z limited to 1,30 by the actual NBR 6118 [1] when usedfor the simpliied calculation of the global second order forces, the
relative
l
equals 4,33. All these limits are presented in Table 6.Table 5
Calculated values of the coeficients
γ
z,
λ
and f
a(
λ
) for the idealized structures
Structure Case γz λ (γz) λ (SAP) fa (λ) Coarse
A (5 Typical)
1 1,10 11,00 9,82 1,11
Translational
2 1,31 4,23 3,42 1,41
3 1,50 3,00 2,36 1,74
4 1,75 2,33 1,80 2,25
5 2,28 1,78 1,36 3,78
B (10 Typical)
1 1,11 10,09 10,42 1,11
Translational
2 1,33 4,03 3,62 1,38
3 1,58 2,72 2,33 1,75
4 1,80 2,25 1,86 2,16
5 2,37 1,73 1,38 3,63
D (20 Typical)
1 1,14 8,14 8,91 1,13
Translational
2 1,32 4,13 4,16 1,32
3 1,53 2,89 2,83 1,55
4 1,80 2,25 2,12 1,89
5 2,70 1,59 1,43 3,33
C (15 Typical)
1 1,12 9,33 9,73 1,11
Translational
2 1,35 3,86 3,60 1,38
3 1,60 2,67 2,43 1,70
4 1,83 2,20 1,91 2,10
5 2,39 1,72 1,43 3,33
E (25 Typical)v
1 1,16 7,25 7,79 1,15
Translational
2 1,35 3,86 4,04 1,33
3 1,57 2,75 2,82 1,55
4 1,81 2,25 2,27 1,79
7. Real buildings
7.1 Building 1
This residential building (Figure 7) is composed by 12 loors and it is 32,75 m high. The loors are: ground loor, 8 typical, water box and its cover. The height of the loors are presented in Table 7.
The concrete’s compressive strength (
f
ck) adopted is 25 MPaand its tangent elastic modulus is 28 GPa. The loors measure
15,93 x 47,58 m. The structure is constituted by solid slabs, pillars
and beams of rectangular cross-section (Figure 8).
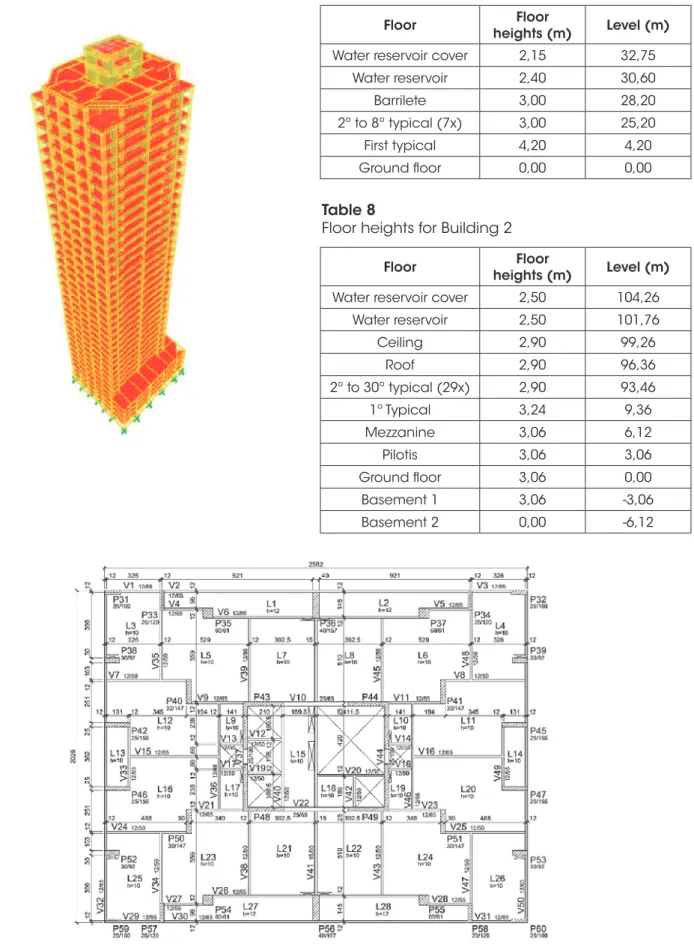
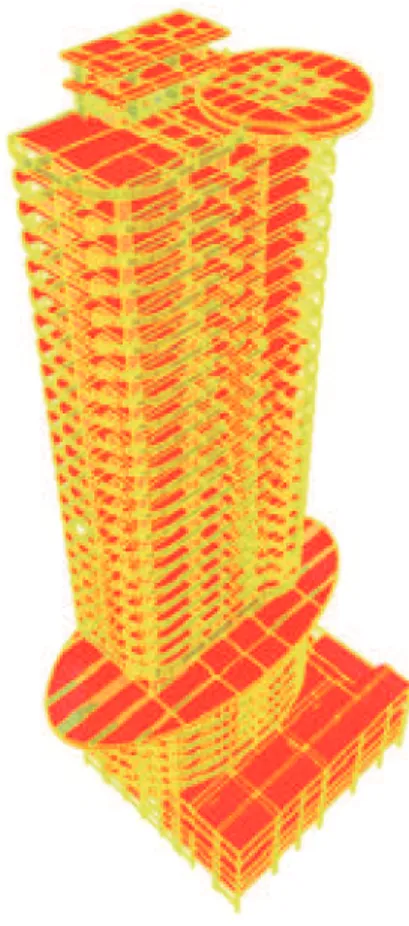
7.2 Building 2
This residential building (Figure 9) is 110,38 m high. The heights of the loors are presented in Table 8. The concrete’s compres -sive strength (
f
ck) adopted is 30 MPa and its tangent elastic modulus is 31 GPa. The structure is constituted by solid slabs,pillars and beams of rectangular cross-section (Figure 10). In ad
-dition, a L-shaped column of great stiffness is placed around the
elevator shaft.
7.3 Building 3
This commercial building (Figure 9) is 108,2 m high. The heights
Figure 7
Building 1
γz λ γz λ γz λ
NBR 6118/2014 [1] 1,10 11,0 1,30 4,33 -
-EUROCODE 2 [4] 1,10 11,0 - - -
-ACI 318 [5] 1,05 20,0 - - 1,40 3,50
NBR 6118/1980 [13] - - - - 1,50 3,00
Figure 8
Figure 9
Building 2
Figure 10
Outline of the typical loor of Building 2
Table 7
Floor heights for Building 1
Floor Floor
heights (m) Level (m)
Water reservoir cover 2,15 32,75
Water reservoir 2,40 30,60
Barrilete 3,00 28,20
2º to 8º typical (7x) 3,00 25,20
First typical 4,20 4,20
Ground loor 0,00 0,00
Table 8
Floor heights for Building 2
Floor Floor
heights (m) Level (m)
Water reservoir cover 2,50 104,26
Water reservoir 2,50 101,76
Ceiling 2,90 99,26
Roof 2,90 96,36
2º to 30º typical (29x) 2,90 93,46
1º Typical 3,24 9,36
Mezzanine 3,06 6,12
Pilotis 3,06 3,06
Ground loor 3,06 0,00
Basement 1 3,06 -3,06
of the loors are presented in Table 9. The concrete’s compressive
strength (
f
ck) adopted is 40 MPa and its tangent elastic modulus is 35 GPa. The structure is constituted by solid slabs, pillars andbeams of rectangular and L-shaped cross-sections (Figure 12).
Some of the beams were prestressed, but these effects weren’t considered in the present analysis.
7.4 Applied loads
The vertical applied loads were the same used during the build-ings’ design process, which are based on the recommendations of the NBR 6120 [15]. The dead load of the concrete members was
calculated using a speciic weight of 25 kN/m3. For the walls, it was considered a load of 1,80 kN/m2. The loor covering weight was 1,30 kN/m2. Beyond the dead load, a live load of 1,50 kN/m² for the residential buildings and 2,00 kN/m² for the commercial build -ings were considered. The remaining load followed NBR 6120 [15] recommendations.
The horizontal loads were considered due only the wind action and
were applied in the 4 directions indicated in Figure 2. The param
-eters for the determination of these loads were deined accordingly
to the suggestions of NBR 6123 [14] and are exposed in Table 10.
The Drag coeficients calculated for each building are presented
in Table 11.
7.5 Results and discussion
Table 12 shows the values obtained for the
γ
z coeficient consid -ering different wind directions. Table 13 presents the descriptionof the irst three buckling modes with their respective critical load
Water box cover 2,42 100,42
Barrel 1,65 98,00
Penthouse 2 1,35 96,35
Penthouse 1 3,00 95,00
9º to 28º typical (20x) 3,00 92,00
8º typical 5,70 32,00
7º typical 4,20 26,30
2º to 6º typical (5x) 3,00 22,10
1º typical 3,10 7,10
Mezzanine 4,00 4,00
Ground loor 2,60 0,00
1º to 2º garage (2x) 2,60 -5,20
Garage 3 0,00 -7,80
Figure 11
Building 3
Figure 12
factors
l
, obtained from the elastic stability analysis performed inSAP2000®, and the ampliication factors
f
a( )
l
for the cases in which the buckling occurs due translation.The results displayed in Table 12 are graphically presented in
Figure 15, as well as its relation to the
γ
z and correspondingl
limits. The first band represents the interval for which the second order global effects can be neglected. The second band is the range in which the second order nonlinearanaly-sis can be performed approximately using
γ
z . The next band contains the cases with high second order effect, but, admit-ting a limit ofl γ
( )
z equals 3,00, there is still reasonable safety regarding the global stability for X and Y directions.Lastly, there are the cases that present a high risk of collapse
due loss of stability.
The graph shows that the buildings are very stiff, having low
γ
z. However, for the where its value is higher than 1,10, a second order global effects analysis is obligatory.A comparison between
γ
z andf
a( )
l
is shown in Figure 13. Duethe stiffness of the buildings studied, the difference of these param-eters is negligible.
In Table 14, the values of
l
calculated by the simplified meth-od equation (13) and by SAP2000® are presented. Itsper-centage variation is graphically displayed in Figure 14. All the
variations are positive, indicating that the critical global factor
l
obtained by equation (13) are inferior than the calculated by SAP2000®. Therefore, although in some cases the differ-ences are bigger, the approximated equation provided reason-able and higher valuesNevertheless, it is important to remember that this estimative of
l
(using theγ
z coeficient) is not a suficient condition in the assessment of the global stability of the structure, since the calcu-lation ofγ
z presupposes the most critical instability would occur in the X and Y directions, and not always the translational modes are the most critical, existing cases where the most critical modeTable 10
Adopted parameters for the calculation
of wind loads
Criteria Values
Basic wind load (V0) 30 m/s
Topographic terrain factor (S1) 1,00
Roughness category (S2) IV
Statistic factor (S3) 1,00
Building class C
Table 11
Calculated drag coeficient for each building
Direction Drag coeficient
Building 1 Building 2 Building 3
90º 0,78 1,41 1,08
270º 0,78 1,41 1,08
0º 1,24 1,32 1,15
180º 1,24 1,32 1,15
Table 12
Results for the
γ
zcoeficient
Buildings Wind direction
0º and 180º 90º and 270º
Building 1 1,13 1,08
Building 2 1,12 1,12
Building 3 1,08 1,17
Table 13
Results of the elastic stability analysis
Buildings Buckling modes
1º λ1 fa (λ1) 2º λ2 fa (λ2) 3º λ3 fa (λ3)
Building 1 Translation
X 9,49 1,12 Torsion 10,73
-Translation
Y 14,03 1,08
Building 2 Torsion 4,98 - Translation
X 10,05 1,11
Translation
Y 10,75 1,10
Building 3 Translation
Y 8,33 1,14 Torsion 11,21
-Bending
Y - 964.59
Figure 13
Table 14
λ
factor calculated as a function of
γ
zand by SAP2000®
Buildings Wind direction γz λ (γz) λ (SAP)
Building 1 X 1,13 8,69 9,49
Y 1,08 13,50 14,03
Building 2 X 1,12 9,33 10,05
Y 1,12 9,33 10,75
Building 3 Y 1,17 6,88 8,33
is torsional. This situation is evident in Building 2, having irst a
torsional instability mode and other two translational modes in the directions X and Y.
To clarify this situation, an extra analysis of Building 2 was per-formed in SAP2000®, imposing a
γ
z coeficient equals 1,30. This state was reached by reducing the elasticity modulus of thecon-crete to a value close to 13 GPa. For this situation, the calculated
critical load factor
l
was 2,47 and the most critical buckling load remained torsional. The structure would not attend NBR 6118/1980[13] (
l = 3,00)
, although the correspondingγ
z is equal 1,30, value generally accepted.8. Conclusions
A comparison between the
γ
z coeficient andf
a( )
l
was per-formed using idealized structures and it was proved the results variation is negligible under 1,50.Assuming the equality of these parameters up until a speciic limit,
an approximate relation of them was established equation (13). This equation, therefore, permits to estimate the state of the structure with respect to its critical instability point in function only of the
γ
zcoeficient. In the idealized structures, the calculated errors in favor
of and against safety were lower than 10% and 15%, respectively. The results for the real buildings provided by the proposed equa-tion were satisfactory, providing values of
l
lower than the ob-tained from SAP2000®.However, the global stability analysis by means of the
γ
zcoef-icient was proved not to be sufcoef-icient for the cases where the most critical instability mode corresponds to a torsional coniguration of
the structure.
In a further analysis of Building 2 with
γ
z imposed and equals 1,30, the global stability criterion suggested by NBR 6118/1980[13] was not satisied. This case shows a clear ineficiency of
γ
zwhen the most critical mode is torsional.
9. Acknowledgment
The authors thank CAPES for the inancial support and the en -gineer Archimino Athayde for the data on the buildings used in this research.
10. Bibliographic references
[1] ASSOCIAÇÃO BRASILEIRA DE NORMAS TÉCNICAS.
NBR 6118 – Projeto de estruturas de concreto - Procedi-mento. Rio de Janeiro, 2014.
[2] WIGHT, J. K.; MACGREGOR, J. G. Reinforced concrete:
mechanics and design. 6 ed. New Jersey: Pearson Pren-tice Hall, 2009.
[3] KIMURA, A. Informática Aplicada em Estruturas de Concreto
Armado. São Paulo. PINI,2007.
[4] EUROCODE 2. Design of Concrete Structures—Part 1-1: General Rules and Rules for Buildings. CEN, EN 1992-1-1,
Brussels, Belgium, 2004, 225 pp.
Figure 14
Percentage variance of the calculated
λ
as a function of
γ
zand by SAP2000®
Figure 15
[5] ACI COMMITTEE 318. Building Code Requirements for
Structural Concrete (ACI 318-08) and Commentary,
Ameri-can Concrete Institute, Farmington Hills, Michigan, 2008. [6] FONTE, A. O. C. Análise não linear geométrica de edifícios
altos. Tese de doutorado - Programa de Pós-graduação
de Engenharia. Universidade Federal do Rio de Janeiro, COPPE/UFRJ. Rio de Janeiro, p. 223. 1992.
[7] FRANCO, M.; VASCONCELOS, A.C. Practical assessment of second order effects in tall buildings. In: COLOQUIUM ON THE CEB-FIP MC90, Rio de Janeiro. Proceedings,
p.307-323, 1991.
[8] VASCONCELOS, A.C. Em que casos não se deve aplicar o processo simpliicado do
γ
z para determinação dos efeitosde 2ª ordem?. In: SIMPÓSIO DE ATUALIZAÇÃO SOBRE A
NOVA NB-1, Belo Horizonte, 2002.
[9] FEITOSA, L. A. e ALVES, E. C. Estudo da estabilidade glob -al de edifícios -altos com lajes protendidas. Rev. IBRACON
Estrut. Mater.[online]. 2015, vol.8, n.2, pp.196-224. ISSN
1983-4195.
[10] VASCONCELOS, A. C.; FRANÇA, R. L. S. Um método sim
-pliicado e muito preciso para avaliação dos métodos de segunda ordem em edifícios altos usuais. FIP Symposium.
Johannesburg. 1997.
[11] OLIVEIRA, D. M. D. Parâmetros de instabilidade global das
estruturas de concreto armado segundo a nova NBR 6118. Dissertação de mestrado - Curso de Pós-Graduação da
Escola de Engenharia da Universidade Federal de Minas Gerais. Belo Horizonte, MG, p. 153. 2002.
[12] BURGOS, R. B. Avaliação de cargas críticas e comportamen-to pós-crítico inicial de pórticos planos. Dissertação de
mes-trado - Departamento de Engenharia Civil. Pontíicia Universi -dade Católica - PUC-RJ. Rio de Janeiro, RJ, p. 120. 2005.
[13] ASSOCIAÇÃO BRASILEIRA DE NORMAS TÉCNICAS.
NBR 6118 - Projeto e execução de obras de concreto ar-mado. Rio de Janeiro. 1980.
[14] ASSOCIAÇÃO BRASILEIRA DE NORMAS TÉCNICAS. NBR 6123 - Forças devidas ao vento em ediicaçoes. Rio de
Janeiro. 1988.
![Figure 7 Building 1 γ z λ γ z λ γ z λNBR 6118/2014 [1]1,1011,01,304,33--EUROCODE 2 [4]1,1011,0----ACI 318 [5] 1,0520,0--1,40 3,50NBR 6118/1980 [13]----1,503,00Figure 8](https://thumb-eu.123doks.com/thumbv2/123dok_br/18861496.418016/9.892.114.801.89.1144/figure-building-γ-λnbr-eurocode-aci-nbr-figure.webp)