Inluence of packing and dispersion of particles on the
cement content of concretes
Inluência do empacotamento e dispersão de partículas
no consumo de cimento de concretos
Abstract
Resumo
Due to environmental issues, the concrete chain seeks to reduce CO2 emissions. However, growing demand from developing countries causes the increase of CO2 emissions in production to exceed decreases generated by industrial actions, such as improving kilns and clinker replacement. New strategies are important. Changes in the concrete formulation, making it more eficient, can help if these changes produce concrete with the same performance and lower cement consumption. In this regard, the improvement of packing and dispersion of particles increases this eficiency. The better the packing, the lower the volume of voids between particles, thereby requiring lower luid content (water) to permit low. The dispersion of the particles also decreases the water content for the same luidity. The less the water content, the smaller the water/cement (w/c) ratio, and the greater the resistance. Thus, both strategies increase the eficiency by uncoupling obtaining luidity from the water content.
This study investigated the inluence of packing and dispersion on the eficiency of cement use in concrete. The increase of packing and the com-plete dispersion of ine particles has been shown to improve eficiency, as measured by the ratio between binder consumption and compressive strength (the performance parameter used in most practical applications).
Keywords: concrete, design eficiency, binder, CO2, sustainability.
Devido a questões ambientais, a cadeia do concreto busca reduzir emissões de CO2. Porém, a demanda crescente de países em desenvolvimento faz com que o aumento da produção supere as diminuições geradas por ações industriais como melhoria de fornos e substituição de clínquer. Novas estratégias são fundamentais. Mudanças na formulação de concretos, tornando-a mais eiciente, podem ajudar caso produzam concretos de mesmo desempenho e menor consumo de cimento. Neste sentido, a melhoria do empacotamento e dispersão das partículas aumentam esta eiciência. Quanto melhor o empacotamento, menor o volume de vazios entre as partículas, demandando menor teor de luido (água) para per -mitir luidez. A dispersão das partículas também diminui o teor de água para a mesma luidez. Quanto menos água, menor a relação a/c e maior a resistência. Assim, ambas as estratégias aumentam a eiciência ao desatrelar a obtenção de luidez ao teor de água.
Este trabalho estudou a inluência do empacotamento e dispersão na eiciência do uso do cimento de concretos. Demonstrou-se que o aumento do empacotamento e a completa dispersão das partículas inas permitem atingir melhor eiciência – medida pela relação entre consumo de ligan -tes e resistência à compressão (parâmetro de desempenho utilizado na maior parte das aplicações práticas).
Palavras-chave: concreto, eiciência de dosagem, ligantes, CO2, sustentabilidade.
a Escola Politécnica, Departamento de Construção Civil, Universidade de São Paulo, São Paulo, Brasil.
Received: 04 Jun 2015 • Accepted: 13 Mar 2017 • Available Online: 04 Oct 2017
B. L. DAMINELI a
[email protected] R. G. PILEGGI a
[email protected] V. M. JOHN a
1. Introduction
Due to the high magnitude of the CO2 released by the production of clinker, making a sustainable concrete is currently focussed primarily on replacing clinker using mineral admixtures, assuming that the min-eral admixture has lower or even zero emissions. There is also a sec-ond strategy of replacing natural aggregates by recycled aggregates, which is closely linked to the use of natural resources and reduction of waste disposal in landills. However, the increase in recycled aggre-gate content in concretes, if not properly made, frequently increases the cement content and therefore also increases CO2 emissions [1], which is, most of the time, neglected in an overall sustainability as-sessment. This strategy will not be discussed in this paper.
In the irst strategy, the impact is typically measured in kg CO2
emit-ted per cubic metre of concrete or, in a more practical evaluation, by the clinker replacement rate by such admixtures as blast furnace slag (BFS) or ly ash (FA). The lower the CO2/m
3 or the higher the
admixtures, the higher the eficiency in sustainability terms. However, the CO2 emissions from cement production have in-creased since the 1940s. This growth occurred despite some success in speciic reduction (kg/kg) of emissions, mainly due to increasing energy eficiency in kilns and replacing clinker. The cur-rent mitigation strategies have not been able to accommodate the growing global demand for cement [2]. To aggravate the situation, the production growth is inevitable and important due to social is-sues in developing countries. In addition, there is not enough min-eral admixture to increase clinker replacement rates [3], which may explain much of the increase in CO2 emissions.
Currently, cement is responsible for 5-8% of the total global CO2 emissions [4]. The global cement production forecast for 2050 varies between 3.69x10⁹ t/yr [2] and 5x10⁹ t/yr in a high growth scenario [5],
representing a factor of 2.5 increase over the production of 2010. If the mitigation strategies remain the same up to 2050, cement pro-duction can become responsible for 20-30% of the CO2 emissions [2,5]. This situation may be further aggravated if the allocation of CO2 to BFS and FA becomes a rule, as is a worldwide trend [6-8], or if a future shortage of these waste materials occurs [9-10].
Another option to reduce the environmental burden on clinker pro-duction is carbon capture and storage. However, carbon capture and storage is a very expensive strategy that can further increase the cement production costs, even doubling those costs [11-12], which is not sustainable as the most affected consumers would be the developing countries that need cement to ensure the construc-tion of infrastructure and low cost housing.
This article aims to provide a comparison between the eficiency of cement use in conventional and packing and dispersed designed concretes. This route for increasing concrete sustainability is new, since it could allow processing of concretes with the same per-formance and lower cement consumption – lower CO2 emissions.
2. Theory of packing and dispersion
of particles applied to concrete
technology for decreasing
cement content
According to the theory of packing of particles, the use of par-ticle fractions of different sizes – where the smaller parpar-ticles ill
the voids between the larger particles, successively to smaller and smaller sizes – can generate a system with a signiicant decrease in void volume. In the concrete, a luid is inserted to ill these voids and make particles move (ensuring the low, which is essential to enable moulding). Therefore, the control of the voids between par-ticles is crucial, since the lower this void volume, the lower the luid requirement for the same low.
In the speciic case of concrete, the lower the void volume between aggregates, the lower the volume of paste (cement plus water) necessary for the low. Considering that the concrete strength is given by the water/cement ratio (w/c), the decrease in paste vol-ume maintaining the same w/c can mean a reduction in the inal cement content maintaining resistance, which conigures an in -crease in use eficiency of the cement. Fluidity is no longer linked exclusively to water content as in the usual dosage technology. The problem is that, currently, luidity is seldom used in conven-tional concrete technology due to lack of parameters for measuring voids between aggregates.
There are several particle packing theories, many of them based on mathematical equations that try to calculate the volume of voids for a given set of particles of known size. Among these theories, this work will use the theory of Westmann and Hugill (1930) as modiied by Funk and Dinger [13]. Initially, the apparent volume of each size class in the granulometric distribution is calculated per Equations 1 to 4:
(1)
(2)
(3)
(4)
Where
αi = apparent volume of monodispersion i size class, deined by
equation x; xi = volumetric fraction of size class i; Vαi = apparent
volume calculated referenced in particle size class i; n = number of particle size classes in the complete distribution.
This calculation requires that the size classes of the particle size distribution follow a series of sieves with a ratio of ∜2, such as the complete series of ASTM E11. If the distribution to be analysed does not have the complete series of sieves, it must be recalcu-lated using interpolation. The apparent volume of monodispersions of each size class can be calculated by Equation 5:
(5)
Where
RTC = class size ratio, preferably ∜2; q = modulus of the ideal particle size distribution according to the Westmann and Hugill model (0.37, which provides the highest packing density for perfect spheres). The Westmann and Hugill modiied model is shown below.
particle size in relation to the original model. The model was de-signed for the calculation of the distribution module q, which indi-cates the slope of the accumulated granulometric curve.
(6)
WhereCPFT = accumulated percentage below D; D = particle size; Ds = smaller particle size of the distribution; Dl = largest particle size of the distribution; q = distribution modulus.
Through this model, Funk and Dinger [13] did computational sim-ulations where they determined the distribution modulus (q) that results in the highest packaging density. For perfect spheres, this value is q = 0.37, according to Figure 1 and the value used in Equation 5.
From Equation 5, the apparent volume Vai can be calculated for all size classes of the distribution. The largest apparent volume Vαi deines the size class with the lowest degree of packing and therefore the minimum porosity (voids between particles) expected for the complete granulometric distribution. From the largest appar-ent volume Vαi, the minimum expected porosity can be calculated from Equation 7:
(7)
WhereMPE = minimum expected porosity; Va = highest apparent volume calculated in Equation 5.
For the application of the model, some premises were adopted to simplify the calculations and interpretations: 1) all the particles found in a range of two sequential sieves are of the same diam-eter (monomodal system); 2) all particles are spherical; and 3) the particles settle randomly in the distribution - according to [13-15],
in this condition the porosity of a system of particles of equal and spherical diameters reaches 36 to 40%. In similar systems with or-dered packaging (which would resemble compact hexagonal and cube-centred crystalline atomic structures), this porosity may drop to as much as 26%. This value, therefore, can be changed, but it was in this work set on the worst condition.
It is true that the estimation of porosity through theoretical calcula-tions presents errors of dificult measurement – up to 4%, accord-ing to Funk and Daccord-inger [13] and Oliveira et al. [16] – due to the non-spherical morphology of the particles, which: 1) renders inac-curate measurement of their exact size in both sieving and imaging methods and therefore does not guarantee an accurate porosity calculation; and 2) generates variability of the actual porosity of the mixtures according to the method of densiication adopted, since non-spherical particles present different forms of deposition. Even so, this estimation allows us to introduce into the dosage technol-ogy a greater precision in the knowledge of particle packing com-pared to conventional techniques.
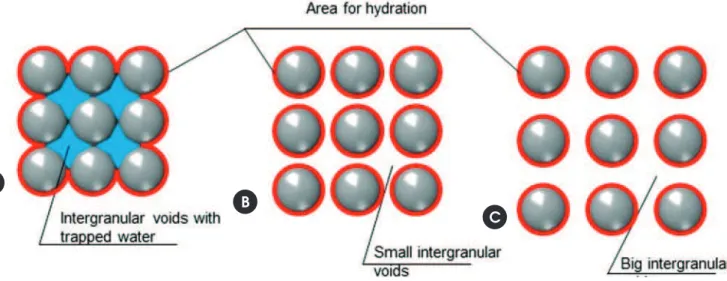
Fine particles (such as cement suspensions) tend to agglomer-ate due to their low mass and high surface area, factors that make surface forces predominate over gravitational forces. As the balance of the electric charges of the surfaces of the dif-ferent particles is not always in equilibrium, higher attraction forces are generated than the forces of repulsion. For the sus-pension, these agglomerates act as larger particles, which: 1) modiies the granulometric distribution; 2) hinders the mobility of low lines, since the agglomerates move more slowly and act as blocks to the smaller particles, increasing the viscosity [16]; 3) generates voids within the agglomerates, increasing water consumption; and 4) decreases the eficiency of the binders be-cause the surface area available for pozzolanic and hydration reactions is decreased (Figure 2). Thus, the total dispersion of the particles, especially ines, is a condition to make the packing project work. The condition of total dispersion of the paste must always be met, since without it the designed packing does not have any physical sense since it does not occur in practice. To obtain this dispersion with economic criteria, it is necessary to determine the minimum dispersant content required to generate the highest possible luidity of the system, which can be mea-sured with the aid of a paste rheometer (see item 3.2.1 - Deter-mination of optimum dispersant content). If, however, complete dispersion is not guaranteed, the error associated with the con-dition of total non-dispersion of the pulp cannot be determined objectively because it causes very different rheological varia -tions on a case-by-case basis.
3. Experimental planning, materials
and methods
3.1 Materials
A common CP V cement from the Brazilian market was used, with three different limestone illers, three different sands and three different gravels. The diversity of materials was due to the need for different particle sizes to achieve high levels of particle pack-ing in concrete.
A polycarboxylate dispersant was used.
Figure 1
3.1.1 Chemical and mineralogical characterization
Table 1 shows the chemical characterization of the ines used (cement and illers) obtained by X-ray luorescence using a semi-quantitative method, analysis of luorine and uranium chemical ele -ments, in an Axial Advanced PANalytical sequential spectrometer. Table 2 presents the mineralogical characterization obtained by X-ray diffraction performed in PANalytical X’Pert PRO equipment with X’Celerator detector, with quantiication by the Rietveld meth-od with the aid of the PANalytical Inorganic Structure Database.
3.1.2 Physical characterization
All materials exhibited the following physical properties:
A) Real density in He pycnometer, Quantachrome MVP 5DC equipment;
B) Particle size distribution (materials with particles>500 μm) by the vibrating sieving test using the complete series of sieves described in ASTM E11. Each sieving was performed for a minimum of 20 minutes. The series of sieves used was up to a minimum diameter of 106 µm, and the material passing through this sieve was characterized by laser granulometry (test b), and the inal granulometric particle size distribution was obtained through the interaction between the sieving re-sults and laser granulometry weighted by the mass of material of each diameter;
C) Particle size distribution (materials <500 μm such as cement, illers and ines of gravel and sand passed in the 106 μm sieve), by laser granulometry in a Malvern Mastersizer granulometer. The particles were mixed in a liquid environment (water for non-reactive materials, alcohol for cement) at approximately 15% concentration, and ultrasonically dispersed at 2000 RPM for 2 minutes prior to the test to disperse and individualize the particles and, thus, to determine the granulometric distribution with higher precision. The possible variations of density of the
particles by size range were neglected, with adoption of the av-erage real density measured by the test of He pycnometry; D) Speciic surface area by BET [18], Micromeritics Gemini 2375
equipment, with the use of nitrogen gas. The samples were previously treated by a degassing procedure coupled to the equipment, necessary to remove the possible impurities (gas-es) present on the surface of the sample, which signiicantly changes the results obtained. The degassing was carried out by application of vacuum pressure to the samples for 24 hours at a temperature of 100°C for the illers and 40°C for the cement. In the sieving test, the use of the complete sieve series of the ASTM E11 (19000 μm, 16000 μm, 12000 μm, 11200 μm, 9500 μm, 8000
Figure 2
a) Non-dispersed particles, causing water entrapping and low obstruction; (b) dispersed particles;
(c) dispersed particles with higher distance
B
B
B
A
B
C
Table 1
Chemical characterization of materials
by X-ray luorescence
Oxides
(%) CP V Limestone1 Limestone 2 Limestone 3
CaO 64.5 51.4 54.6 60.7
SiO2 15.5 2.21 2.26 3.68
Al2O3 2.81 0.05 0.07 0.1 Fe2O3 3.17 0.04 0.03 0.04
MgO 1.5 6.17 3.49 5.76
SO3 7.98 0.01 0.02 0.02
K2O 1.12 0.01 0.23 0.02
Na2O 0.3 – – –
P2O5 0.18 0.03 0.02 0.05
TiO2 0.26 – – –
Outros 0.34 0.03 0.04 0.04
μm, 6300 μm, 5600 μm, 4750 μm, 4000 μm, 3350 μm, 2800 μm, 2360 μm, 2000 μm, 1700 μm, 1400 μm, 1180 μm, 1000 μm, 850 μm, 710 μm, 600 μm, 500 μm, 425 μm, 355 μm, 300 μm, 250 μm, 212 μm, 180 μm, 150 μm, 125 μm, 106 μm) is critical when packing of the particles needs to be determined, since the theoretical packing calcu-lation models use all the particle size classes to improve the accuracy of void measurements between particles, as seen in item 2.
In the combination between sieve and laser granulometry, the dif-ference in size reported in the literature between results of sieving and laser granulometry (approximately 20%) was neglected [17]. The difference is higher the more the particles move away from the spherical shape since in sieving, the particle size is determined by its smaller size, whereas in the laser test, the particle size is the result of the average of several measurements taken at random angles (http://www.malvern.com/en/products/technology/laser- diffraction/default.aspx).
For the measurement of the surface area, Blaine’s diffused method was not performed because this technique does not yield precise results for the characterization of very ine particles with dimensions smaller than 10 μm [19]. NBR NM 76:1998 states that this tech-nique is used mainly to verify the uniformity of the milling process of a cement factory and allows only a limited determination of the properties of the cement and may not provide signiicant results for cements containing ultraine materials. This error occurs because the Carman-Kozeny equation, used in this method, is not valid for particles smaller than 10 μm [20]. We also observed that the results of Blaine present a low correlation with the luidity of pastes contain-ing illers, whereas results obtained by the BET technique present more correlation with rheological responses [21].
However, the BET test also presents possible sources of error in the measurements. Experimentally, it has been determined that the time and degassing temperature have an inluence on the results. Generally, the higher the sample surface area, the higher
the temperature and time need to be. However, some samples (such as cement) cannot be exposed to high temperatures in the degassing, under risk of chemical deterioration and alteration in the results. For the tested materials, a variability stabilization and an increase in the reproducibility of the measurements were ob-served for a 24-hour degassing time (performed in 2 laboratories by 2 different technicians). The equipment user’s manual suggest-ed 3-hour degassing, a value that did not yield good repeatability and reproducibility for the samples studied – higher variation and lower surface area values were found if compared to the values obtained after 24-hour degassing.
The sample amount also changes the BET results. For the correct measurement of the surface area, there must be a sample mass with a minimum of 1-5 m2 (50 m2 for measurement of the complete
isothermal adsorption curve). Thus, the lower the speciic surface area, the higher the required sample mass. If the speciic area is too small (too much mass required), there is the possibility that there is no container available for the test.
The BET result cannot be interpreted as an absolute value cause the BET result is dependent on the surface interaction be-tween the gas and the surface of the particle (there are variations of the positive and negative surface charges of both, as well as the orientation of the adsorbed molecules and the possibility of a double adsorption layer, depending on the charges). The adsorp-tion of the gas may be weaker or stronger depending on the ratios between the charges. If they are weaker, the gas does not pen-etrate the surfaces between the layers and the smaller voids or pores, because the actual measurement is only in the outer layers [22]. Different gases can deliver different results.
The BET equation also assumes that 1) the heat of adsorption of all the molecular layers after the irst is equal to the heat of liquefaction, and 2) in equilibrium, the surface condensation rate is equal to the evaporation rate of the irst or subsequent layers, which may intro
-Table 2
Mineralogical characterization of materials by X-ray diffraction – Rietveld quantitative method
% estimated Material
Name Chemical formula CP V Lim1 Lim2 Lim3
Alite (C3S) Ca3SiO5 54 – – –
Belite (C2S) Ca2SiO4 19 – – –
Calcite CaCO3 7 70 85 75
Brownmillerite Ca2(Al, Fe+3)
2O5 6 – – –
Dolomite CaMg(CO3)2 – 28 12 18
Calcium sulphate dihydrate Ca(SO4) (H2O)2 5 – – –
Calcium sulphate hemydrate Ca(SO4) (H2O)0,5 4 – – –
Aluminium calcium oxide Ca3Al2O6 3 – – –
Portlandite Ca(OH)2 2 – – –
Quartz SiO2 – 1 2 1
Tremolite Ca2Mg5Si8O22(OH)2 – – 1 3
Diopside CaMgSi2O6 – – – 3
duce intrinsic errors to the measurements. Finally, the BET equation is most useful under relative pressures of 0.05 to 0.45 – that is, it is not valid for any pressure [22]. For all these reasons, surface area measurements should be used with caution. However, because as in this study they are comparative measures with standardized pro-cedures, they are valid for the assessments performed.
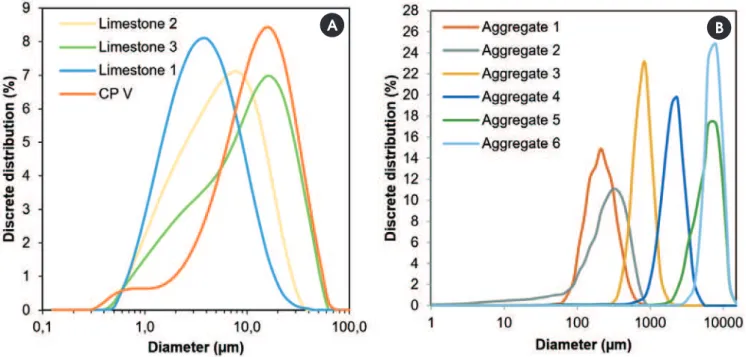
Figure 3 shows the particle size distribution of the materials. Table 3 presents the surface area (BET), m2/g, and the real density (He
picnometry), kg/dm3.
The CPV cement used had 33% water of normal consistency (NBR NM 43), 3:25 of start setting time and 4:45 of end setting time (NBR NM 65) and surface area of 5410 cm2/g by the Blaine method.
The dispersant used was a polycarboxylate powder (100% sol-ids) based on polycarboxylic ether, with a yellow colour appear-ance, density 0.30-0.60 (kg/dm3), pH 6.5-8.5 (measured in 20%
solids solution, temperature 20°C), and dosage recommendation of 0.05 to 1.00% in relation to the total mass of ines (data sup -plied by the manufacturer).
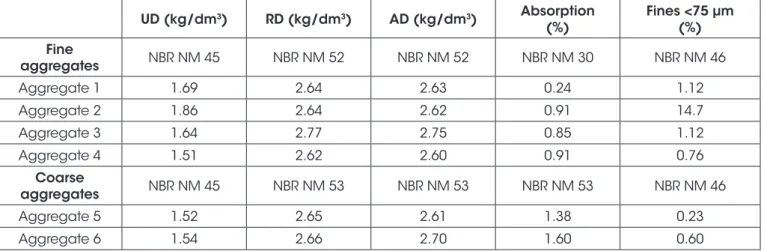
Table 4 presents the characterization of the selected aggregates for the experimental planning according to the related technical norms.
3.2 Methods
As the present study evaluated the inluence of particle packing and dispersion on the rheological behaviour and the eficiency of cement use in concretes, concrete dosages were determined by varying the particle packing levels. The low characteristics in fresh state and compressive strength in the hardened state were measured. All compositions were made with complete dispersion of ines by using the lowest dispersant content possible (optimum content), obtained by experimental test described in the following section.
3.2.1 Optimum dispersant content determination
As explained in item 2, the condition of total dispersion of the paste must always be met for guaranteeing the occurrence of the
designed packing. Anoptimum dispersant content determination test was performed, which, experimentally, proved to be the lowest content necessary to achieve the minimum possible viscosity and can be experimentally determined using a paste rheometer. The dispersant content was obtained individually for each of the ine materials by the steps:
1) Deinition of a ixed water/solids (w/s) ratio – in this case, 0.35. This ratio was a suitable experimental value for the materials, as determined by adding water to a constant solid powder mass to the point where the suspension could mix, even with difi-culty, without dispersant use according to the method by Fen-nis (2011). For each material, the chosen w/s was the one that provided the highest possible solid concentration without a vis-ible suspension desegregation, caused when the solid content is higher than the water can make wet (very low water, high
Figure 3
Particle size distribution of materials: a) ines (cement and limestone iller, d < 125 μm);
b) thick (aggregates – sand and gravel, d > 125 μm)
B
B
A
B
Table 3
Real density and surface area (BET) of materials
Category Material density Real
(kg/dm3)
Área supericial
(m2/g)
Cimento CP V 2.89 1.78
Fillers
Limestone1 2.62 2.97 Limestone2 2.63 2.15 Limestone3 2.65 1.46
Aggregates
viscosity) or when solids are so distant that luidity is made by water behaviour (high water content, low viscosity). The use of a ixed w/s ratio also allowed direct comparison between the dif -ferent mixtures. This condition (maximum solid concentration) makes the suspension more dificulty to disperse since particles are close and attractive forces are ageing. The ion concentra-tion is increased, which decreases the thickness of particle dual layer. This situation is the worst for a dispersant, so the disper-sant will be required in its maximum capacity.
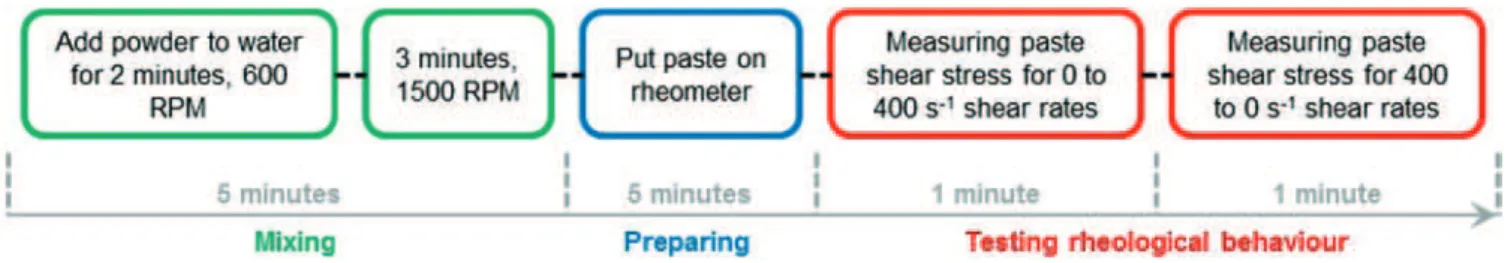
2) Mixture of 50 g powder with water (ixed w/s) without dispersant. The mixing was done adding powder to water in an IKA R1303 “Dissolver Stirrer” blender (Figure 4a) for 2 minutes at a rotational speed of 600 RPM. Then, blender rotation was raised to 1500 RPM, and the blending was performed for an additional 3 minutes. 3) Paste was placed on the AR-550 rheometer, TA Instruments,
plate-to-plate geometry (Figure 4b).
4) The rheological curve (shear rate x shear stress) was deter-mined by a low rheometry test. The test was standardized to increase (acceleration) the shear rate from 0 to 400 s-1 within
the time of 1 minute, with a shear rate measurement every 4 seconds. Then, the shear rate was decreased (decelerated) from 400 to 0 s-1, and shear stress was measured, resulting in a
round-trip rheological curve.
5) Repeat procedures 2 to 4 for increasingly dispersant contents. Rheometry low test for each blend (one test for each disper
-sant content) followed steps of Figure 5.
6) For each test, the apparent viscosity at the point of highest shear rate tested (400 s-1) was determined (the rate of 400 s-1
was adopted because it allows a more complete analysis of the rheological behaviour of cementitious materials).
7) Graphic “Dispersant content x apparent viscosity” was made for the determination of the lowest apparent viscosity level reached with the lowest possible dispersant content.
Figure 6a shows the various curves “shear rate x shear stress” for one of the materials studied. Figure 6b shows the graph “disper-sant content vs. apparent viscosity” resulting from the curves of Figure 6a.
The optimum dispersant contents of the materials CP V,
Lime-Figure 4
a) Paste mixing equipment, IKA R1303 "Dissolver Stirrer"; b) paste rheometer AR-550, TA Instruments
A
B
Table 4
Characterization of the aggregates according to the related standards – unitary density
(UD) (NM 45), real density (RD), apparent density (AD) (NM 52 – sand or NM 53 – gravel),
water absorption (NM 30 – sand or NM 53 – gravel) and powder content (NM 46)
UD (kg/dm3) RD (kg/dm3) AD (kg/dm3) Absorption
(%) Fines <75 μm (%)
Fine
aggregates NBR NM 45 NBR NM 52 NBR NM 52 NBR NM 30 NBR NM 46
Aggregate 1 1.69 2.64 2.63 0.24 1.12
Aggregate 2 1.86 2.64 2.62 0.91 14.7
Aggregate 3 1.64 2.77 2.75 0.85 1.12
Aggregate 4 1.51 2.62 2.60 0.91 0.76
Coarse
aggregates NBR NM 45 NBR NM 53 NBR NM 53 NBR NM 53 NBR NM 46
Aggregate 5 1.52 2.65 2.61 1.38 0.23
stone1, Limestone2 and Limestone3 were, respectively, 0.50%, 0.225%, 0.20% and 0.125%.
Nine experiments were randomly selected and repeated to deter-mine the experimental variation (deterdeter-mined by difference between repeated test results). The average variation found was approxi-mately 0.035 Pa·s, a small value if compared to the orders of mag-nitude of the apparent viscosities measured.
3.2.2 Design of high-packing concrete formulations
Several concretes were designed with various combinations of materials aiming for the increase in the packing of particles [23]. Packing was determined by the method of Westmann and Hugill (1930) modiied by [13], as described in item 2.
For all combinations, the optimum dispersant content by mass weighted average of the optimum dispersant values found for each ine were used (item 3.2.1).
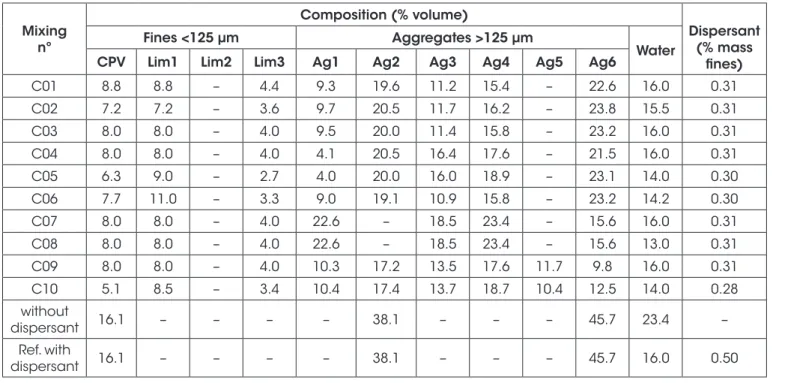
Table 5 shows the compositions, including two reference concretes designed by a conventional Brazilian method (one with no disper-sant, and other with dispersant at optimum content).
3.2.3 Slump low test
The concretes had the slump low measured by the procedures of the NBR NM 67. Concretes with high slump had measured their scattering from
1) performance of the standard slump low test procedure on a surface demarcated in diameters from 500 mm to 1000 mm, intervals of 100 mm;
2) determination of the time t necessary for the concrete to reach the 500 mm spreading;
3) determination of inal scattering size achieved.
3.2.4 Casting and cure
The 10x20 cm cylindrical specimens were cast. Procedures fol-lowed the recommendations of NBR 5738. After 1 day, specimens were taken to the humidity chamber (relative humidity ~ 100%, temperature 23 ± 2°C) and kept under moist cure for 28 days.
Figure 5
Flow diagram of continuous low rheometry test
Figure 6
Determination of the optimal dispersant content of the Limestone3: a) shear rate curves x shear stress
curves for 4 dispersant contents (4 different low rheometry tests); b) "dispersant content x apparent
viscosity" of the same tests. The rheological curve for the dispersant content = 0 was not shown since
viscosity achieved was very high
3.2.5 Compressive strength
The determination of the compressive strength was performed at 7 and 28 days according to the procedures of NBR 5739, three specimens for each age. Tests were carried out with the specimens in the wet state. Regularization of top and bottom surfaces was done in grit. The compressive strength test was performed in a Shimazdu press with a capacity of 200 tons.
3.2.6 Cement use eiciency
If, on the one hand, the emission of low CO2 levels can be achieved in conventional concretes by replacing clinker with mineral admix-tures such as blast furnace slag and ly ash, this is controversial, since: 1) usually CO2 emissions are simpliied by these admixtures, a fact already disputed by many researchers and even by the Eu-ropean Community [6-8]. If everyone were to implement this strat-egy, there would be an insuficient supply of these admixtures to lower the content of clinker signiicantly on a global scale [3,24]. Therefore, the decrease of the CO2 footprint of a concrete must also be achieved by strategies of optimization of the use of bind-ers – summarizing, designing to achieve the same level of per-formance with lower total binder content, whatever the binder. As seen in item 2, packing and dispersion of particles can help signii -cantly in this task.
Thus, to evaluate the improvement of cement use eficiency in the concretes of this work from the strategies of packing and disper-sion of particles, the indicator “Binder Index” (BI) [25] will be used. This BI is calculated by the ratio between the total binder content, in kg·m-3, and the performance (in this case, the compressive
strength, in MPa), according to Equation 8:
(8)
Wherebinder is the total binder content of the blend, in kg·m-3; CS is
28-day compressive strength, in MPa.
This indicator, expressed in kg·m-3·MPa-1, allows the analysis of
the relationship between the total amount of binders (economic and environmental impact) and a performance measurement (the most commonly used measurement for concrete is compressive strength). The higher the BI, the higher the binder content required for same performance and therefore the lower the eco-eficiency, and vice versa.
4. Results and discussion
Table 6 shows the total consumption of binders, water, rheological parameters, compressive strength at 7 and 28 days and BI calcu-lated for each concrete mix.
Data from Table 6 show that concretes C01 to C10 were designed with a common concern of reaching a high degree of packing – low intergranular porosity, between 4-8%, was obtained for all formula-tions. The concrete designed by the conventional method reached almost 23% of the intergranular voids, a much higher value com-pared to C01-C10, possibly showing that the usual design meth-ods do not take care with the intergranular void content.
For the packed C01-10 concretes, BI values achieved were lower than conventional reference concretes – even compared to the ref-erence with dispersants at optimum content. Refref-erence concretes presented higher BI even obtaining higher compressive strength – a situation in which it is often easier to reduce BI [25]. Just for com-paring, conventional concrete with dispersant reached 47.4 MPa
Table 5
Concretes designed by packing technology
Mixing nº
Composition (% volume)
Dispersant (% mass
ines)
Fines <125 μm Aggregates >125 μm
Water
CPV Lim1 Lim2 Lim3 Ag1 Ag2 Ag3 Ag4 Ag5 Ag6
C01 8.8 8.8 – 4.4 9.3 19.6 11.2 15.4 – 22.6 16.0 0.31
C02 7.2 7.2 – 3.6 9.7 20.5 11.7 16.2 – 23.8 15.5 0.31
C03 8.0 8.0 – 4.0 9.5 20.0 11.4 15.8 – 23.2 16.0 0.31
C04 8.0 8.0 – 4.0 4.1 20.5 16.4 17.6 – 21.5 16.0 0.31
C05 6.3 9.0 – 2.7 4.0 20.0 16.0 18.9 – 23.1 14.0 0.30
C06 7.7 11.0 – 3.3 9.0 19.1 10.9 15.8 – 23.2 14.2 0.30
C07 8.0 8.0 – 4.0 22.6 – 18.5 23.4 – 15.6 16.0 0.31
C08 8.0 8.0 – 4.0 22.6 – 18.5 23.4 – 15.6 13.0 0.31
C09 8.0 8.0 – 4.0 10.3 17.2 13.5 17.6 11.7 9.8 16.0 0.31
C10 5.1 8.5 – 3.4 10.4 17.4 13.7 18.7 10.4 12.5 14.0 0.28
without
dispersant 16.1 – – – – 38.1 – – – 45.7 23.4 –
Ref. with
at 28 days using 392 kg/m3 of cement, while C08, for example,
reached 40.2 MPa resistance using about half the amount of ce-ment (201 kg/m3).
Among the group of C01-C10 that obtained low BI, there are some (C01, C02, C03, C04, C07, C09) that achieved a lower BI than the conventional, even reaching slump values higher – 230 to 280 mm, or self-compacting. In the standard design conditions, slump increase is achieved with the increase of water – consequent in-crease of w/c, decreasing the compressive strength and hence increasing BI (considering the cement content unchanged). Thus, a higher packed concrete could be able to increase lowability (slump test measurement) without increasing water content (their water content, in L/m3, are very similar). In this case, considering
that the dispersion was standardized for all these concretes from the use of optimum dispersant content (and, in absolute levels, conventional concretes contained even more dispersant than the others), the relationship between water content and packing level can explain the lowability. Therefore, changes in the composition of concrete aggregates, with the use of particle packing tools, modify the concept of conventional design processes where to-tal water content is mainly responsible for the low. When inter -granular voids are modiied and controlled, these voids have a higher inluence than the water content on the lowability, since,
according to the packing theory presented, reduced void volume is responsible for optimizing the use of the luid – less luid is used to ill them, and more luid is effectively used for the par -ticle separation.
Regarding dispersion, comparing conventional concretes with and without dispersant, the not dispersed concrete required a much higher water content to obtain a much lower low, resulting in loss of strength and hence signiicant increase in BI.
It follows, therefore, that increasing the use eficiency of binder is related to the eficient use of water in the fresh state to cause particles to depart. The water content directly inluences the char-acteristics of the hardened state. The total paste porosity in the hardened state can be calculated by Eq. 9.
(9)
Where
VH2O combined = volume of total combined water = 0.23 g/g cement VH2O contraction = volume contraction of water due to chemical re-action, based on [25] (Equation 10):
(10)
Table 6
Data of material consumption, fresh state parameters, compressive strength at 7 and 28 days
Design conventional parameters Rheological parameters Compressive strength Eficiency
Mixing
C (kg/dm
3)
W
at
er (l/m
3)
a/c α m
Voids (%)
Slump (mm) Scatt
er
ing
(mm) t (s)
CS 7 (MP
a)
CS 28 (MP
a)
BI
(kg.m
-3.MP
a
-1)
C01 213.8 160.0 0.75 0.62 9.8 5.72 280 670 13.9 33.7 35.3 6.1
C02 176.0 155.0 0.88 0.60 12.2 7.38 230 – – 23.4 25.3 7.0
C03 194.4 160.0 0.82 0.61 10.9 6.57 270 600 18.5 27.6 29.2 6.7 C04 194.4 160.0 0.82 0.61 11.0 4.18 270 595 30 27.4 28.2 6.9
C05 156.7 140.0 0.89 0.58 14.2 4.62 60 – – 27.1 28.1 5.6
C06 191.1 142.3 0.74 0.61 11.4 5.44 190 – – 34.0 34.9 5.5
C07 194.4 160.0 0.82 0.61 10.8 7.66 270 600 19.7 26.2 29.1 6.7
C08 201.3 130.0 0.65 0.61 10.8 7.66 40 – – 39.0 40.2 5.0
C09 194.4 160.0 0.82 0.61 10.9 6.10 270 600 20 25.0 27.2 7.1
C10 126.9 140.0 1.10 0.60 17.6 7.09 20 – – 19.5 21.5 5.9
Ref without dispersant
357.7 234.0 0.65 0.55 5.0 22.89 140 – – 32.1 32.0 11.2
Ref with
dispersant 392.2 160.0 0.41 0.55 5.0 22.89 230 – – 43.3 47.4 8.3
Legend: C = cement consumption; w/c = water/cement; α = mortar content; m = aggregates content; Porosity = intergranular porosity calculated
Figure 7
Correlation between: a) paste porosity and cement content; b) cement content and compressive
strength of studied concretes. Red dots are low-packing concretes made from pure cement (paste); blue
dots are high-packing concretes made from limestone-cement (paste)
A
B
Figure 8
Correlation between paste porosity and BI of
studied concretes. Red dots are low-packing
concretes made from pure cement (paste); blue
dots are high-packing concretes made from
limestone-cement (paste)
Figure 9
Figure 7.a shows that concretes made with cement-iller pastes (high-packing), when compared to concretes with pure cement pastes (low-packing), can achieve similar paste porosity with a much lower cement content. From this observation, it is a conse-quence that they can achieve the same compressive strength using a lower cement content, as shown in Fig. 7.b. On both graphics, the presence of two very distinct groups is clear – the high-packed (blue) and the low-packed (red). The packing of particles was re-sponsible for the changes in the correlations between paste porosity x cement content x compressive strength since it allows the mixing of the concretes with lower cement content using the same or lower water content. Equation 9 shows that paste porosity – which com-mands compressive strength – is much more inluenced by a low water content (decreases total water in the denominator, by a factor of 1) than a high cement content (increases the combined water by 0.23). Figure 8 shows that BI is lower for the packed concretes com-pared to non-packed concretes with similar paste porosity.
Figure 9 presents data for the BI benchmark shown in [25] with inclusion of the results presented in this paper. In general, de-signed concretes (gray dots) showed BI lower than data found in the national literature (green dots) – with the exception of two points of the dosage by the conventional Brazilian method (black dots), which get confused with the rest of the concrete found in the benchmark, with less eficient binder use.
5. Conclusions
Even with actions by the cement industry to reduce the speciic emissions of CO2 in production, an increase in total emissions is expected due to expected increasing production. A promising strat-egy is to increase the use eficiency of the cement and other bind -ers in the concrete, which means designing concrete with lower consumption and achieving the same performance.
This article demonstrated how packing and dispersion of particles may help increase the eficiency of use of binders in concrete. Concrete designed with lower intergranular voids (between par-ticles) has been found to have water content reduced even with the same lowability in the fresh state, or, using the same water con-tent, obtain higher lowability – less water is used to ill the voids, more water remains active for detaching particles effectively. Reference concrete with dispersant, for example, used the same 160 litres of water (L/m3) as the C01, C03, C04, C07 and C09, but
ob-tained a slump of 230 mm while all others obob-tained slump of 270-280 mm and spreading 600-670 mm, due to the void content of 22.9% of reference concrete against values between 4-6.5% of the others. The possibility of decreasing the water content to obtain the same luidity allows: 1) a reduction of the w/c ratio, consequently increasing the compressive strength; or 2) a replacement of part of the cement by iller (lower water content and lower cement content, maintaining w/c and compressive strength unchanged). In both cases, there is a decrease in the Binder Index (BI). In the same concretes compared above, there is an approximate reduction of the BI from 8 kg·m-3·MPa-1
(reference) to 5.3-6.5 (other), that is, an approximate reduction of 18-33%, which means an increase in eco-eficiency.
Moreover, the complete dispersion of particles also showed the request for lower water content to achieve the same or higher low-ability with the same resulting eficiency gains.
The strategy – increasing the eficiency of use of water and binder – can be used together with other strategies that have been con-solidated, such as clinker replacement by mineral admixtures to mitigate CO2 emissions. Their combination could amplify the ben-eits, because in the end the inal clinker content would be a mul -tiplication of both factors (total clinker reduction in the paste plus total paste content reduction).
The particle packing tool is an application of a concept of particle physics on concrete. The interaction of this tool with established dosage methods, such as the reference method used in this work, can be useful for the design of more eficient large scale concretes, since it could introduce the control of intergranular porosity through calculations from the data of the raw materials (without the need to carry out experiments of experimental determination of the pack-ing). This property would be highly important, since the experimen-tal determination of the packing (also possible) requires a time that may be unviable on the scale of application of the concrete. Due to the size of the concrete production chain, a more sustainable future depends on the improvement of the dosages with emphasis on the speed and ease of application, as well as on the interaction between different clinker reduction strategies.
6. References
[1] DAMINELI, B. L; JOHN, V. M. Avaliando a eco-eiciência do uso de resíduos de forma simpliicada. In: ENARC 2011, 2011, Maceió, Brasil. Proceedings... Maceió: II ENARC, 2011. CD-ROM.
[2] WORLD BUSINESS COUNCIL FOR SUSTAINABLE DE-VELOPMENT (WBCSD) / INTERNATIONAL ENERGY AGENCY (IEA). Cement Technology Roadmap 2009 – Car -bon Emissions Reductions up to 2050, 2009. 36p. (CSI Re-port). Disponível em: <http://wbcsd.org>.
[3] DAMINELI, B. L.; JOHN, V. M. Developing low CO2 con-cretes: is clinker replacement suficient? The need of ce -ment use eficiency improve-ment. Key Engineering Materi-als, v. 517, p. 342-351, 2012. doi:10.4028/www.scientiic.net/ KEM.517.342
[4] BERNSTEIN, L. et al. Chapter 7: Industry. In: METZ et al (ed). Climate Change 2007: Mitigation. Contribution of Work-ing Group III to the Fourth Assessment Report of the Inter -governmental Panel on Climate Change. Cambridge Univer-sity Press, Cambridge, United Kingdom and New York, USA, 2007. p. 447-496. (IPCC Report).
[5] MÜLLER, N.; HARNISH, J. A blueprint for a climate friendly cement industry. Gland: WWF Lafarge Conservation Part-nership, 2008. 94p. (WWF-Lafarge Conservation Partner-ship Report).
[6] AMMENBERG, J.; FEIZ, R.; HELGSTRAND, A.; EKLUND, M.; BAAS, L. Industrial symbiosis for improving the CO2-performance of cement production. Final report of the CE-MEX-Linköping University industrial ecology project, 2011, 149p. Disponível em: <http://www.diva-portal.org/smash/ get/diva2:474457/FULLTEXT01.pdf>.
Recy-cling, v. 54 (12) (October): p. 1231–1240, 2010.
[8] EUROPEAN UNION. Directive 2008/98/EC of the European parliament and of the council on waste and repealing cer-tain directives. Off J Eur Union, L312, p.3–30, 2008. Dis-ponível em: http://eur-lex.europa.eu/LexUriServ/LexUriServ. do?uri=CELEX:32008 L0098:EN:NOT
[9] HÖOK, M. et al. A supply-driven forecast for the future global coal production. Contribution to ASPO, 2008. 48p. Disponível em: <http://www.tsl.uu.se/uhdsg/Publications/Coalarticle.pdf>. [10] SMITHERS APEX. Future of ferrous slag: market forecasts
to 2020. 2009. 144p. (Market Report). Disponível em: < https://www.smithersapex.com/global-ferrous-slag-market-poised-to-reach-almost-usd28-billion-by-2020.aspx>. [11] HOENIG, V.; HOPPE, H.; EMBERGER, B. Carbon Capture
Technology – Options and Potentials for the Cement Indus-try. PCA R&D Serial no. 3022 (Technical Report). European Cement Research Academy, Germany, 2007. 98p.
[12] ANDERSON, S.; NEWELL, R. Prospects for Carbon Cap-ture and Storage Technologies. Annu. Rev. Environ. Resour., n. 29, p. 109-142, 2004.
[13] FUNK, J. E.; DINGER, D. R. Predictive process control of crowded particulate suspensions applied to ceramic manu-facturing. Boston/Dordrecht/London: Kluwer Academic Pub-lishers, 1994. 765p.
[14] DE LARRARD, F. Concrete mixture proportioning: a scien-tiic approach. Modern Concrete Technology Series, vol. 9. London: E&FN SPON, 1999. 421 p.
[15] YU, A. B.; STANDISH, N. Estimation of the porosity of par-ticle mixtures by a linear-mixture packing model. Ind. Eng. Chem. Res., v. 30, p. 1372-1385, 1991.
[16] OLIVEIRA, I. R. et al. Dispersão e empacotamento de partículas – princípios e aplicações em processamento cerâmico. São Paulo: Fazendo Arte Editorial, 2000. 224 p. [17] ERDOGAN, S. T. et al. Micrometer-scale 3-D shape char
-acterization of eight cements: Particle shape and cement chemistry, and the effect of particle shape on laser diffraction particle size measurement, Cement and Concrete Research, v. 40, p. 731-739, 2010.
[18] BRUNAUER, S.; EMMETT, P. H.; TELLER, E. Adsorption of gases in multimolecular layers. Journal of American Chemis-try Society, v. 60, n. 2, pp. 309-319, 1938.
[19] Hunger M, Brouers, HJH, Flow analysis of water-powder mixtures: application to speciic surface area and shape fac -tor, Cement and Concrete Composites 31 (2009) 39-59. [20] HUNT, L. P.; ELSPASS, C.W. Particle-size properties of
oil-well cements. Cement and Concrete Research, v. 16, n. 6, pp. 805-812, 1986.
[21] ESPING, O. Effect of limestone iller BET(H2O)-area on the fresh and hardened properties of self-compacting concrete. Cement and Concrete Research, n. 38, p. 938-944, 2008. [22] CARTER, D. L.; MORTLAND, M. M.; KEMPER, W. D.
Chap-ter 16: Speciic Surface. In: Methods of Soil Analysis: Part I – Physical and Mineralogical methods. 1986.
[23] DAMINELI, B. L. Conceitos para formulação de concretos com baixo consumo de ligantes: controle reológico, empacotamento e dispersão de partículas. São Paulo, 2013. Tese (Doutorado). Escola Politécnica, Universidade de São Paulo, 237p.
[24] OLIVEIRA, V. C. H. C. et al. Estratégias para a minimização da emissão de CO2 de concretos. Ambiente Construído, Porto Alegre, v. 14, n. 4, p. 167-181, 2014.